 |
|
|
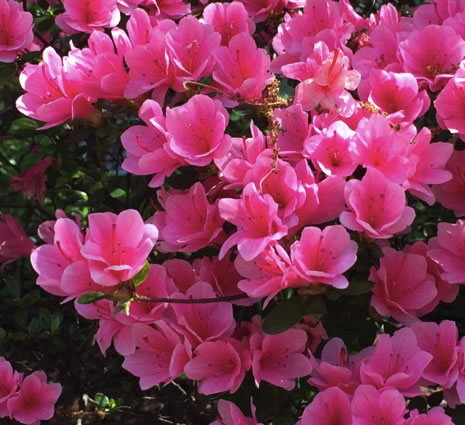
Fall 2015 Research Rotation Writeup by Giada Arney (Astronomy and astrobiology grad student) This spring, I completed my astrobiology research rotation at NASA Goddard Space Flight Center! The goal of my rotation was to get I arrived at Goddard on April 13, 2015. In mid-April, the spring air was still brisk and chilly, but this changed rapidly as we moved into May as the azaleas burst into flower as you can see in the picture at right (I was living in the Takoma Park area, and one of its nicknames is “Azalea City.” I totally understand why after spending springtime there!). At Goddard, I was introduced to Drs. Aki Roberge and Avi Mandell, other members of the Goddard ATLAST team who I’d met briefly before at conferences. I started working with them and attending ATLAST team meetings, so I was fully immersed in the discussions and concerns of early stage mission planning almost immediately.
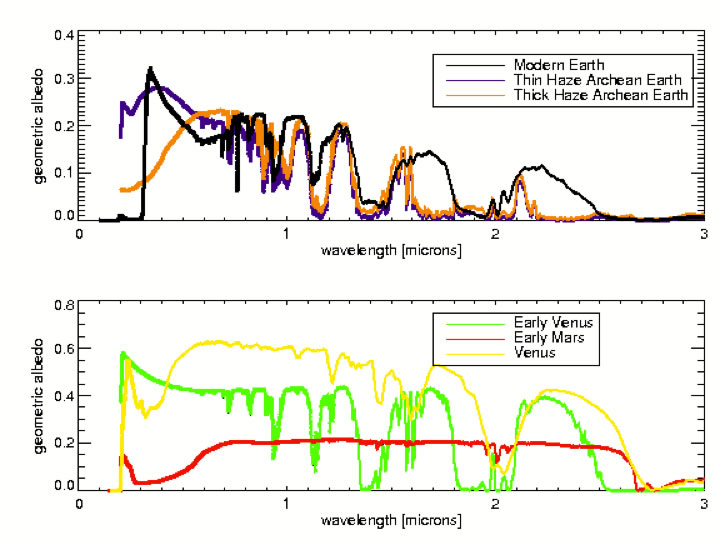
Haystacks Haystacks had simulated observations of the modern solar system, but a major theme of my own research at UW is understanding how planets can change through time. So, one of my first projects was adding the early solar system (~3 billion years ago, corresponding to the Archean geological era) to Haystacks. I had previously generated spectra of Archean Earth (4-2.5 billion years ago) with an organic haze, which I provided for Haystacks, and I generated new spectra of plausible early versions of Venus (based on Earth covered by water clouds and without biogenic gases) and Mars (based on an early Mars atmosphere generated by fellow UW grad student Meg Smith; Smith et al., 2014). The spectra are shown below in Figure 1.
Figure 1. Spectra of planets used in the “early solar system” Haystacks model with modern Earth and modern Venus added for comparison. The spectra in Figure 1 provide a good example of a type of challenge future exoplanet observations may face. Note how the strong short wavelength absorption (wavelength < 0.6 μm) of the “thick haze Archean Earth” spectrum superficially mimics the short wavelength absorption from iron oxide on Mars (seen at wavelength < 0.7 μm) and the feature from Venus’ unknown UV absorber and SO2 (wavelength < 0.5 μm). Very different processes on these very different worlds generated these similar spectral features. Archean Earth’s organic haze formed from methane photolysis, and the bulk of that methane was produced by biology, so for Earth, this haze might be regarded as a sign of life. The nature of Venus’ unknown UV absorber is still a mystery (hence the ‘unknown’ in its name!), but it may be caused by ferric chlorine cores or elemental sulfur coatings of sulfuric acid cloud particles [Markiewicz et al., 2014]. Mars’ iron oxide feature is the result of past oxidation (i.e. rusting) of its surface, possibly through processes involving ancient liquid water. If a spectrograph characterized these worlds and provided no spectral information for wavelengths longer than about 0.7 μm, it might appear that Archean Earth, modern Venus, and Mars are similar. Clues to the true nature of these worlds can be found at longer near infrared wavelengths where methane, water, and carbon dioxide produce strong absorption features. The wavelength range of ATLAST (or any similar space telescope attempting to characterize exoplanets) will have to be chosen carefully and be sufficiently broad to enable characterization of a diverse suite of worlds. There would have been more dust in the Archean solar system billions of years ago. We used a scaling relationship for Archean dust density from Su et al. (2006) (dust ~ t0/t with t0 = 150 million years) to scale the dust level and approximated the Archean dust density as 3 times the modern level. The Archean sun was dimmer than the modern sun but more active at UV wavelengths, so its spectrum was scaled according to the relationship from Claire et al. (2012). A frame from the Archean haystacks datacube is shown in Figure 2.
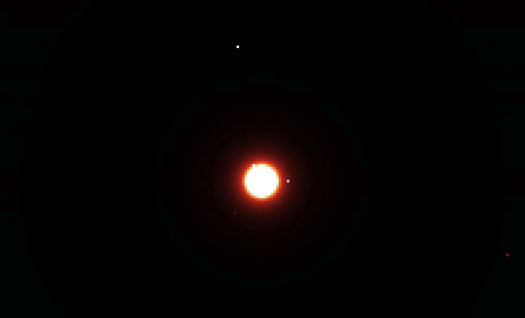
Figure 2: A frame from the Archean Haystacks datacube. The bright circular region in the center of the simulation is exozodiacal dust in the inner solar system. The inner planets are: Venus (11 o’ clock position), Earth (3 o’clock), and Mars (6 o’ clock, barely visible). The outer planets visible here are Jupiter (11’o clock near the top of the frame) and Saturn (4 o’ clock near the right edge of the frame). Although Haystacks has a realistic exozodi model, it was missing a few other noise sources that might confuse observations of exo-Earth: background galaxies and Milky Way stars. My next project was to add these to the model. I went to the Space Telescope Science Institute in Baltimore with Shawn and Aki to meet with Dr. Gregory Snyder, a researcher whose focus is galaxy simulations. Our requirements for the “ideal” background galaxy field was to have a pixel scale (0.1 milliarcseconds per pixel) and spectral resolution that matched the Haystacks model. Gregory was kind enough to provide us with galaxy fields that matched our pixel scale requirements in the Hubble Space Telescope V, I, Z, J, and H filter bands. I was able to interpolate between these filter bands to recover spectral resolution that matched the Haystacks model. The density of the Milky Way stars in a given field of view depends on the galactic latitude (i.e. the height above the plane of the galaxy, where most of the stars are concentrated) we observe at. The TRILEGAL Milky Way simulator [Girardi et al., 2005] worked well for our purposes of getting stars into the model. TRILEGAL generates starfield densities at user-input latitude. Figure 3 shows the Haystacks model’s full exozodi against a field of background galaxies and Milky Way stars at galactic latitudes of 3 degrees (left) and 15 degrees (right). The Haystacks model is currently being written up in Roberge et al., in prep.
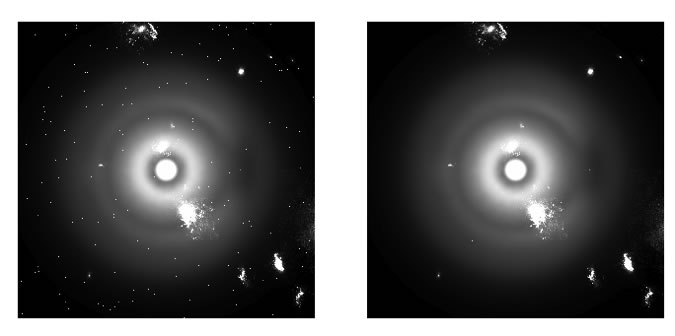
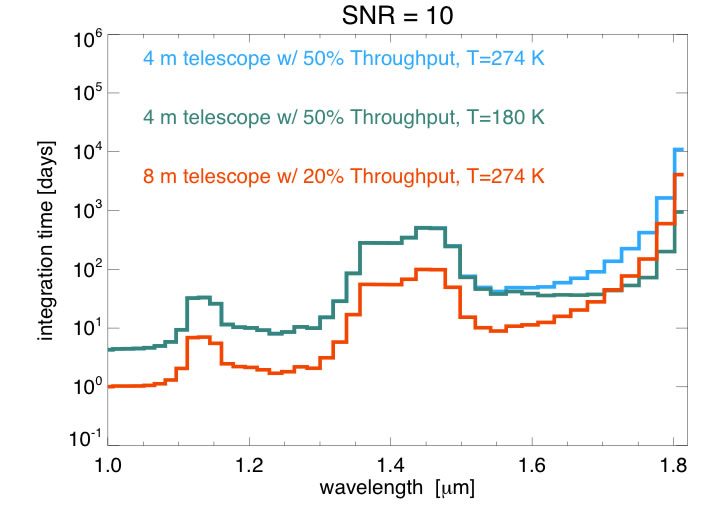
Figure 3: The haystacks model at 3 (left) versus 15 (right) degrees above the galactic plane. The higher density of stars closer to the galactic plane is clearly seen by comparing the number of point sources in the left and right frames. The ATLAST Noise Simulator The integration time required to spectrally characterize a planetary target depends on a number of factors including the size of the telescope, the system throughput, and the telescope’s operating temperature. The ATLAST nominal operating temperature is 274 K: this is the temperature the telescope would be tested at on the ground and is just warm enough to prevent ice crystallization on the optics. To maintain consistency with the conditions it was tested in, the telescope in space would be heated to 274 K so that it operates in the same conditions it was tested in, which was surprising to me! To go significantly colder, expensive cryogenic cooling is necessary for the ground tests, and this has been a major cost driver of the upcoming James Webb Space Telescope. There is a trade off we need to be concerned with here: observations at longer wavelengths require a cryogenically cooled telescope because the telescope’s thermal background starts to overwhelm the signal from the planet (see figure 4), but this is costly. Is it worth it? This is a question the ATLAST team is still grappling with, and simulators help us to understand what observations will be feasible with different telescope architectures.
Figure 4: The integration times necessary to observe Earth in the near-infrared at a distance of 10 parsecs for a signal-to-noise of 10 for three different telescope architectures at a spectral resolution of 70. Note how the different telescope temperatures affect the integration times at longer wavelengths. "Throughput" refers to the fraction of starlight going into the telescope that actually reaches the detector. The time I spent at Goddard was great for my professional development, and I am very glad to have had this opportunity! Although my time at Goddard was short, I now know a lot more about the early stages of mission design and planning, and I’m excited for the future of exoplanet direct imaging. References
|
|
 experience with early stage mission planning, so I was going to work on development of simulators for ATLAST (Advanced Technology Large Space Telescope) with Dr. Shawn Domagal-Goldman. ATLAST is a future telescope concept currently being studied for a space-based telescope with a mirror 8-16 meters in diameter! For comparison, Hubble has a mirror that is "just" 2.4 meters in diameter. The future is...faint. We need a very large telescope mirror in order to be able to see and characterize very dim Earth-sized exoplanets. Consider this: an Earth-sized exoplanet is ten billion times dimmer than a sunlike star!