|
B CUSP 110 – Digital Thinking Homework 7: Drawing with Processing |
|
|
Goal:
The objective is to practice using the Processing language.

University Logos
Schools design fancy logos so people quickly recognize their “brand.” For example, MIT uses the logo at top. UW could have a logo on this idea, too. For example,
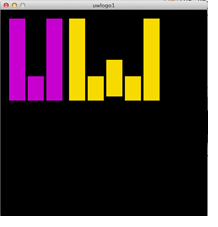
Part 1. Write a Processing program to display this new UW logo as shown above. You will need to follow these steps:
a) Open a new Processing window of size(500,500) and give it a black background. Hint: To locate the RGB values for colors, check Tools > Color Selector.
b) You will need two fill( ) commands, and eight rect( ) commands. Hint: To be reminded of how those two commands work, check Help > Reference.
c) Begin with a fill( ) command and a rect( ), and then try it out. Hint: The logo starts at position 20,20 and the ‘font’ is made up of bars that are 40 pixels wide and 180 pixels high; the shortest bars are 60 pixels high, and the middle box of the ‘W’ is 90 pixels high.
d) Comment your work (don’t forget your name!). That is, on each line write a // which causes the computer to ignore what follows, and give an explanation, as in
size (500, 500); // Define the size of the canvas
Figuring out the right positions will take a little “fiddling around”, so check your work regularly.
UW’s Columns
For some reason UW sometimes uses columns as a symbol of the University, so we’ll try that, too.

Part 2. Add a column figure, as shown at right, to your Processing program from Part 1. Notice that the column is built out of five shapes – three rectangles and two circles. Obviously, you will use the same resources as you used in Part 1. Here are the specifications:
- Top rectangle is: 60 x
20
- The rectangle below it
is: 40 x 10
- The circles have a
diameter of 10 and are centered on the ends of the second rectangle
- The lowest rectangle is:
30 x 60
Comment your work.
Part 3. UW uses 4 columns, so we’ll need to replicate our design, using our old friends copy and paste. In this part make three copies of the column code from Part 2. These will just draw on top of each other because they have exactly the same positioning. But, we spread them out by adding an amount to the x-position of each shape. So, for each copy of a column, add to all of the shapes’ x-coordinates the value of either100, 200, or 300. Use EXPLICIT addition to increase the x-coordinate; that is, if the command is
rect(20, 250, 60, 20);
then increase it as
rect(20+100, 250, 60, 20);
That way you can use copy and paste again with the “+100”, and let the computer do the addition. The result will be

Wrap Up. When you are finished and the code is all commented (don’t forget your name!), submit your .pde file to the class drop box and bring a hardcopy to class to submit!