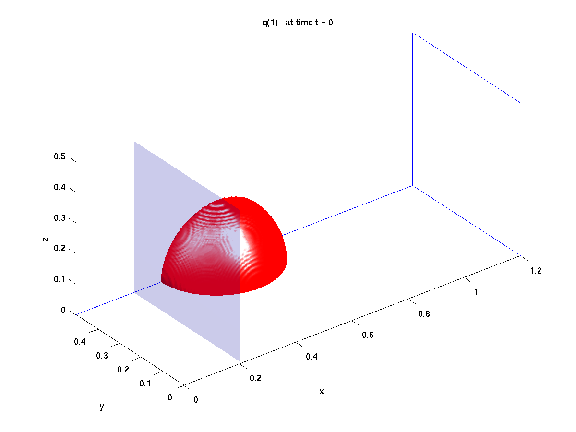
This shows the isosurface at value 0.5 as a solid red surface
(the location of the bubble, more or less),
The isosurface at value 2.5 is shown as a wispy blue surface, and indicates
the shock and reflected disturbances.
Two different viewing angles are shown at later times.
Data at t = 0:
Solution at t = 0.075:
Solution at t = 0.15:
Solution at t = 0.225:
Solution at t = 0.30: