 README.html
|
README.html
| |
| Source file: README.txt | |
| Directory: /var/www/html/clawpack/links/awr11/chile2010awr | |
| Converted: Sat Feb 5 2011 at 15:51:43 using clawcode2html | |
| This documentation file will not reflect any later changes in the source file. |
|
|
GeoClaw Sample CodeSample earthquake-generated tsunami based on the 2010 Chile event. Primarily to illustrate how set up topo and dtopo files. See $CLAW/doc/sphinx/users/topo.html for more information. See maketopo.py [.html]. This downloads topography data from the GeoClaw topography database that originally came from the NOAA National Geophysical Data Center (NGDC) using Design-a-grid .
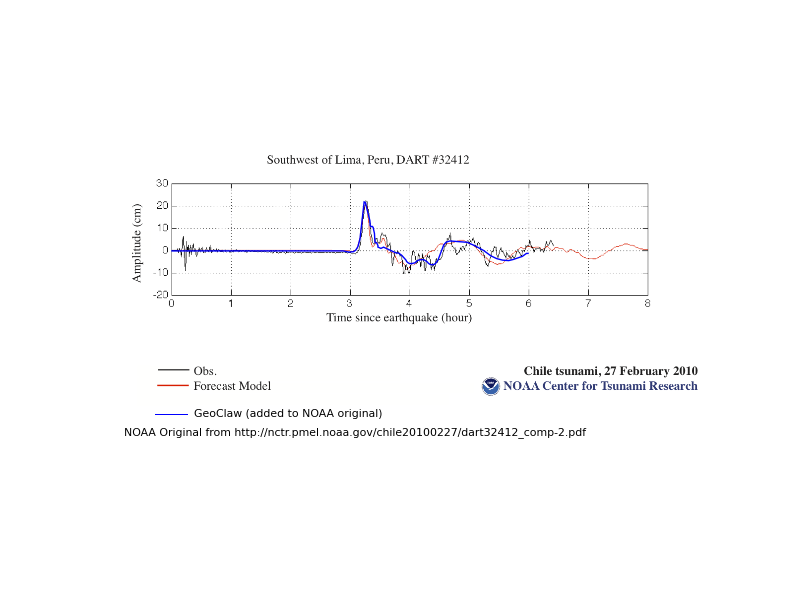
USGS site for earthquake data: earthquake.usgs.gov/earthquakes/eqinthenews/2010/us2010tfan Note: This fault model has be updated since this example was originally constructed, and the GeoClaw source code has been improved to use a combination of 180 subfaults specified at earthquake.usgs.gov/earthquakes/eqinthenews/2010/us2010tfan/finite_fault.php in place of the single fault plane used in the example included in Clawpack 4.5.1 and before. One gauge is included at the location of DART Buoy 32412: www.ndbc.noaa.gov/station_page.php?station=32412 To download other DART buoy data, see www.ndbc.noaa.gov/dart.shtml
See also the NOAA/PMEL Center for Tsunami Research site for this tsunami, containing DART data, tide gauges, MOST simulations: nctr.pmel.noaa.gov/chile20100227/
Plots of resultsTo create all these directories of plots, use
$ source make_all.sh Plots created:
The script compare_gauges.py [.html] can be used plot a comparison of the gauge data for all three runs with the DART Buoy 32412 data, resulting in a plot dart_gauges.png. The script plot_dart.py [.html] is a version that plots on top of computational results obtained by NOAA, dart.png.
Fortran files
Python files
Data filesThe .data files are automatically generated using the information in setrun.py [.html].
Instructions
To make topo and dtopo data files: $ make topo To make all data files, edit setrun.py and then $ make .data To run code: $ make .output To plot results, either generate html pages via: $ make .plotsor view interactively using ipython and Iplotclaw. To run the 3 different cases for the figures in the paper, $ source make_all.sh For more documentation, see www.clawpack.org/users .
|