Littleton-Bethlehem Moraine geological-calibration site
Nov. 17-18, 2007
For information about this page, contact Greg Balco
This page contains data collected on the CRONUS-Earth geological-calibration excursion to the Littleton-Bethlehem moraine complex, near Littleton, NH, on Nov. 17-18, 2007.
Sections:
Background
Existing calibration data
Site and sample information
Photos
Lab description
1. Background and literature
The Littleton-Bethlehem moraine complex is a set of prominent bouldery moraines in northern New Hampshire. The moraine complex is correlated with a till sheet. The till sheet is stratigraphically bracketed by varved lake sediments. The varved sediments are matched to the New England varve chronology, which is linked to the calendar year time scale by radiocarbon dates on individual varves. Thus, we know that the moraine was deposited 13840 +/- 250 yr ago.
Woody Thompson has written a number of excellent descriptions of the history of work on the Littleton Moraine complex, as well as the results of his more recent mapping in the area. This work is summarized in the following papers:
Historical summary: Thompson, W. B., 1999. History of Research on Glaciation in the White Mountains, New Hampshire (U.S.A.) Geographie physique et Quaternaire, 1999, vol. 53, no. 1, p. 7-24.
Full description of the Littleton moraine complex: Woodrow B. Thompson, Brian K. Fowler, Christopher C. Dorion, 1999. Deglaciation of the Northwestern White Mountains, New Hampshire. Geographie physique et Quaternaire, 1999, vol. 53, no. 1, p. 59-77
The Ridge et al. paper above gives some description of the radiocarbon dating of the varve chronology, but it has been superseded by some newer results. These are summarized on Jack's North American Glacial Varve Project web site .
2. Existing calibration measurements:
There have been a few calibration measurements already made from this and related sites. The results, as well as a lot of information about the age control on the moraine complex, are summarized in the following paper:
3. Site and sample information:
Location:
We visited the Beech Hill moraine field and collected 7 samples (see the above papers for the overall context of this site). The site is located here. It consists of a series of ENE-WSW-trending bouldery moraine ridges and intervening marshy swales. This is sort of visible on the overhead air photo. Yes, all those white spots visible on zooming in are large granite boulders. For Google Earth aficionados, the sample locations are here (.kmz file) and here (.kml file).
Field party:
Folks present at the site on Nov. 17-18 included:
CRONUS senior personnel: Greg Balco (Berkeley Geochronology Center). Not much of a showing in this category.
CRONUS cooperating investigators: John Gosse (Dalhousie).
Recognized local expert: Woody Thompson (Maine Geological Survey)
Graduate students: Brent Goehring (LDEO), Amanda Henck (UW)
Other interested parties: Joe Licciardi (UNH), Sara Mitchell (Holy Cross), Thom Davis (Bentley College), Roger Hooke (UMaine), Amy Gaffney (LLNL).
Overall geomorphic context of the boulders:
Everyone present at the site generally agreed that the boulders were in stable landscape positions. We were easily able to find boulders that lay on flat ground and were interlocked with other boulders in large groups, suggesting that they could not have moved since deposition. Steep slopes were present on the flanks of some of the moraine ridges, suggesting the possibility of postdepositional uncovering of boulders lying on these slopes, but we were easily able to avoid boulders in this position. All, however, were more concerned about the possibility of boulder surface shielding by vegetation or snow. The natural vegetation at the site is a dense spruce-fir forest, and we observed boulders of all sizes with 2-6 cm moss and litter accumulations on their surfaces. In several cases this litter accumulation rose to the level of 'soil' and small trees were rooted in it. It appeared that boulders with flat upper surfaces were more likely to have thick moss cover, but we did observe moss and saplings attached to a few boulder surfaces dipping at 30 degrees or more.
The site also experiences seasonal snow cover. Climatology from a long-term weather observing station in nearby Bethlehem, NH shows a mean water equivalent snow thickness, averaged over the entire year, of 2.1 cm (details of this calculation are in the 2009 paper in QG referenced above).
Taking all this into account, we agreed that we ought to be sampling relatively tall boulders (> 1.5 m), and we ought to try to avoid boulders with large, perfectly flat surfaces that might be the most efficient moss accumulators.
Boulder surface erosion:
Nearly all of the boulders had rough surfaces with 0.5-1 cm of small-scale (1-cm-scale) relief. We observed a few upstanding quartz veins on boulder surfaces. Heights of these veins above the surfaces were generally near 0.7 cm. The highest relief quartz vein we observed was 1.5 cm in relief. This suggests that boulder surface erosion has been restricted to 0.5-1.5 cm since emplacement. On a few boulders, we observed etching along joints up to 2-3 cm deep. We avoided these areas and sampled boulder surfaces that were generally flat and subject only to grain-scale roughness.
Topographic shielding:
All the samples are located in the same broad lowland, and are all subject to the same topographic shielding from distant hills. The horizon description is:
| Azimuth (degrees) | 50 | 80 | 90 | 115 | 145 | 170 | 210 | 260 | 320 |
| Horizon angle (degrees) | 0 | 0 | 5 | 5 | 3 | 4 | 6 | 0 | 2 |
Following the usual procedure, this yields a shielding factor of 0.9999.
Site and sample data:
I measured sample locations by handheld GPS, and elevations by barometric leveling from a nearby USGS benchmark using a SUUNTO Escape handheld altimeter. Unfortunately, barometric pressure changes were large both days, resulting in a large drift correction. The altimeter is temperature-compensated. A spreadsheet detailing the altimeter correction is here. I estimate 2-3 meter uncertainties on the elevation measurements. Locations, elevations, and links to sketches of the boulder and sample geometry appear in the following table.
| Sample name | Latitude | Longitude | Elevation (m) | Link to boulder sketch | Measured thickness | Link to sample sketch |
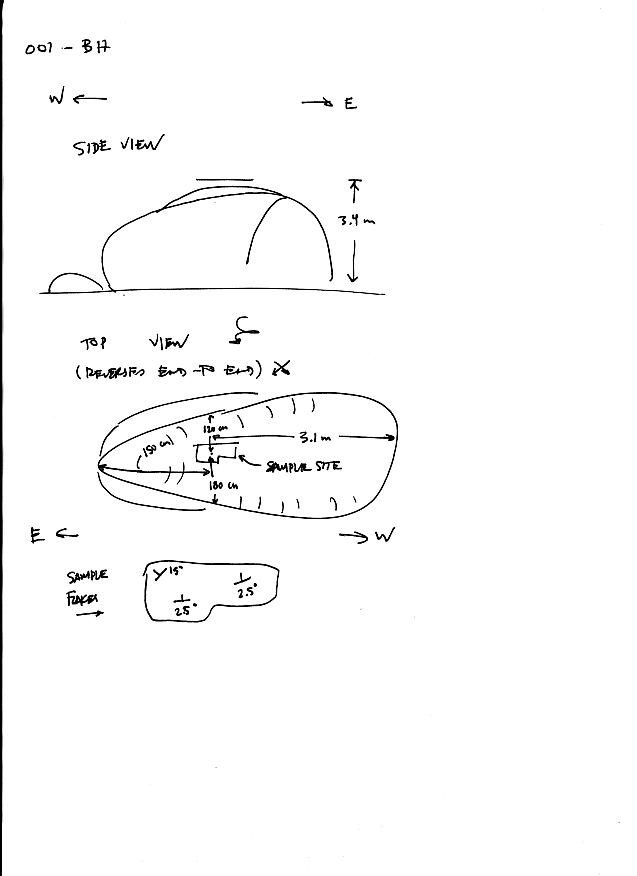
| 07-NE-001-BH | 44.3143 | -71.5740 | 417 | sketch001BH.jpg | 3.6 cm | Sample sketch 001-BH |
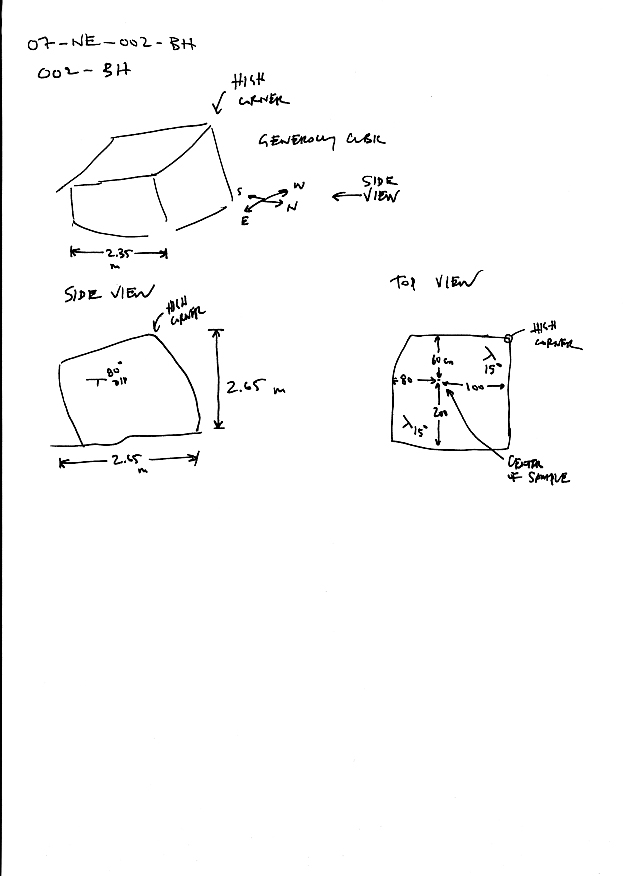
| 07-NE-002-BH | 44.3139 | -71.5750 | 412 | sketch002BH.jpg | 4.6 cm | Sample sketch 002-BH |
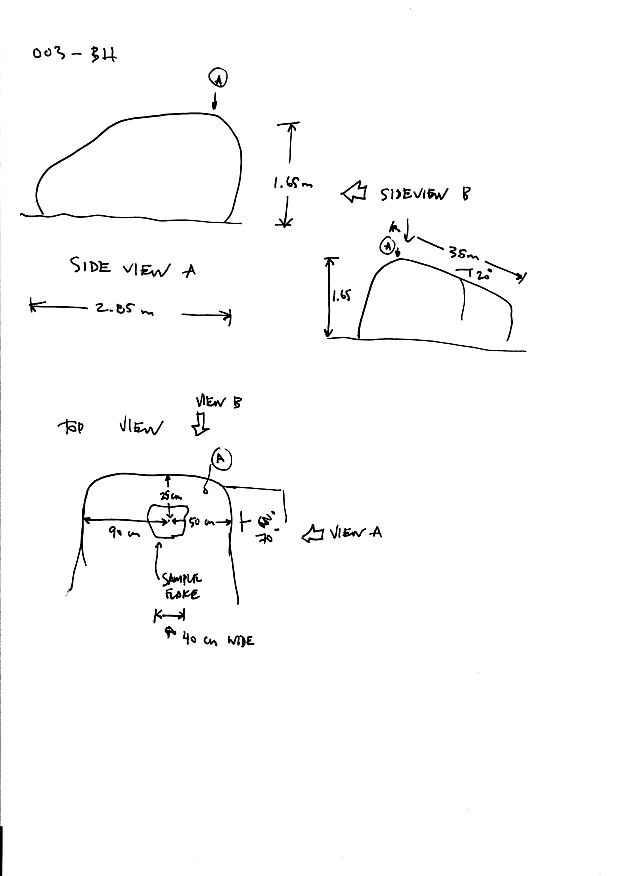
| 07-NE-003-BH | 44.3110 | -71.5766 | 411 | sketch003BH.jpg | 2.2 cm | Sample sketch 003-BH |
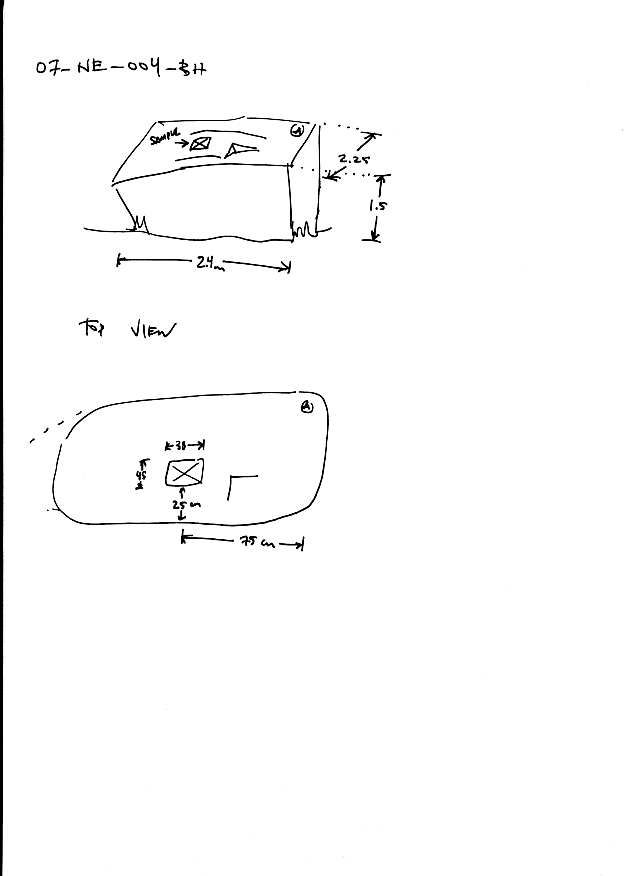
| 07-NE-004-BH | 44.3114 | -71.5750 | 412 | sketch004BH.jpg | 3.9 cm | Sample sketch 004-BH |
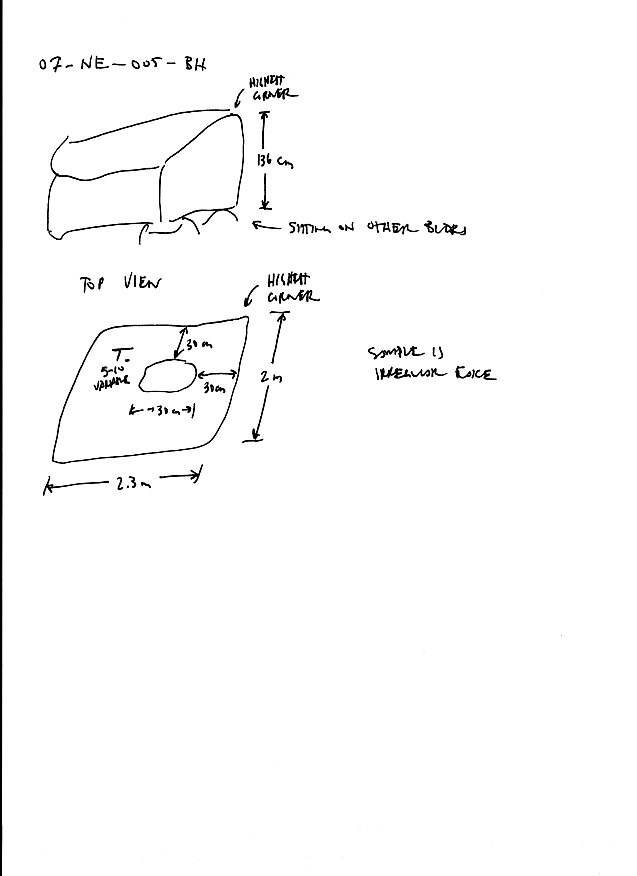
| 07-NE-005-BH | 44.3108 | -71.5761 | 409 | sketch005BH.jpg | 3.7 cm | Sample sketch 005-BH |
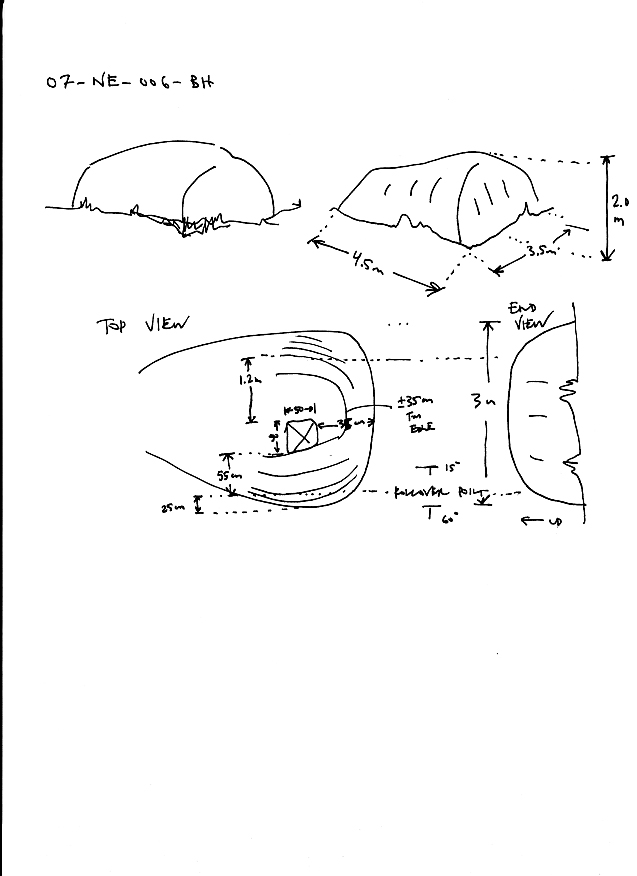
| 07-NE-006-BH | 44.3083 | -71.5765 | 413 | sketch006BH.jpg | 3.4 cm | Sample sketch 006-BH |
| 07-NE-007-BH | 44.3082 | -71.5770 | 412 | sketch007BH.jpg | 3.4 cm | Sample sketch 007-BH |
Notes on individual samples:
Notes on individual samples reproduced from GB's field book. Please send your own notes for inclusion here. Thanks.
| Sample name | Who? | Notes |
| 07-NE-001-BH | Balco | Boulder on top of moraine crest -- several meters from edge of ridgetop. Sitting directly on other boulders. Lichen common on top surface, little moss present. Surface is rough at 0.5-cm scale. Some linear etching features, several cm wide, ca. 1 cm deep. Estimated sample thickness 3 cm. |
| 07-NE-002-BH | Balco | Top of moraine crest, well away from any break in slope. 2-4 cm moss covers most of boulder surface. Small-scale surface roughness has 0.5-cm relief. Gentle 20-30-cm-wide swales in surface have 1-2 cm relief. |
| 07-NE-003-BH | Balco | Quartz vein exposed on top and side of boulder. Max relief of quartz vein is 1.5 cm by calipers. Most of vein has 0.7 cm relief. Moraine crest well away from breaks in slope. |
| 07-NE-004-BH | Balco | Small-scale surface roughness has ca. 0.5-cm relief. Sample collected from area of 3-5 cm positive relief, ca. 50 cm wide. Estimated sample thickness is 5 cm. In flat terrain on gently (few degrees) sloping moraine crest. At least 10-15 m from nearest break in slope. |
| 07-NE-005-BH | Balco | On moraine crest sitting in nest of other large boulders. Resting on other boulders. Flat area. At least 3 m from break in slope. Surface is rough at 1-cm horizontal scale with ca. 0.5-cm relief. No apparent difference in roughness between top and sides of boulder. Some moss on surface but few lichens. |
| 07-NE-006-BH | Balco | Large boulder embedded in soil. Surrounded by pile of interlocking lesser boulders. In inter-moraine-ridge swale, surface is gently sloping (a few degrees). 15 m to S, ground rises toward a moraine crest. Adjacent to skid road, but road curves to go around boulder. 2-4 cm moss on some areas of surface, area sampled has little moss but is pretty well lichen-covered. |
| 07-NE-007-BH | Balco | Large boulder, on end, leaning on pile of interlocking lesser boulders. The whole package forms an interlocking clast-supported boulder pile. In swale between ridges, adjacent to swampy area. Light lichen and moss cover. Boulder top is well above forest floor. Top is gently rounded...approximated by 5-m spherical surface? Sample thickness estimated 3 cm. |
4. Photos:
Photos appear on a separate page.
5. Lab details:
Sample photos (click for larger view / back button to return)
| Sample | Top view | Side view |
| 07-NE-001-BH | 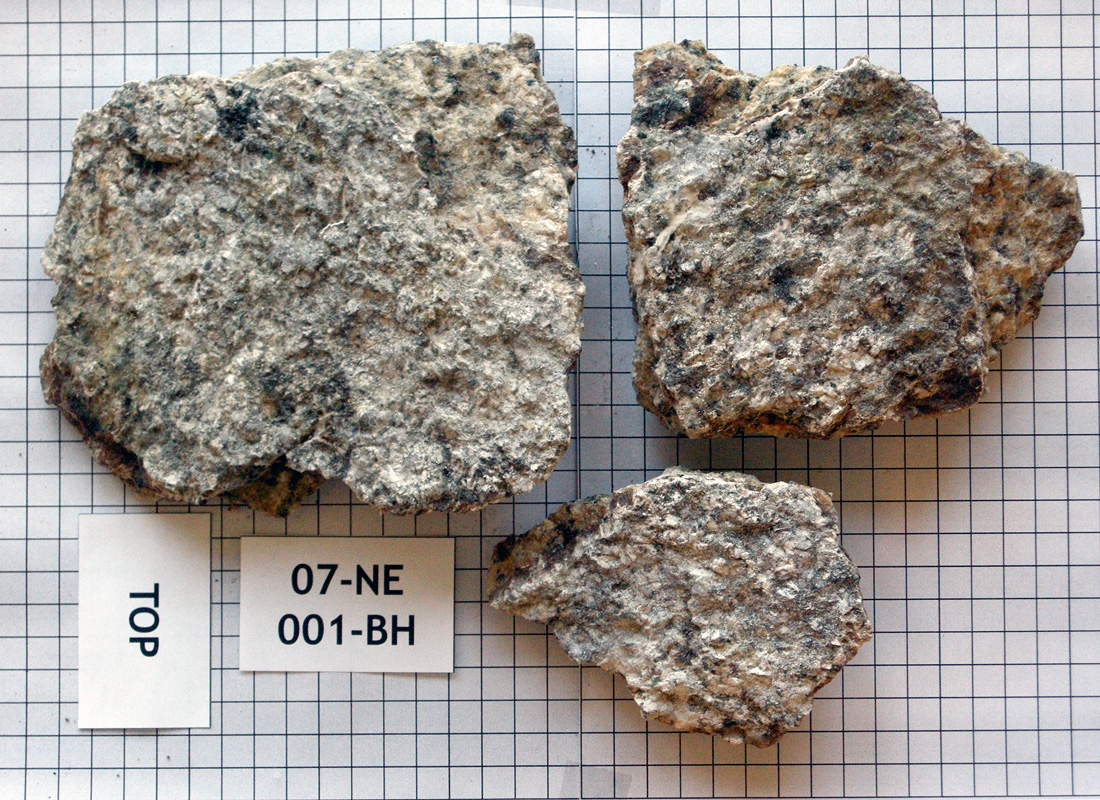 | 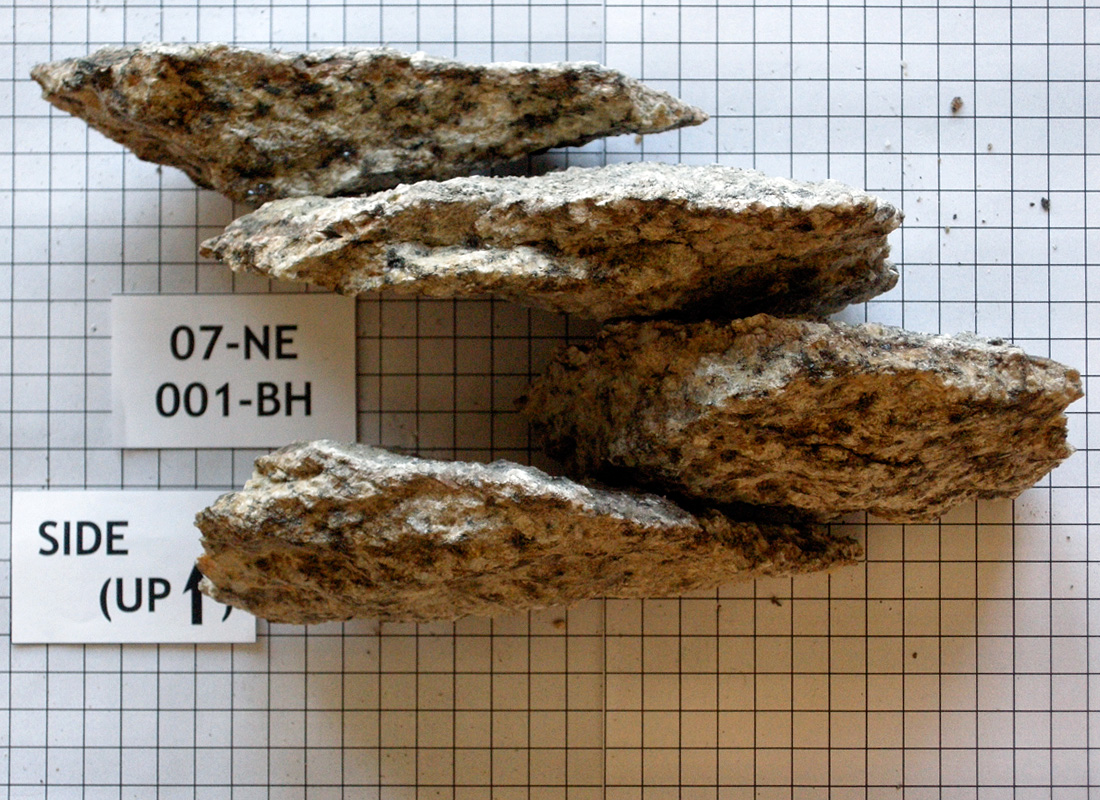 |
| 07-NE-002-BH | 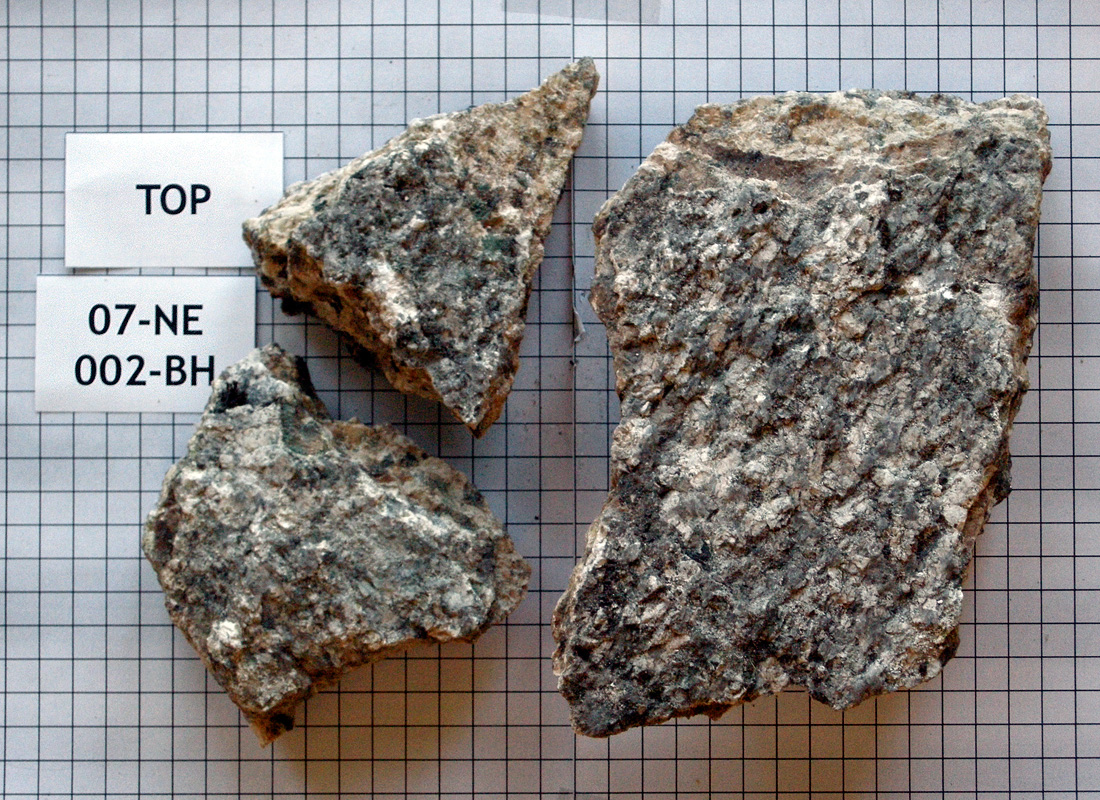 | 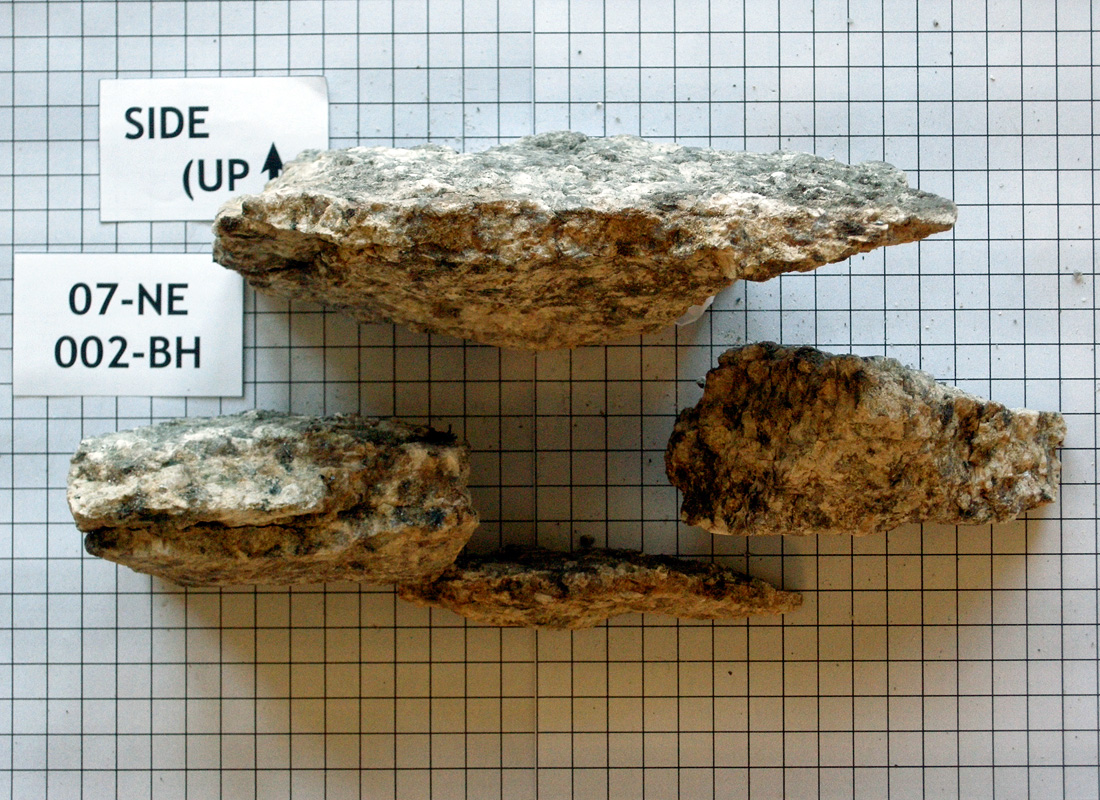 |
| 07-NE-003-BH | 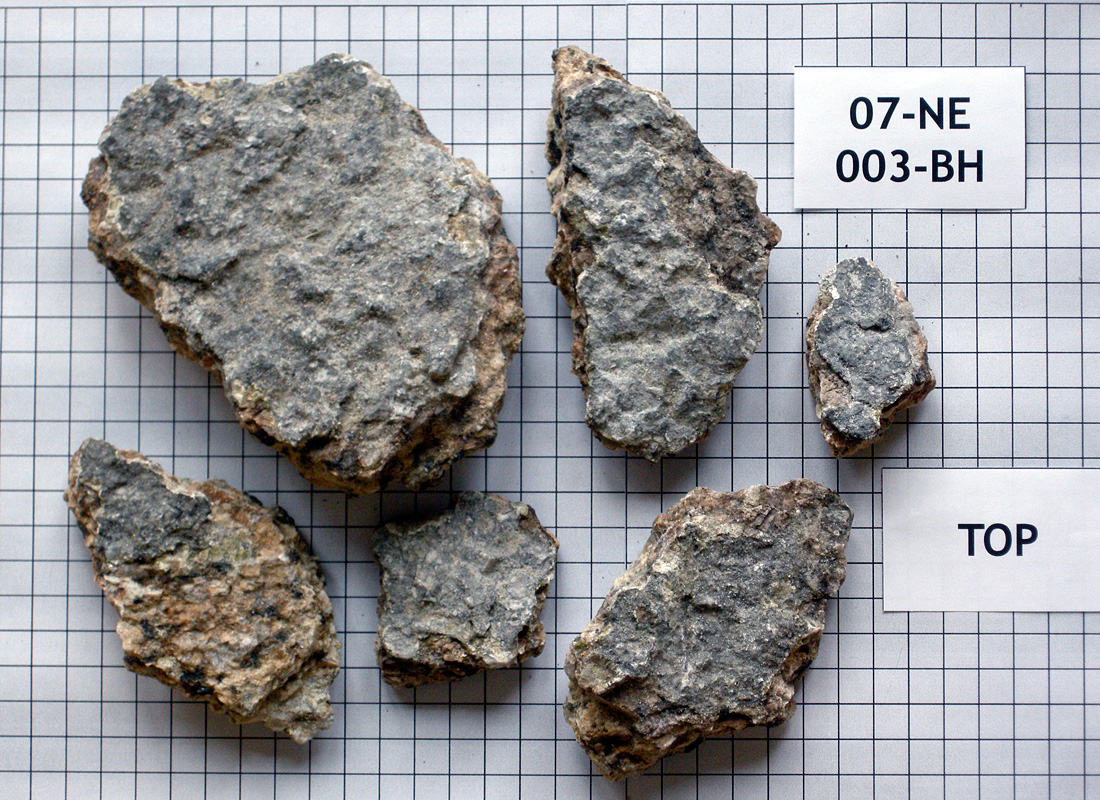 |  |
| 07-NE-004-BH | 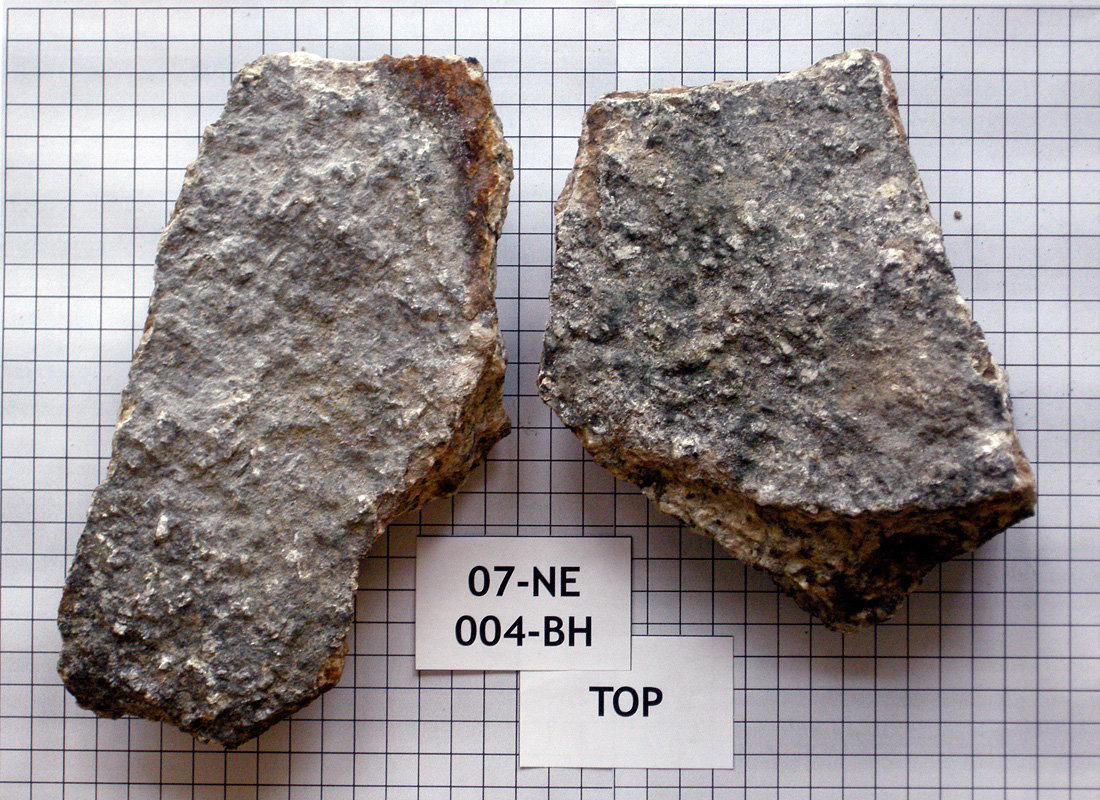 | 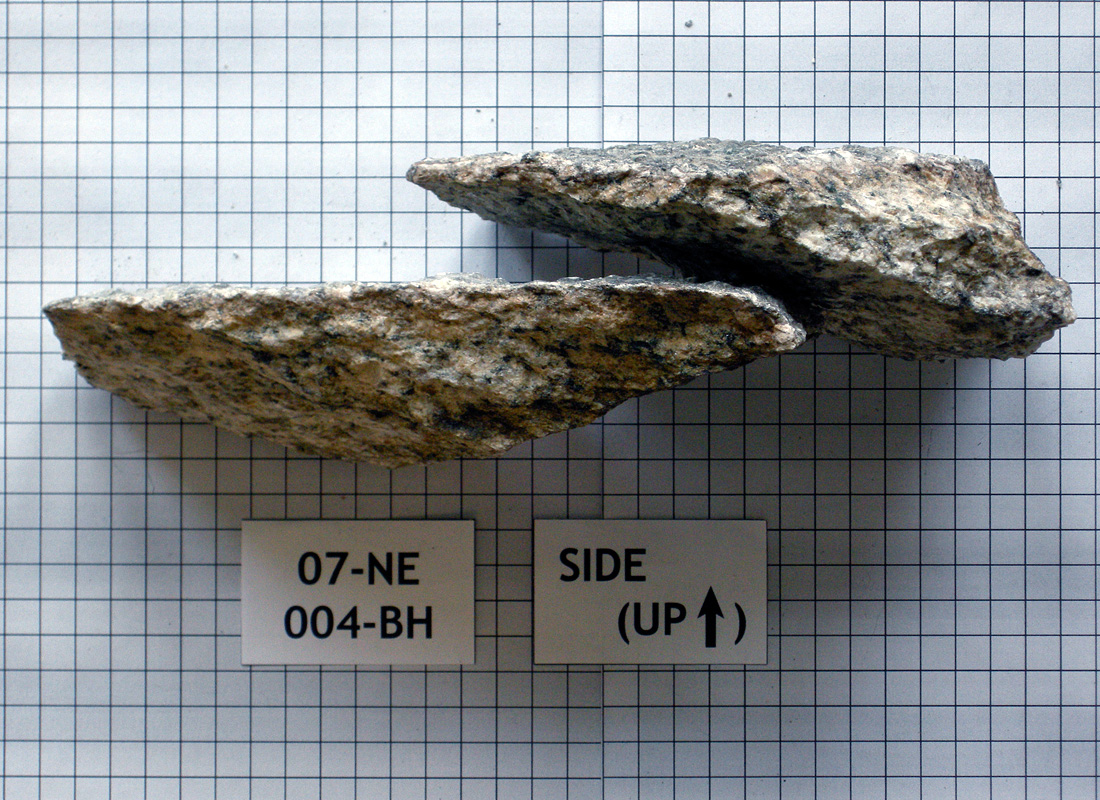 |
| 07-NE-005-BH | 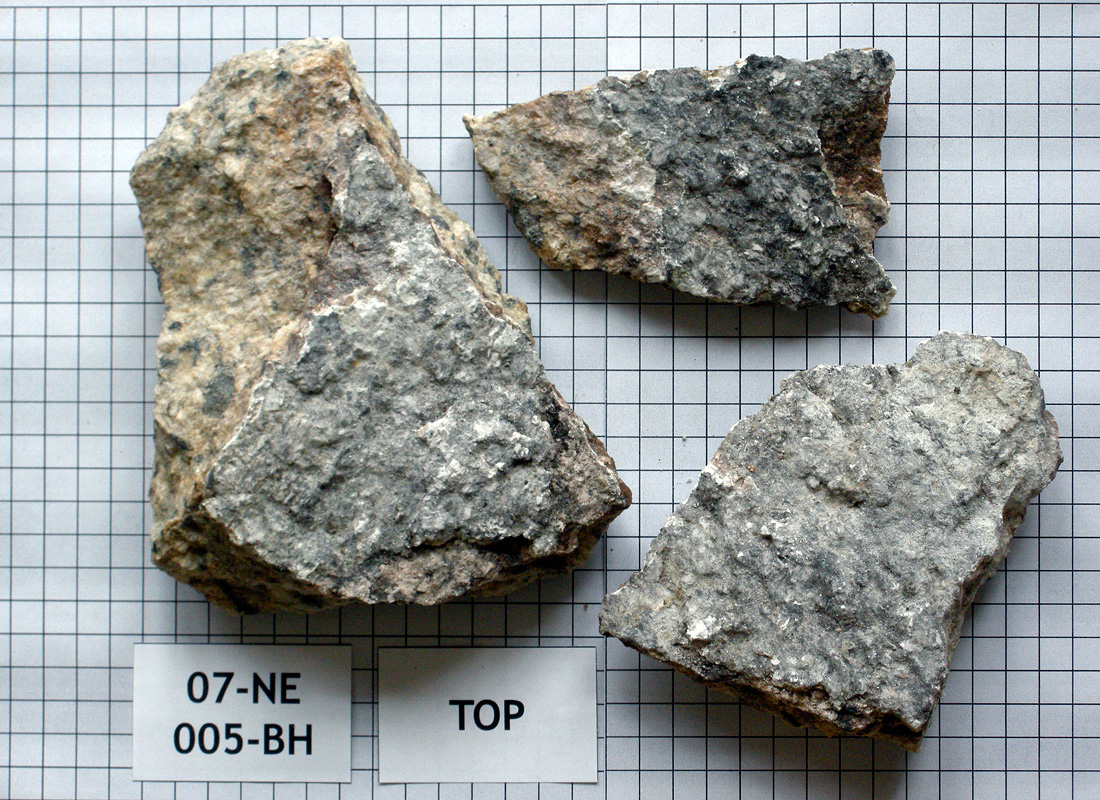 | 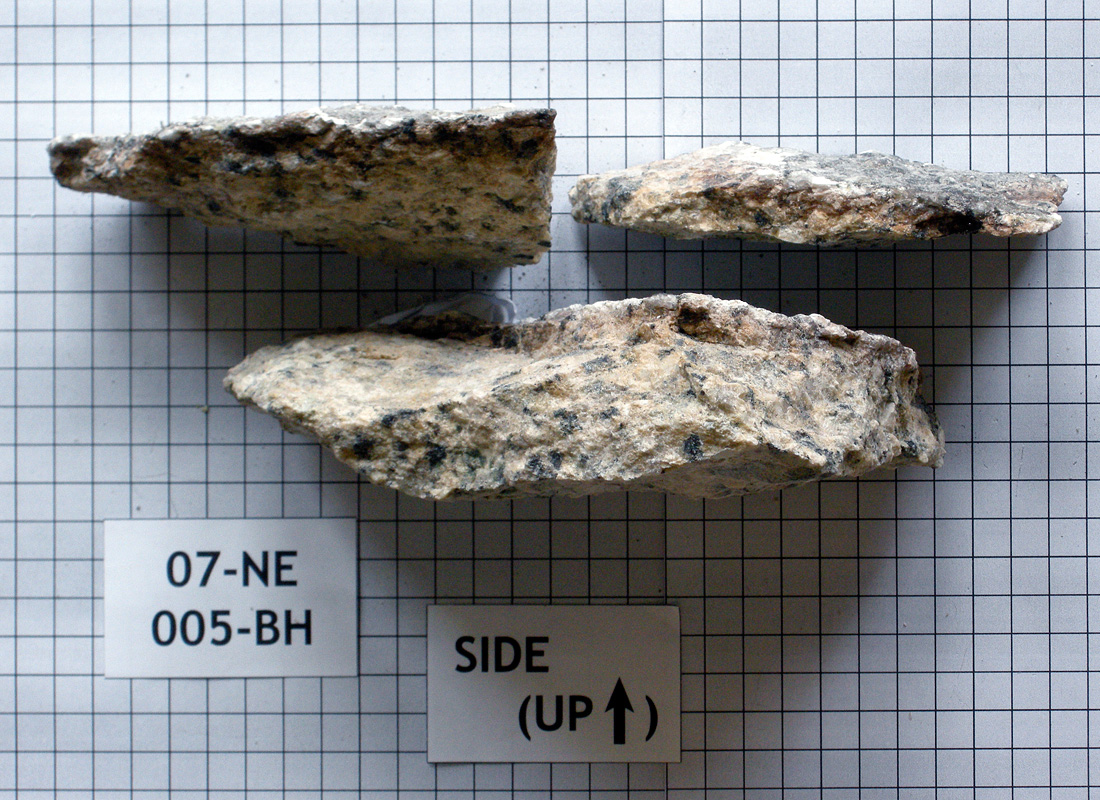 |
| 07-NE-006-BH |  | 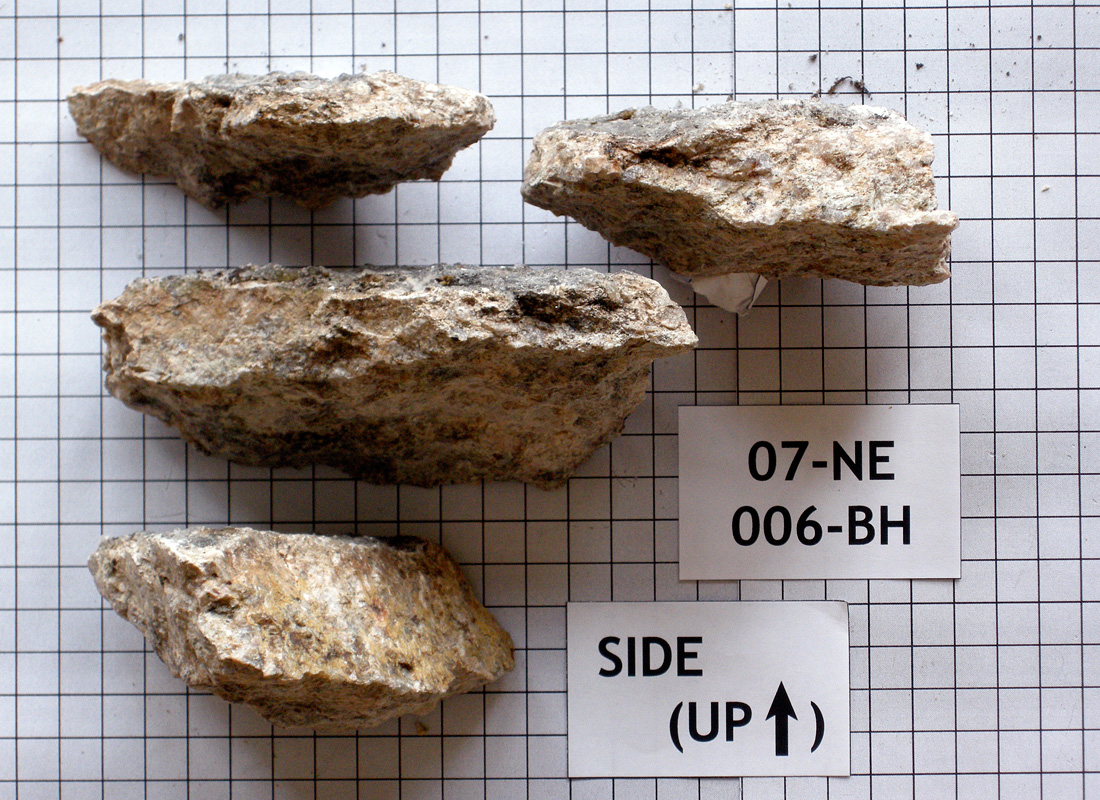 |
| 07-NE-007-BH | 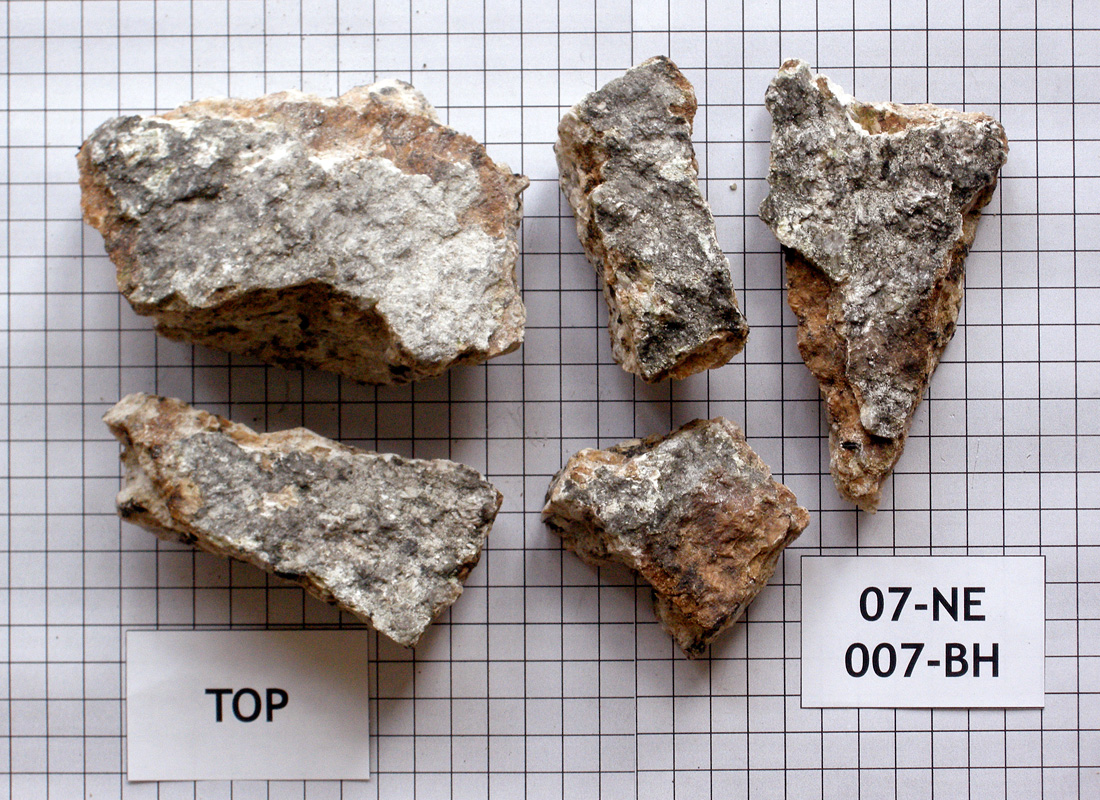 | 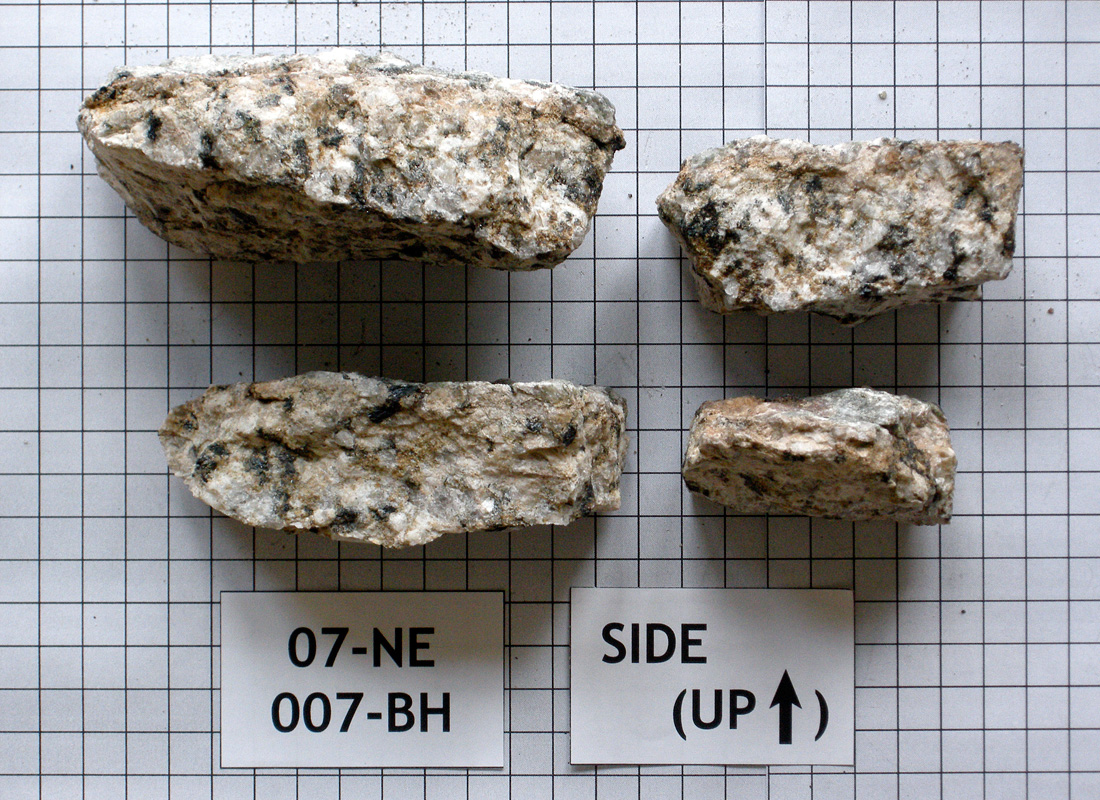 |
Estimated density is 2.63 g/cm^3.