University of Washington
A coastal view of Friday Harbor Laboratories
 
Tide Bite
January 2021, Vol. 89
 
Sea Otter Disturbance, by Dr. Tiff Stephens
In the summer of 2017, I travelled to FHL for one of my usual short visits of reconnecting with resident scientists and diving into the waters to see how the seaweed communities have changed at favored sites (Reuben Tarte, Cattle Point, Deadman Bay).  I also travelled there to catch a ride north: I jumped onto a 42’ Nordic Tug and steamed directly from FHL’s breakwater to Prince of Wales Island (POW, Southeast Alaska) via the Inside Passage, with the ultimate goal of relocating for a postdoctoral fellowship that was to investigate the role of sea otters in eelgrass habitat (UAF, Eckert Lab).

It must be said: sea otters are unforgiving.  Their tenacity, in fact, is not quite appreciated until one has the opportunity to observe their daily foraging habits.  As we rounded the northern point of POW Island into a calm, fog-enshrouded Shakan Bay, we noticed dozens of sea otters simmering to the surface around us, each returning with a prize to dismember and consume: clam, clam, clam, sea cucumber, clam, clam, basket star…BASKET STAR?  Like I said, sea otters are unforgiving.  Although their role as a predator is canonized in texts that describe the cascading effects of their consumption of urchin and abalone (Estes et al. 1978, Duggins 1980), this should not suggest that their activity is limited to rocky areas.  Sea otters are generalist predators that consume over 200 species across a spectrum of rocky and soft substrates.  Diet analysis suggests that butter clams are their preferred prey in Southeast Alaska (La Roche 2020).  What wasn’t apparent from the surface as we cruised through the corridor of sea otter carnage in Shakan Bay was what effect the foraging activity had on the soft seafloor below, which was what I was to later investigate in eelgrass habitat.
 
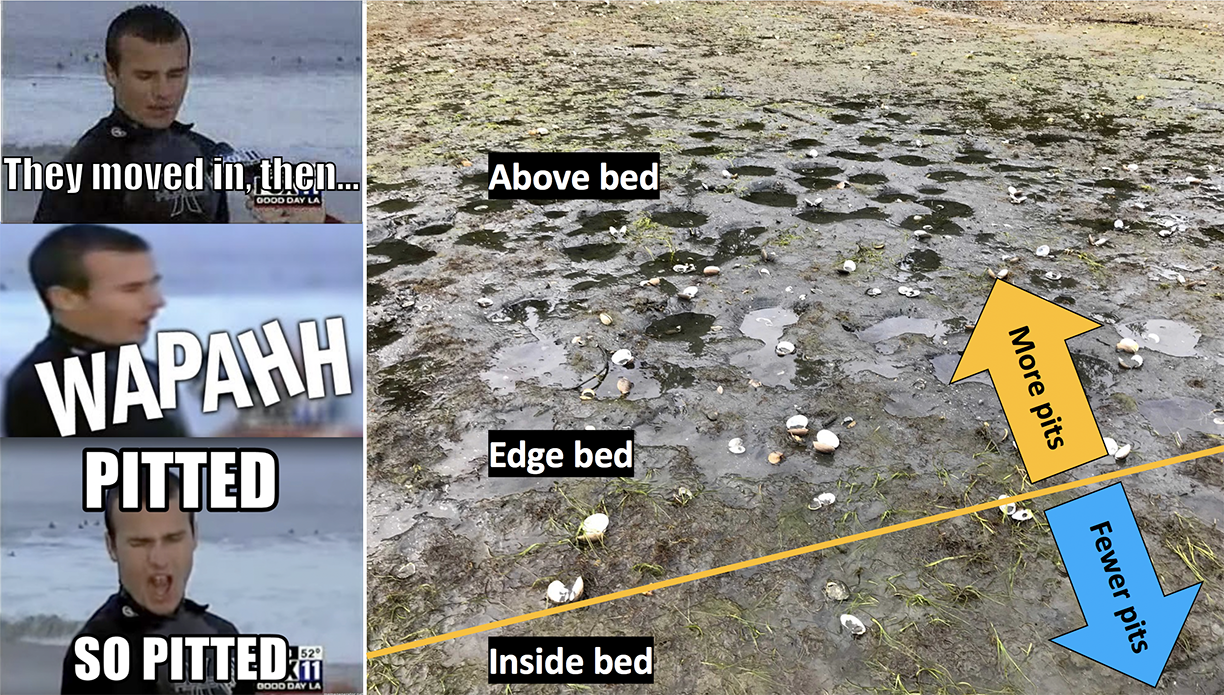
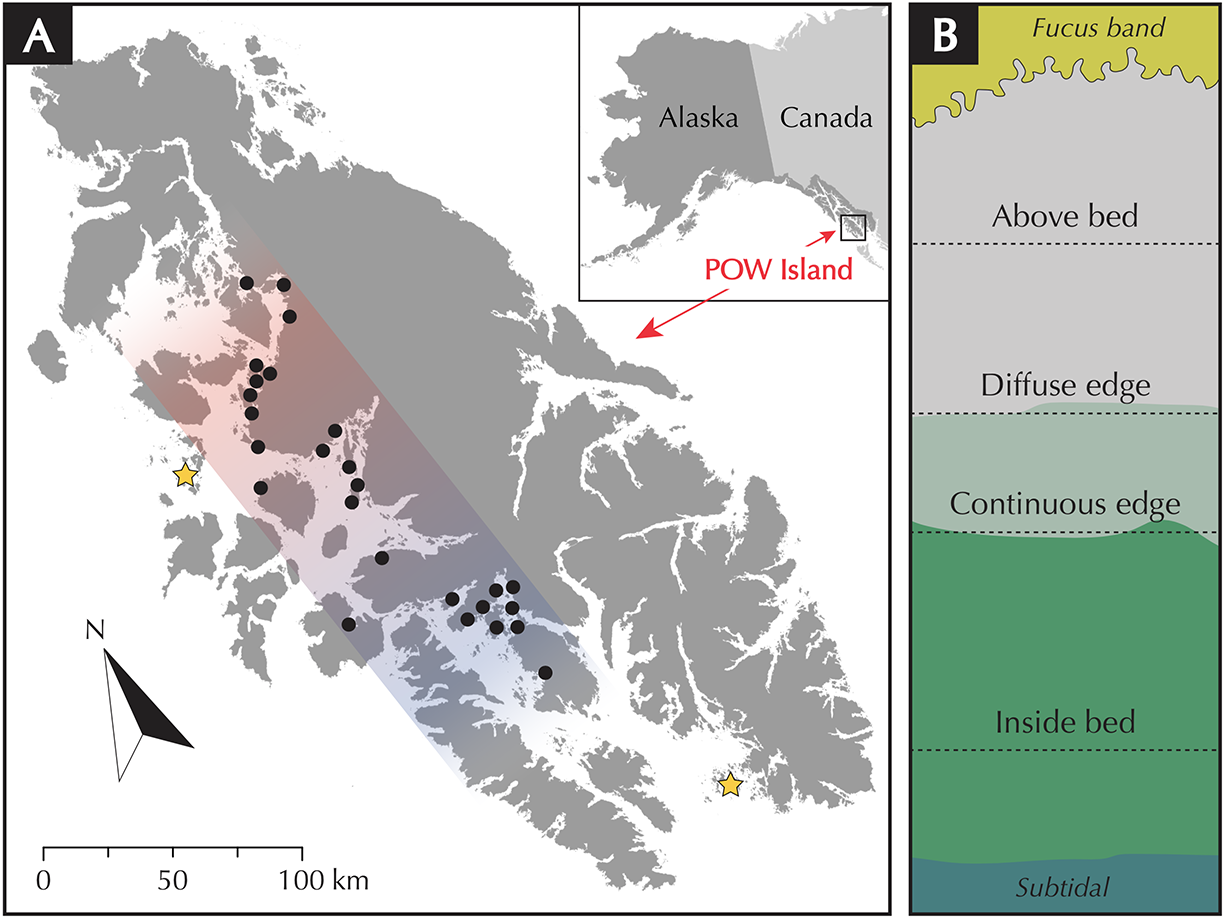
I was introduced to Alaskan eelgrass systems by Wendel Raymond (now PhD!), a recent FHL alumnus who had already been investigating food webs within eelgrass communities on POW Island for two summers.  On my first day in the field, Wendel donned a dry suit and assumed “floating log” formation as he drifted along a transect counting eelgrass densities.  I walked around the intertidal to make my first observations of an eelgrass site known to have a moderate sea otter presence (based on local population counts).  This was one of those natural history moments of just taking it all in; I expected to see a number of excavated pits within the eelgrass as evidence of foraging activity (otters digging up clams, which they do by diving and digging with their front paws), but only a couple of pits were present within a 100 meter transect.  However, along the 
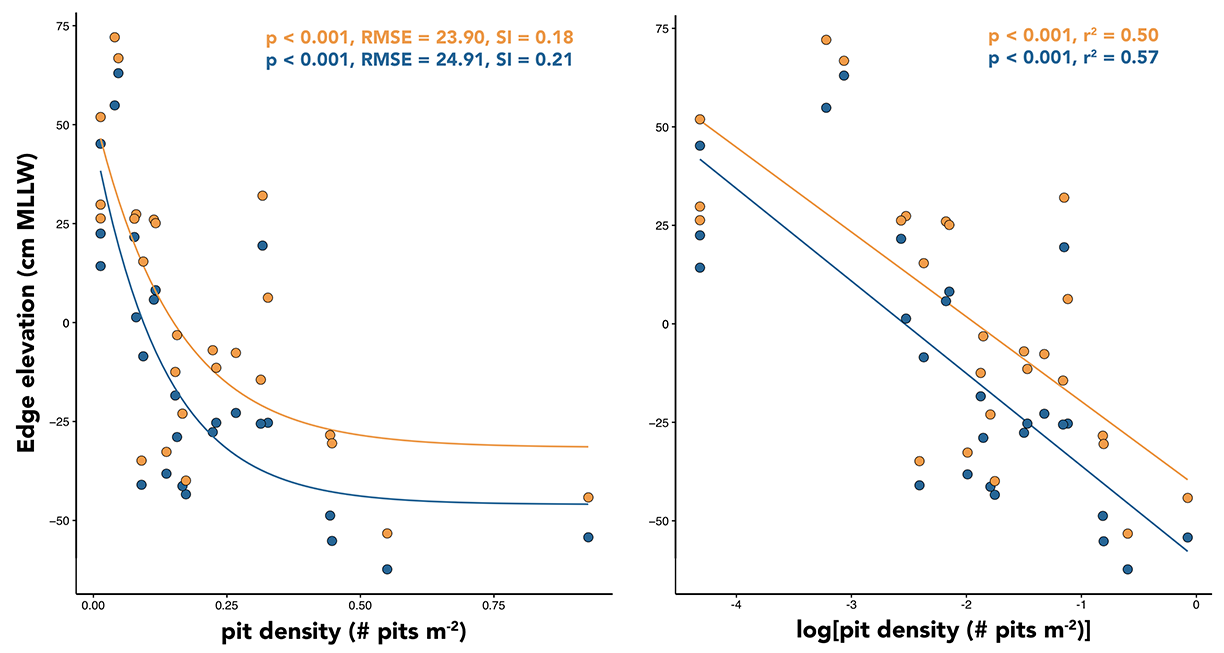
upper edge of the eelgrass bed where butter and littleneck clams are more abundant, the bed looked as if it had been bombed.  A cluster of pits existed where there used to be a mosaic of clams and eelgrass, and many pits had exposed eelgrass rhizomes (roots) along the perimeter (Figure 1).  It appeared as if sea otters could cause reductions in the upper extent of an eelgrass bed via “bioturbation,” which is disturbance caused by an organism (as opposed to waves or other physical factors).

Eelgrass bed pits
Fig. 1: A cluster of pits created by a group of sea otters (about 50 individuals) that were active at the site just before the tide dropped, as evidenced by the shell litter with fresh meat still attached to the valves.
Thus, I shifted the focus of my research to zonation within an eelgrass site and investigated whether there is a relationship between bioturbation by sea otters and the upper (landward) extent of eelgrass beds.  This work reminded me of intertidal research that I participated in as a technician at FHL with Dr. Megan Dethier (2009), where we used survey equipment to collect tidal elevation data that were used to address several ecological questions.  I selected 26 sites across a gradient of sea otter presence on POW Island (Figure 2A).  At each site, my team and I measured the tidal elevation of the continuous and diffuse edges of eelgrass beds along 100 meter transects – the continuous edge is where the bulk of the eelgrass stops growing and the diffuse edge is a band of low-density eelgrass growing just above the bulk.  We also quantified the density of sea otter pits along three 100 meter transects (inside the bed, at the continuous edge and above the bed; Figure 2B).  The work required swiftness; learning how to cram just the right number of tasks within a low tide window – no more, no less – was challenging!
Eelgrass bed zonation
Fig. 2: (A) a map of POW Island that shows the spread of sites along the natural sea otter gradient we used.  The gradient exists due to the extirpation of sea otters on POW; they were reintroduced in the late 1960s in the two locations marked with a yellow star, and populations have since quickly expanded from those nodes.  (B) a schematic of the intertidal and the associated bands/elevations that were measured in this study.
After a long season, a dataset was born.  The data suggested a strong negative correlation between bioturbation (pits per m 2) and the elevation of the upper edge of eelgrass beds (Figure 3).  The non-linear relationship suggests that the rate of change is strongest in sites transitioning from low to moderate disturbance activity.  These data, along with personal observations of sea otter behavior, supports the notion that digging activity by sea otters has the capacity to quickly reduce the upper extent of eelgrass habitat.  When the data are categorized into sites of Low and High sea otter disturbance, the mean elevation of the continuous edge of eelgrass in Low-otter sites is +0.16 m (MLLW) versus -0.41 m (MLLW) in High-otter sites, a difference of 0.57 m in elevation.  Considering the mean beach slope at these sites, the loss of 0.57 meters in zonation equates to the loss of approximately 9 meters squared of horizontal eelgrass per meter of shoreline.
Correlation between bioturbation and elevation of upper eelgrass bed edge
Fig. 3: (left) The untransformed data showing the non-linear relationship between the density of sea otter pits (site-wide sum) and the elevation of the continuous edge of the eelgrass.  The orange points/line represent the elevations of the diffuse edge and the blue points/line represent the elevation of the continuous edge of the eelgrass bed.  Each point represents one of twenty-six sites.  (right) The same data, but pit density log-transformed.
Experimentation is necessary to empirically test this relationship (e.g. sea otter exclusion cages), but the implications are large.  Unlike the large eelgrass meadows that are found in the San Juan Islands (e.g. Indian Cove, Picnic Cove), eelgrass habitat on POW Island forms a narrow fringe ranging from 3 to 20 meters wide.  Bioturbation by sea otters may be constricting already narrow bands of eelgrass habitat.  It is important to continue documenting these interactions to better understand potential indirect effects of otters on ecosystem services that eelgrass beds provide, such as nursery habitat and nutrient cycling.
 
References:

Duggins D.O.  1980.  Kelp beds and sea otters: an experimental approach.  Ecology: 61 / 3 (447-453).

Estes J.E., Smith N.S. and J.F. Palmisano.  1978.  Sea otter predation and community organization in the western Aleutian Islands, Alaska.  Ecology: 59 / 4 (822-833).

LaRoche N.L.  2020.  Sea otter diet composition with respect to recolonization, life history, and season in southern Southeast Alaska.  M.Sc. Thesis. University of Alaska Fairbanks, Fairbanks, Alaska.


Look for Tide Bites in your inbox at the start of each month!
Previous Issues
UW Home FHL Home College Home
fhl-uw-logo.png
Facebook    Twitter    Instagram
Contact Us   |   Privacy   |   Terms
© 2021
Friday Harbor Labs, 620 University Road, Friday Harbor WA 98250
This email was sent to {{lead.Email Address}}
Unsubscribe or change your email preferences
Be Boundless / For Washington, For the World