Genetics 371B, Autumn 2000 Answer key, exam 3 YELLOW VERSION: 11 December |
Answers are in blue
NOTE: As always, the answers here are a lot longer and more exhaustive than we expect from you on the exam.
1. | (20 pts total)
The short-tailed voles of the Canadian north have tails that measure 7 cm. In contrast, voles of the same species in Siberia have tails that are 11 cm long. A cross between a Canadian vole and a Siberian vole always gives F1 progeny with 9 cm tails. F2 progeny from crosses between these F1 animals show a range of tail lengths -- most have tails that are 9 cm long, while the shortest tails are 5 cm long and the longest tails are 13 cm long. Of 1061 F2 progeny, four had 5 cm tails and four had 13 cm tails. |
|
(a) | Assuming that tail length in these voles is a polygenic trait where all additive alleles make equal contributions, how many genes do you think are involved in determination of tail length? How much (in inches) does each additive allele contribute to tail length? Show your work. (6 pts) | |
Fraction of progeny showing one extreme of the range of phenotypes = (1/4)n where n = number of genes contributing to the trait
|
||
(b) | Using A/a, B/b, etc., for the tail-length genes, give one set of genotypes that could explain the phenotypes of the parents and the F1 progeny. Your answer must be consistent with the observation that all the F1 animals have 1.8-inch tails. (8 pts) | |
|
||
(c) | Give two reasons to be cautious about your conclusion about the number of tail-length genes (in part a). (6 pts) | |
Reason 1:
The sample size is small, so the value of 4/1061 may turn out to be an underestimate or overestimate of the real fraction. Also, with more progeny examined, animals with tails < 5 cm or > 13 cm may be found. Reason 2: Tail length may be subject to environmental influences (Other reasons exist also -- for instance, we don't know that there are only 2 alleles per gene.) |
2. | (16 pts total)
|
|
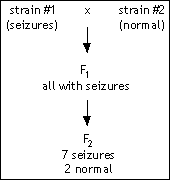
(a) | Suppose this is a single gene trait. Assuming that there was no observational error and that there was no environmental influence on seizure vs. non-seizure, what is the simplest explanation for the F1 and F2 phenotype ratios? Provide genotypes for all individuals in the cross. State what phenotype ratio you expect to get and what approximation you are making. Use A/a for the allele names. (4 pts) | |
Seizure is dominant, normal is recessive. The cross is aa (normal) x AA (seizures) giving Aa (seizing) F1 and 3 A_ (seizures) : 1 aa (normal) in F2. The 7:2 observed ratio is approximately the expected 3:1 ratio. |
||
(b) | Now suppose this trait is controlled by two genes, and that the F1 animals are heterozygous for both genes. Give the simplest explanation for the F2 phenotype ratios -- but no need for Punnett squares! Use A/a and B/b for the gene names. (8 pts) | |
The F1 cross is AaBb x AaBb giving:
-- a 13:3 ratio, which is approximately the 7:2 ratio observed (7:2 = 14:4, which is close to 13:3). (Other ratios -- such as 15:1 -- are okay, provided the explanation makes sense.) This would be a case of suppression (homozygous recessive bb suppresses the homozygous recessive aa phenotype). |
||
(c) | What is the simplest experimental strategy that would allow you to distinguish between these two possibilities? (ONE sentence!) (4 pts) | |
Do more F1 x F1 matings to collect many more F2 progeny, so that it's easier to discern the real F2 ratios. |
3. | (20 pts total)
|
|
(a) | Suppose that the common ancestor of Drosophila and the dragonfly had wings and halteres (as Drosophila does). What type of mutation may have occurred in the dragonfly lineage to produce extra wings? Specify the class of developmental gene, and whether the mutation was loss-of-function or gain-of-function. (6 pts) | |
A loss-of-function mutation in a homeotic (selector) gene that normally would act in the 4th segment would give wings instead of halteres in that segment (4th segment takes on a more anterior fate). |
||
(b) |
A French group working on dragonfly development has discovered three maternal genes expressed in the developing egg: fromage, pamplemousse (ppm), and chien. The expression pattern of these three genes in wild type and homozygous null mutant embryos is shown. Based on these data, suggest how these protein gradients are set up in wild type embryos, specifying the function of fromage and chien. Your model should explain the mutant phenotypes shown. (8 pts) |
|
|
||
(c) | The expression of the zygotic gene bateau requires 1 unit of chien protein and is blocked by 1 unit of ppm protein. What segments/adult structure(s) might be missing in a mutant homozygous for a null allele of bateau? What class of developmental genes does bateau belong to? (6 pts) | |
bateau is synthesized in segments 1 and 2. In the absence of bateau, we would expect those segments to be missing or abnormal.
bateau is a gap gene. |
4. |
(22 pts total) An improbable pair of operons in the mythical bacterium Confusus inhabitabilis is outlined below: E, F, G, H, J, and K are genes coding for proteins; P and O are the promoter and operator for each operon. G and K are known to be short-lived proteins. The sugar mannose induces transcription of the mannose operon, while melibiose induces transcription of the melibiose operon. |
|
(a) | A mutation in G (allele g) causes constitutively low levels of melibiose operon transcription, while a mutation in K (allele k) gives constitutive inactivation of the mannose operon. Explain the mutant phenotypes (specifying gain-of-function vs. loss-of-function) if:
|
|
(b) | State what you think mannose and melibiose do according to Model (i). (What are their targets, and what do they do to those proteins?) (6 pts) | |
Mannose activates the activator protein K, promoting transcription of EFG. Melibiose inactivates the repressor G, allowing transcription of HJK (by relieving repression of transcription of HJK) |
||
(c) | Addition of mannose to wild type cells causes only a brief induction of mannose operon transcription, while addition of melibiose causes sustained induction of melibiose operon transcription (until the melibiose is used up). Which one of the two models do you think is MORE CONSISTENT with this observation? Explain BRIEFLY. (8 pts) | |
According to Model (ii), K is an activator of EFG transcription; activation of K by mannose induces transcription of EFG. Upon induction of EFG transcription, the level of repressor G increases, so there is increased repression of HJK. The level of activator K therefore drops, and transcription of EFG drops correspondingly. However, in this model, G is a repressor of HJK transcription; melibiose inactivates the repressor, so as long as melibiose is present, the repressor should be inactive, and HJK transcription should occur. Thus, the observation (of transient induction of EFG transcription and sustained induction of HJK transcription) is consistent with model (ii) at least at a simplistic level. According to Model (i), K is a repressor of EFG transcription; inactivation of K by mannose allows transcription of EFG. In this model, as long as mannose is present, K will remain inactive, allowing continuing transcription of EFG; in contrast, induction of HJK by melibiose should be transient (by the same logic as described above). The observations are not consistent with these predictions. |
5. | (22 pts total)
In a certain remote island nation (Island #1), 91% of the inhabitants are normal (phenotype T), while the remainder show an autosomal recessive trait (t). |
|
(a) | Assuming Hardy-Weinberg conditions, what fraction of the population are carriers of the trait? Show your work! (6 pts) | |
Frequency of dominant phenotype = (homozygous dominant + heterozygotes) = PTT + PTt = 96% = 0.96
Frequency of recessive phenotype = frequency of genotype TT = Ptt = q2 = 0.04 Frequency of allele t = q = 0.2. Frequency of allele T = p = (1 - 0.2) = 0.8. Frequency of carriers = frequency of genotype Tt = 2pq = 2 x 0.8 x 0.8 = 0.32. |
||
(b) |
It turns out the the population is not in Hardy-Weinberg conditions after all, as the fitness of the two phenotypes is not the same: wT_ = 1, and wtt = 1/9. Starting with the frequencies given above, predict the frequencies of alleles T and t in the next generation. Show your work! (6 pts) |
|
In the next generation:
Therefore, frequency of allele T in this new generation = p' = (0.64 + (0.32/2)) / 0.97 = 0.825. and frequency of allele t = q' = 1 - p' = 1 - 0.825 = 0.175. |
||
(c) | On a different island (Island #2), where the frequency of allele t = 1/1000, a radical and ill-informed politician argues that modern health care is causing a "degradation in the quality of the gene pool" because recessive traits, instead of being selected against, are allowed to propagate. He is proposing to "clean up the gene pool" by making it illegal for people showing the recessive trait t to have children. Explain why this policy will have little influence on the frequency of allele t in that population. (6 pts) | |
Since q = 1/1000, the frequency of the individuals with the recessive phenotype = q2 = 1/1,000,000
while the frequency of carriers = 2pq = 2 x (1/1000) x (999/1000) = 1998/1,000,000. Thus, while individuals showing the recessive trait are present at a frequency of 1 in a million, people carrying the recessive allele are present at almost 2000 times that frequency. Therefore, people showing the trait are only a tiny fraction of the people carrying the allele, so preventing people showing the trait from having children will have only a miniscule effect on the frequency of the recessive allele. |
||
(d) | Which island do you think will show higher heritability (in the broad sense) for the trait? Explain in 1-2 sentences. (4 pts) | |
Island #1 has greater allelic variation (more heterozygosity), so it will show higher heritability for the trait (i.e., because there is greater genetic diversity, more of the variation in phenotype can be ascribed to genotype variation on island #1). |
|