Genetics 371B, Autumn 1999 Exam 3: December 13 |
Open book, open notes, 100 points total. Answer questions 1-5 and either 6 or 7 but not both.
1. |
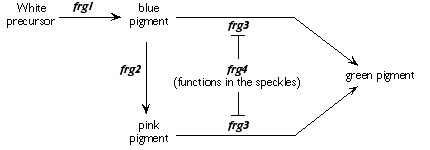
(16 pts) Coloration in a highly fictitious species of tree frog is determined by the frg genes as shown in the pathway below. Wild-type frogs are green with pink speckles. What phenotype do you expect with regard to coloration in frogs that are homozygous for null mutations of the following genes? (A null mutation in a gene completely eliminates that gene's activity.) |
|
Interpreting the pathway: frg1 converts the white precursor to a blue pigment. The blue pigment could either be converted directly to green, by frg3, or it could be converted to pink by frg2, and frg3 then converts the pink to green (i.e., frg3 can act on blue to turn it green, and it can also act on pink to turn it green). In the speckles, frg4 blocks frg3 -- so the final product in the speckles is pink (hence the pink speckles). | ||
frg1 | ___fully white frogs_____________________________________ | |
frg2 | ___green frogs with blue speckles**______________________ | |
frg3 | ___fully pink frogs______________________________________ | |
frg4 | ___fully green frogs_____________________________________ | |
** some of you may have interpreted the pathway to mean that both blue and pink have to be present to make green -- in which case the frg2 phenotype would be fully blue frogs. That answer will be accepted too. |
2. | (20 pts) Height in a species of plant can vary between 10 cm and 50 cm, and depends on the contribution of four genes -- A/a , B/b , D/d , and E/e, where upper case alleles are contributing and lower case alleles are non-contributing. Assume that all additive alleles contribute equally to plant height. | |
(i) |
How much does each contributing allele add to plant height? (4 pts)
|
|
(ii) |
How many height classes are possible in this species? (4 pts)
|
|
(iii) |
A true-breeding 20 cm plant was crossed to a true-breeding 40 cm plant. The F1 progeny were all 30 cm tall. These F1 plants were selfed, and the F2 progeny fell into nine height classes. Give the genotype of the F1 progeny and one possible set of parental genotypes that explains the cross. (Show your calculations.) (12 pts) 20 cm parent: (20 - 10)/5 = 2 additive alleles -- e.g., AAbbddee (but others possible also, as long as they are fully homozygous). 40 cm parent: (40 - 10)/5 = 6 additive alleles. F1: (30 - 10)/5 = 4 additive alleles; F1 x F1 gives all possible phenotype classes in F2, so F1 must be fully heterozygous -- AaBbDdEe. So the parents DON'T HAVE the same additive alleles -- e.g., AAbbddee (20 cm parent) x aaBBDDEE (40 cm parent) --> AaBbDdEe (30 cm F1). |
3. |
(16 pts) Misregulation of transcription of the STAR gene in humans leads to a disease called adrenal hypoplasia. Mutations that cause this disease are often recessive loss of function mutations in DAX-1, which encodes a transcription factor* that binds in the promoter region of STAR and regulates its transcription. *transcription factor = a protein which binds near or in a promotor and either activates or represses transcription |
|
(i) |
FOR THIS QUESTION, ASSUME THAT DAX-1 MUTATIONS CAN BE EITHER DOMINANT OR RECESSIVE. The situations below show possible functions for wild type DAX-1. For each function, two possible effects of mutation are given. Next to each mechanism, indicate whether, for that case, the adrenal hypoplasia mutation would be dominant or recessive. (12 pts) WILD TYPE DAX-1 FUNCTION: transcriptional repressor
WILD TYPE DAX-1 FUNCTION: transcriptional activator
|
|
(ii) |
In one family transmitting adrenal hypoplasia, affected individuals have no mutation in DAX-1. In this family, the mutation causing adrenal hypoplasia is in the promoter region of the STAR gene. Explain how this mutation may cause misregulation of STAR transcription if DAX-l is an activator of STAR transcription. (4 pts) Because of the mutation in the promoter region of STAR, the activator DAX-1 fails to bind, or binds poorly --> STAR is not transcribed, or is transcribed at a reduced rate. |
4. |
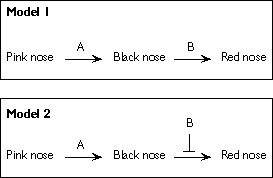
(16 pts) During the off-season, Santa has been investigating the genetics of reindeer nose color. But now that it's holiday season, it's up to you (his li'l helper) to keep the experiments going while he is off scooting up and down chimneys. From his lab notes, you can tell that he was working two possible models: |
|||||||||||||||||
...where A and B are independently assorting genes regulating the steps indicated. According to Santa's lab notebook, the cross:
gave the result that "there are three times as many black-nosed progeny as red-nosed progeny". (Santa had neglected to write down how many pink-nosed progeny there were.) Which of the two models do you think is correct? To support your answer, fill in the table below to show the predictions for each model (progeny genotypes and ratios, and phenotypes predicted in each model for those genotypes).
Correct model (circle 1): Model 1 Model 2 The black-nose progeny (9/16) are predicted to outnumber the red-nose progeny (3/16) in Model 2 -- this must be the correct model. |
5. | (14 pts) | |
(i) |
You heard in lecture about the identification of maze-dull and maze-bright lines of rats. Suppose you are studying learning behavior in two groups of rats that have been raised in similar environments. One group is highly inbred, while the other is derived from a large, randomly mating population. Which groups do you think will show higher heritability for maze-learning, the inbred group or the heterogeneous group? Why? (6 pts) The heterogeneous group. Because the inbred group are genetically very similar, variation in their phenotype must be attributed largely to environmental variation (they are genetically almost the same). The heterogeneous group are genetically dissimilar, so phenotypic variation can be attributed to genetic variation in addition to environmental variation.
|
|
(ii) |
A behavioral geneticist identifies two mutations (d1 and d2 ) that seem to cause rats to be maze-dull. How would you determine whether these two mutations are alleles of the same gene, or are mutations in separate genes? Show the cross you would do and the expected progeny phenotype(s) for each possibility (same gene vs. separate genes). (8 pts) Cross: Cross the two homozygous mutant strains to each other: d1/d1 x d2/d2 Results if d1 and d2 are alleles of the same gene: F1 progeny show the mutant phenotype (maze-dull)
Results if d1 and d2 are mutations in two separate genes: F1 progeny show the wild-type phenotype (maze-bright)
|
Answer #6 or #7, but not both. If you answer both, we will only grade #6. |
6. | (18 pts) In response to DNA damage, the mammalian checkpoint protein p53 activates p21, which blocks the cell cycle. Most mutations in p53 result in increased risk of cancer. However, a rare mutation (called p53*) is discovered that decreases the risk of cancer (i.e., the cancer rate is lower among individuals with this mutant allele). | |
(i) |
Suggest an explanation for how this mutation might lead to decreased cancer risk. Indicate whether you expect the mutant phenotype to be dominant or recessive (i.e., does a p53+/p53* heterozygote have the normal level of risk, or reduced risk?). (6 pts) p53* is active constitutively, always activating p21 (in normal cells, the cell cycle would have to be regulated by a second pathway). The mutant phenotype would be dominant (gain of function). |
|
(ii) |
The frequency of the p53* allele in a certain population is 1/1000. What fraction of this population do you think will show reduced cancer risk if the Hardy-Weinberg model applied here? (Assume that your answer in part (i) is correct with respect to dominant vs. recessive mutant phenotype.) (8 pts) Frequency of p53* = 1/1000 = 0.001 Therefore, frequency of wild type p53+ allele = 999/1000 = 0.999 Frequency of homozygous p53*/p53* = (0.001)(0.001) = 0.000001. Frequency of heterozygotes = 2(0.001)(0.999) = 0.001998 Frequency of reduced cancer-risk individuals = (heterozygotes + p53*/p53* homozygotes) = 0.001999. |
|
(iii) |
Based on what you have been told about the property of the p53* allele, why might the Hardy-Weinberg model NOT apply in this population? -- i.e., which assumption of the Hardy-Weinberg model might not hold? (4 pts) The Hardy-Weinberg model assumes that all alleles are equally fit. In this population, however, it seems likely that the p53* allele will have a different fitness than the wild type allele, so the real allele frequencies might deviate from the predicted Hardy-Weinberg frequencies. |
Answer #6 or #7, but not both. If you answer both, we will only grade #6. |
.. |