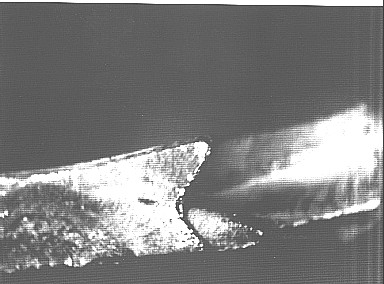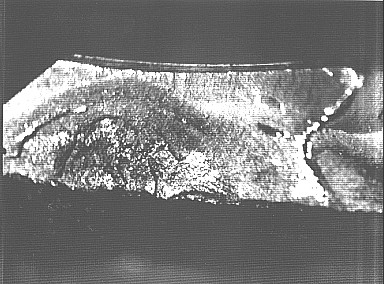
Figure 1. Part Overhead View Figure 2. Part Side View
Abstract
A look at failure analysis in the world of materials science and engineering
by Frederick Charles Cramer
Chairperson of the Supervisory Committee: Professor Thomas G. Stoebe
Department of Materials Science and Engineering
Boeing provided a part from one of their aircraft to be analyzed determining the reason for failure. This study will examine the microstructure of the materials in question for their mechanical properties and purpose of the design. Included with this report will be different areas on which failure analysis is performed, and summary descriptions of these areas. The failure was a crack propagating in the lateral direction until the critical failure on the part occurred. In any part designed to meet a specific need, there are many different areas to explore besides just the failure itself. The ethical standards are looked at as well. Because of failure in parts, failure analysis is essential in today’s high-tech world. In collecting the data, the micrographs showed the metal to be 4340-steel. The hardness test was very low at about 5 HRC. In the SEM pictures, the evidence of oxidation was prevalent showing corrosion activity. There was evidence showing the 4340-steel being in contact with Stainless steel. This made the 4340-steel more active in corrosion. The micrographs showed evidence that the crack initiation being attributed to the corrosion. Thus corrective action must deal with galvanic corrosion.
Table of Contents
List of Figures.................................................................................................. ii
List of Tables.................................................................................................. iii
Preface .......................................................................................................... iv
Introduction..................................................................................................... 1
Chapter I: Failure Analysis............................................................................... 2
Statement of Problem................................................................................. 2
Purpose of Study........................................................................................ 2
Description of Terms................................................................................. 2
Chapter II: Conceptual Framework.................................................................. 4
Physiology of Problem................................................................................ 4
Sociology of Problem................................................................................. 4
Chapter III: Methodology................................................................................. 5
Selecting The Boeing Company.................................................................. 5
Selection of the Part................................................................................... 5
Collection of Data..................................................................................... 5
Analysis of Data......................................................................................... 8
Chapter IV: Findings and Discussion............................................................. 10
Description of Findings............................................................................ 10
Summary.................................................................................................. 10
Bibliography .................................................................................................. 12
Appendix A: Corrosion................................................................................... 13
Appendix B: Micrograph/Microstructure....................................................... 16
Appendix C: Boeing Drawings...................................................................... 21
Glossary......................................................................................................... 24
Index.............................................................................................................. 25
Number Page
1. Part (Overhead View).......................................................................... 6
2. Part (Side View) .................................................................................. 6
3. Micrograph (With Flaw)....................................................................... 6
4. Micrograph (Grain Structure) .............................................................. 6
5. Optical Microscope (Crack close up)................................................... 7
6. Optical Microscope (Corrosion)........................................................... 7
7. SEM (Corrosion View 75X)................................................................. 7
8. SEM (Corrosion View 350X) .............................................................. 7
9. Specimen Picture (Corrosion)............................................................. 14
10. Micrograph at 1000X......................................................................... 16
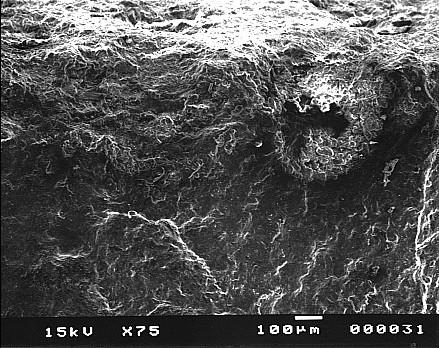
11. SEM at 75X....................................................................................... 16
12. Polishing Wheel.................................................................................. 17
13. Samples in Plastic Mold..................................................................... 17
14. Optical Microscope............................................................................ 17
15. Scanning Electron Microscope(SEM)................................................ 18
16. SEM Electron Column Diagram........................................................ 19
17. SEM Picture at 15X........................................................................... 20
18. SEM Picture at 900X......................................................................... 20
19. SEM Picture at 1000X ...................................................................... 20
20. Rockwell Hardness Machine ............................................................. 20
21. Boeing Drawing #1............................................................................ 21
22. Boeing Drawing #2............................................................................ 22
23. Boeing Drawing #3............................................................................ 23
Number Page
1. Rockwell Hardness Test Results.......................................................... 8
The author wishes to express sincere appreciation to Professor Stoebe for the opportunity to work on the educational web page. Also I would like to thank David Rice, whose help in preparing samples for testing, and his technical assistant when needed. He was always willing to help. In addition, Kevin Soderlund also helped with the preparation of samples. Sam Salamone helped with the SEM and went out of his way to assure success of this project. I also would like to thank The Boeing Company and their engineers Gregory Trepus and John Jones for their help in providing a part for analysis.
The purpose of this analysis is to study failure in a material and give background in the different areas of failure analysis. This is to be used to provide educational information on the web in the world of Materials Science and Engineering.
Failure analysis
Statement of Problem
Boeing provided a part from one of their aircraft to be analyzed determining the reason for failure. From this, they also wanted different solutions to correct the problem.
Purpose
of Study
The part provided failed at a point where a bearing and shaft are joined. A critical failure occurred causing the part not to function as designed. This study will examine the microstructure of the materials in question for their mechanical properties and purpose of the design. The focus will be why the failure occurred and if the design was sufficient for the stresses placed on it. Once the analysis is completed on the failure, a suitable fix will be proposed to remedy the problem.
Description of Terms
This project will give a look at a part from its design to failure. It will also focus on materials science, and what aspects it plays in the world of high-tech material design. Included with this report will be different areas on which failure analysis is performed and summary descriptions of these areas. This is for educational purposes, and The Boeing Company may not use the corrective action described in this report, but have a different corrective action in this case.
Conceptual
Framework
Physiology of Problem
The part given for study was designed to achieve strength in tension as well as compression. The part rotates on a bearing in the lateral direction. During its cyclic load, the part failed in tension in the vertical direction. The failure was a crack propagating in the lateral direction until the critical failure on the part occurred.
Sociology of Problem
In any part designed to meet a specific need, there are many different areas to explore besides just the failure itself. Ethics is a very important area. This involves the question of people and ethical decisions made during production. Ethics involves honesty. When a part is designed and built, is it produced assuring safety and reliability. If a part fails after this process, was it the fault of the designers? This is a question faced in failure analysis. Large companies use parts designed and built by other companies to construct their car, boat, or aircraft as in this case. They want to assure the parts they receive are of quality before installing them in their design. In big companies, high ethical values are very important assuring a good reputation with society buying their product. Other areas are the legal responsibility, as in replacement of failed parts or loss of equipment. Because of failure in parts, failure analysis is essential in today’s high-tech world.
Methodology
Selecting The Boeing Company
There are many different high-tech companies dealing with materials and parts that have failed. Boeing was selected because of their high integrity, assuring top quality design in their products. Their materials department and failure analysis showed ethics to be a top priority in their analysis process assuring top quality products. If a part failed, they wanted to know why it failed, not just replace the part assuring the failure would not be repeated. Another aspect of selecting The Boeing Company was to show how materials science is a very important part of the high-tech world. This would give a full picture from the start, when a failure occurred, to the finish.
Selection of the part
There were many different areas to consider when selecting a part for this type of case study. One, is it feasible to complete the study in the time allotted? With aircraft parts, there are issues regarding the sensitivity and security dealing with each part in an aircraft. So the company, Boeing in this case, had to take all of this into consideration before releasing the part for study.
Collection of Data
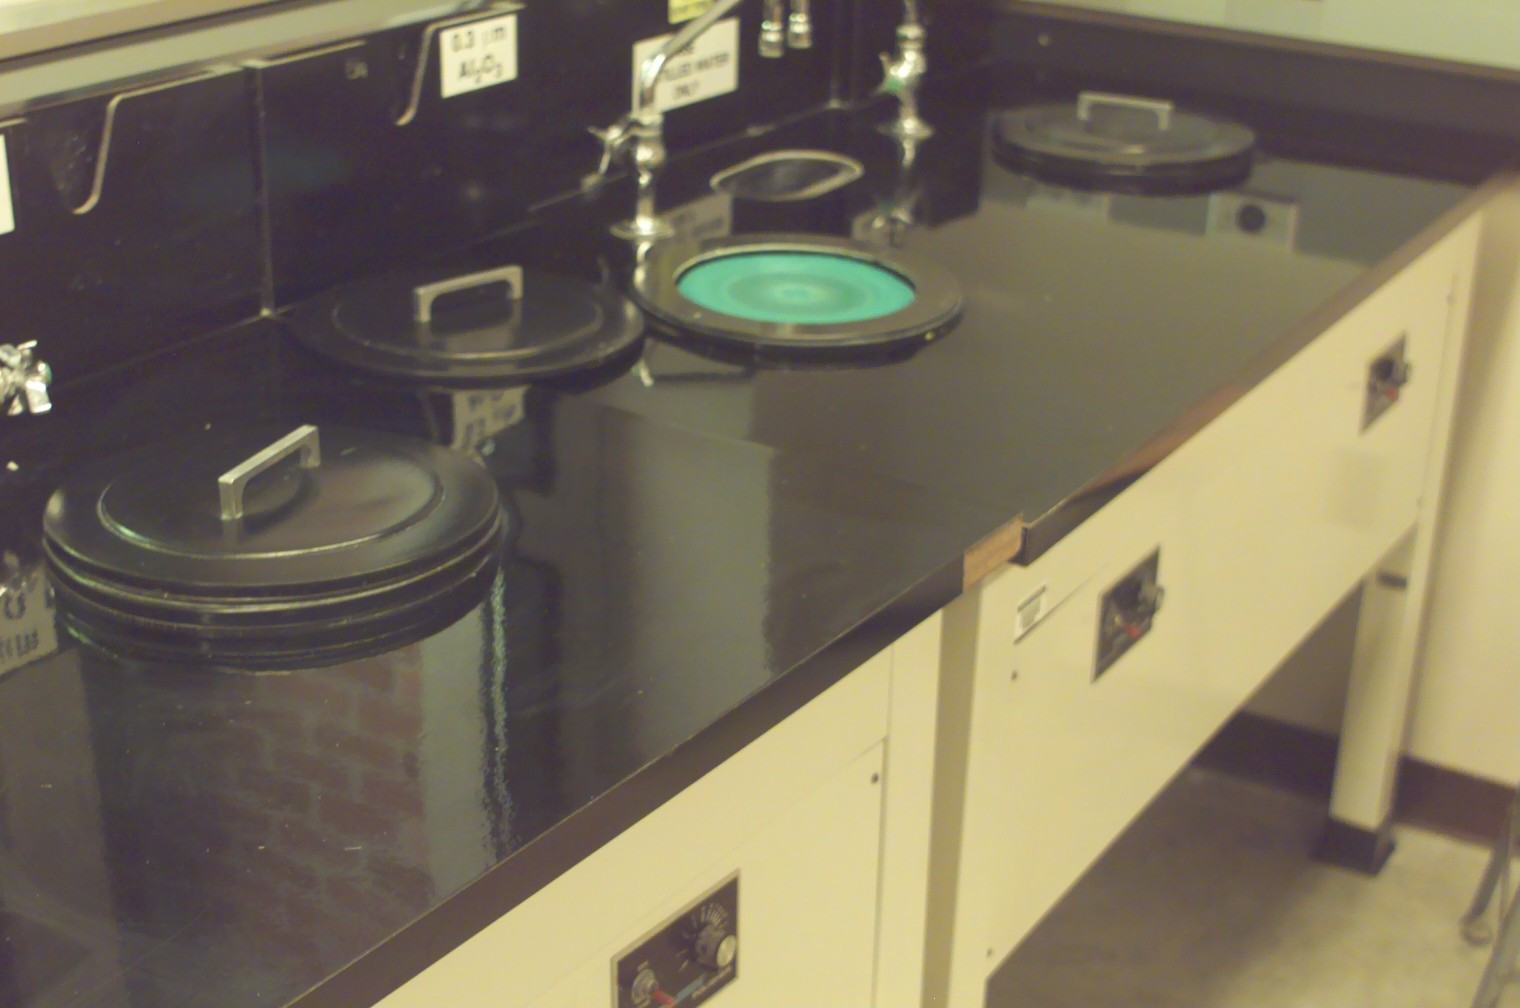
There were three different areas of analysis used in the collection of the data. On the next page, in figures one and two, are pictures of the part and the edge at which failure occurred. As you can see, the failure occurred in the lateral direction. It had a starting point and propagated around the circumference of the part. This showed a tensile failure. In figure two, a ruler with metric units and total length of ten centimeters, was used to show the actual size of the part. Also in each figure is a red arrow showing the initiation point. In appendix C, the drawings of the part are shown.
 The first area was explored using an optical
microscope. Optical microscopes are
further discussed in appendix B.
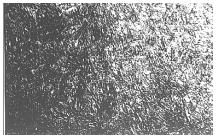
A sample was prepared by etching techniques to examine the grain structure of the material. On the left, in figures three and four, are pictures of the sample magnified
1000 times. These are the grains of the
material. In figure three you can see a
defect or void in the sample. When
looking at the sample prepared by polishing techniques, there were no other
voids found on the surface. But the
sample in figure seven, discussed later, another void was found. The grain structure in figures three and
four shows to be similar to 4340-steel found in the Materials Handbook, Vol. 7,
8th edition, page 39.
The first area was explored using an optical
microscope. Optical microscopes are
further discussed in appendix B.
A sample was prepared by etching techniques to examine the grain structure of the material. On the left, in figures three and four, are pictures of the sample magnified
1000 times. These are the grains of the
material. In figure three you can see a
defect or void in the sample. When
looking at the sample prepared by polishing techniques, there were no other
voids found on the surface. But the
sample in figure seven, discussed later, another void was found. The grain structure in figures three and
four shows to be similar to 4340-steel found in the Materials Handbook, Vol. 7,
8th edition, page 39.
From the information provided in appendix C, Boeing diagrams, the metal was 4340M heat-treated to 270-300KSI. Since no other data was available, a comparison showed the grains to be similar. Also using the optical microscope, the fracture surface was looked at. Below, in figures five and six, are pictures of the fracture magnified ten times. The surface showed corrosion attack, which penetrated the surface.
In the picture, the corrosion is adjacent to the initiation point of the crack. In figure five, a clear picture shows a cone shaped fracture consistent with tensile failure. Further analysis was done using a Scanning Electron Microscope (SEM). Further information on the SEM can be found in appendix B. The two figures below, seven and eight, showed enhanced images of the sample.
In figure seven, the corroded surface is magnified 75 times close to the area magnified in figure four at 1000 times. In figure seven there is a void, shown by the arrow, with evidence it occurred from the corrosion activity. In figure eight, the magnification is 350. This shows oxidation around parts of the metal detached by corrosion attack. The SEM needs the specimen to have a good ground. That is why a specimen being examined other than metallic, in most cases, needs to be coated with gold dust to assure a good ground. In figures seven and eight, there are areas around the grains that the SEM did not pick up. This is visual evidence of oxidation around the grain showing corrosion activity. A hardness test was done on different areas to further identify the material. Further information on the Rockwell testing machine can be found in appendix B. The hardness tests results are in table 1 below. The average test value is 5 in the C scale.
Analysis of Data
From the drawing in appendix C, the hardness test, and the analysis of the grain structure, the metal showed to be 4340-Steel. From the Rockwell hardness test in table one, the average hardness was 5 in the C scale (HRC). With any heat-treating to tempering 4340-steel, the hardness is at least 40 HRC. From the Metals Handbook, Ninth edition, Volume 4, page122, figure one, the hardness varies from 55 to 38 with heat-treating temperatures of 250 to 1000oF respectively. The metal tested showed not to be tempered. In figure two, the red arrow shows where the crack started, but also there is a spot where the Cadmium-Titanium base finish, shown in appendix C, was warn through and the two metals were in contact.
Findings
and Discussion
Description of Findings
Conversations with Gregory Trepus, the contact engineer with Boeing on this part, explained there was a stainless steel bearing attached around where the fracture occurred. The evidence in the micrographs and the SEM pictures, figures 5, 6, 7 and 8, shows the failure occurred from corrosion penetrating the surface of the 4340-steel creating a flaw in the surface. This initiated the cyclic stress crack. When the part cycled enough times in tension, the crack propagated until the part failed. Further, the surface only had corrosion near the stainless steel bearing. This is a characteristic trait of galvanic corrosion. In the text, Principles and Prevention of Corrosion, second edition, page 14, table 1.1 shows that stainless steel can be both passive and active in a galvanic series. Steel itself is more active than any stainless steel.
Summary and Recommendations
In conclusion, the corrosion found on the part showed corrosion attack. The fact that it was isolated to a specific area on the 4340-steel, which was in contact with the stainless steel, further proved galvanic corrosion as the cause. The spot found in figure two, where the base-finish was warn through, showed a contact point between the two dissimilar metals. This would have allowed galvanic corrosion to occur.
To fix this problem three different solutions are recommended. The first is to use a zinc ring pressed against the two metals. This will offer galvanic protection. What this will do is make the zinc more active than the other metals. This would leave the 4340-steel and stainless steel more noble, protecting them from corrosion. The drawback is the ring would corrode, thus needing annual replacement. The second is to place a plastic sheath between the 4340-steel and stainless steel preventing scoring of the 4340-steel from the bearing. The third is to use a circuit tester testing to see if current is passing between the two metals. If it is, then the part needs to be removed and checked for corrosion.
Callister, William D. Materials Science and Engineering: Fourth Edition, John Wiley & Sons, Inc, 1997.
Jones, Denny. Principles and Prevention of Corrosion, Second edition. Prentice-Hall, Inc, 1996.
Metals Handbook, Ninth Edition, Volume 4, American Society for Metals State, 1981.
Metals Handbook, Eighth Edition, Volume 7, American Society for Metals State, 1972.
Metals Handbook, Ninth Edition, Volume 8, American Society for Metals State, 1985.
Corrosion
Corrosion is a chemical and metallurgical process that breaks down the surface of a material. Corrosion is one of the leading problems faced with for engineers in the design process. Because it is such a problem many studies have been done in the prevention of corrosion. Corrosion is the transfer of an electronic charge in an aqueous solution. This involves an electrochemical reaction. Zinc with acid is a good example to use. The zinc reacts with acid forming zinc chloride and releasing oxygen on the surface. This type of reaction is a transfer of electrons from an anode to a cathode such as in a battery. The electrons are passed through a wire as current from one terminal to another connecting the Cathode and anode. The cathode is the metal plate in the battery and the anode is the acid. The current is the transfer of electrons in this process, thus supplying needed current in the electrical system. All corrosion reactions in water involve an anodic reaction shown below in formula 1.
Zn ® Zn2+ + 2e- (1)
2H+ 2e- ® H2 (2)
In formula 1 the zinc electron is reduced, while in formula 2 the hydrogen is increased. This is an electrochemical corrosion reaction. One type of corrosion, and the focus of this study, is in the area of galvanic corrosion. Galvanic corrosion is when two dissimilar metals are connected together with corrosive electrolytes. In this type of corrosion, one of the metals will be corroded while the other metal is untouched. This is caused by the difference in potential energies (Ecorr) between the two dissimilar metals. From Principles and Prevention of Corrosion Section 1.4.2: In an aqueous electrolyte solution the surface will reach a steady state potential, Ecorr, which depends on the ability and rate at which electrons can be exchanged by the available catholic and anodic reactions. As the surface potential increases above Ecorr to E, the anodic reaction rate or corrosion rate generally increases. If you use this and rated each metal to their Ecorr , then they can be ranked in a galvanic series according to their potential Ecorr. With this, any metal will be corroded when connected to another metal with a more positive or noble potential in their galvanic series. The more noble metal will be protected from corrosion while the other, more negative, one will corrode. When identifying if a suspected corrosion is from a galvanic series, two different dissimilar metals need to be identified. With this they have to be in contact with each other. There are
many ways to prevent galvanic
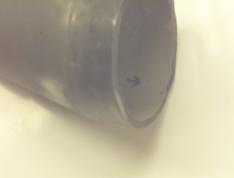
corrosion, and one is to coat the surface to prevent contact between each other. To the right, in figure nine, is a surface treated with a protective coating. The corrosion started on the surface inside the sample and which was a more active metal than the other metal that was
Figure 9. Specimen Picture Corrosion
on the outer surface in contact with an alkaline atmosphere. Another characteristic of galvanic corrosion is the corrosion always happens away from the point of contact between the two dissimilar metals, and will propagate under a protective coating. As discussed earlier, there are ways to provide protection against galvanic corrosion. Coating the surface will prevent contact between the two metals. Another is providing an electrical current across the two metals. This will equal out the potential difference between the two dissimilar metals. But this is not always possible, especially when the environment changes all the time and you might need to change the current to compensate. Yet another is attaching a metal that is more active than the other metals like zinc. Zinc is a very active metal. If you placed this in contact with two other metals with different Ecorr that are more noble than the zinc, then they would be protected from corrosion, and only the zinc would corrode. This is called galvanic protection, which is one of the solutions in this case study.
Micrograph/Microstructure
With optical and electron microscopes,
and Rockwell Hardness
machine.
Microstructures need to be looked at to determine different elements and defects that reflect the materials properties that are being examined. When examining a material, the structure and material properties need to be looked at to evaluate what they are. There are several different ways that are commonly used to identify these different areas. In some cases, the grains, which are the structural design, are visible to the eye without the use of a microscope. You can see these on a metal garbage can. In most cases, in the area of metallurgy, the aid of a microscope is needed.
To the right, in figure ten is a picture of the microstructure being examined in this report. It was taken with an optical microscope at a magnification of 1000 times. In figure 11, the same specimen was examined using a scanning electron microscope (SEM). You can see the difference in the clarity, and the advantage of using the SEM versus optical viewing. But not all facilities have this technology, so the uses of optical microscopes are utilized.
Figure 10. Micrograph at 1000X
Figure11. SEM at 75X
Many books are published with micrographs, such as in figure ten, to identify materials by their grain structure. To obtain this micrograph, there are different steps needed to prepare a sample to be viewed. The first of these is to cut a sample. Care needs to be taken when cutting a sample. If it is heated high enough, the grains in the microstructure will change leaving you with an incorrect picture of your structure. So cooling the sample while it is cut is very important. Second, the sample needs to be mounted in a plastic mold to hold it in place while being prepared. Sometimes a phenolic powder heated to its melting point, pressed and cooled, will act as a good mold. Now the sample can be sanded and polished to remove flaws on the surface. This will allow for a smooth surface during the etching process. Etching is a process used to bring out the grains in a
Figure 12. Polishing Wheel
Figure 13. Samples in plastic mold.
used to view the samples in figure 13 above. Once the picture is zeroed in on with the microscope, a computer aided television screen shown in figure 14, will view the targeted part of the sample. In this study, pictures of the grains are needed to identify the metal.
sample using different acids. To the left, in figure 12, is a picture of a polishing wheel used in this process. Also on the left, in figure 13, are two samples in a plastic mold holding them in place for preparation and analysis. The ruler is in metric units, and each sample mold measures approximately one centimeter in diameter. These samples are used in the optical microscope shown in figure 14 below. As in the picture, the two microscopes below are
Figure 14. Optical Microscope
In addition to the use of an optical microscope, the electron microscope is used to view the surface of samples. Shown in the picture below, figure 15, is a scanning electron microscope (SEM).
Figure 15. Scanning Electron Microscope (SEM)
The SEM shows very detailed 3-dimensional images at much higher magnifications than is possible with an optical microscope. The images created without light waves are rendered black and white. The SEM uses an electron beam with a uniform velocity. A filament creates this such like one in an ordinary light bulb. Not to worry though, the one in your home wont hurt you with an electron beam. The one in the SEM is specially made. It is a fine wire made of tungsten. The tip of the wire creates a thermionic emission, which travels down the column, shown in figure 6 above, through a series of condensers and objective lenses. This concentrates the electron beam to a small area in which it scans the surface of the sample being studied. Since electrons need a conductive area on the sample to be accepted, the surface needs to be conductive. If the specimen is not conductive a thin layer of gold coated on the surface, with a machine called a sputter coater, will assure good conductivity. The electrons reflect off the sample and are picked up by a detector. This detector converts the electron emissions into a signal sent to the computer and then to the monitor screen. The final image is built up from the number of electrons emitted from each spot on the sample. Below, in figure 16, is a drawing of the column where the electrons travel as in figure 15 above.

Figures 17, 18 and 19 show pictures using the SEM to zoom in on a particle found on the surface of the specimen.
In figure 17, an arrow depicts a particle of interest. Figure 18 zooms in on the particle, and figure 19 shows the particle at a magnification of 1000 times. Clearly the SEM is a valuable tool in analyzing materials.
Another test is the Rockwell hardness test. This is used as an aid in identifying materials through their hardness. A picture of a Rockwell Hardness Machine is in figure 20 to the right. By compressing a certain weight, as in HRC scale, 150 Kg is used. This weight is concentrated to a point on the surface, and observing how far it penetrates the surface will show the hardness. This is how the Rockwell Machine works in principle.
Figure 20.
Rockwell Hardness Machine
Boeing Drawings
Figure 21. Boeing
Drawing#1
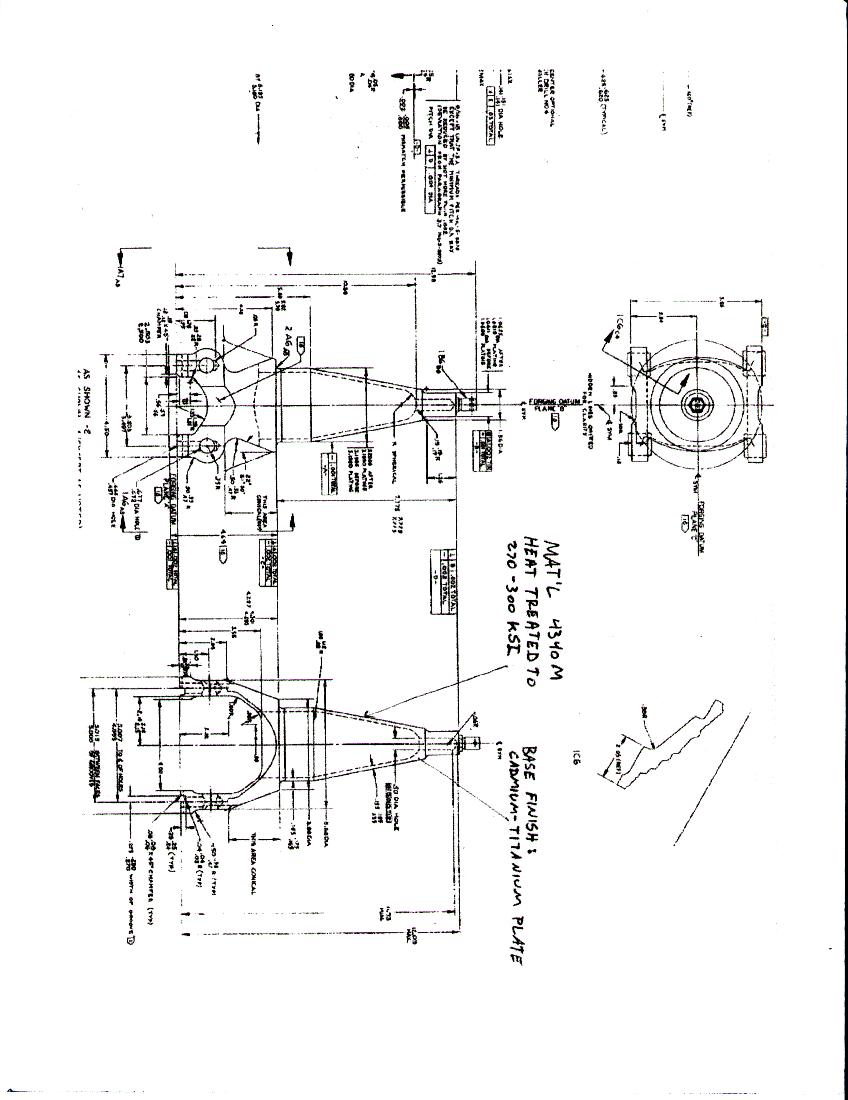
Figure 22. Boeing
Drawing#2
![]()
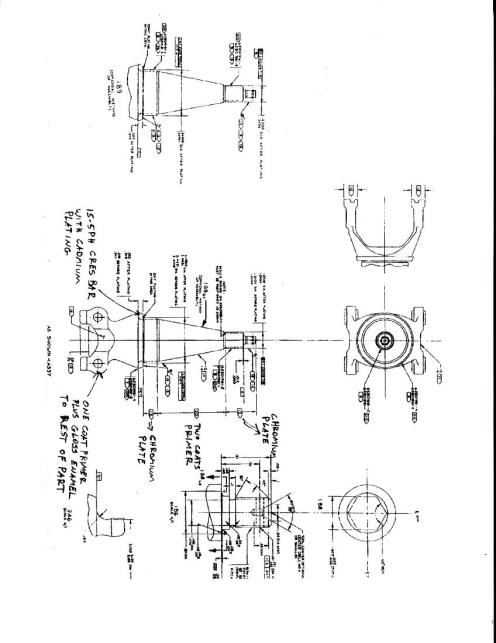
Figure 23. Boeing
Drawing#3


Glossary
Density. The number (of particles) per unit of measure.
Galvanic Corrosion. Two dissimilar metals in a galvanic series with one more active in corrosion.
Micrograph. The picture from the optical microscope used in identifying metals by their grain structure.
Kg. Unit of measurement as in measuring weight in kilograms.
Index
C
Corrosion, 12
G
Galvanic Corrosion, 13
Grains, 6
O
Optical Microscope, 16
R
Rockwell Hardness
Testing, 19
S
Scanning Electronic
Microscope (SEM), 17
M
Micrographs, 6