Climate change impacts on Alexandrium growth and bloom duration
Coarse-grid (100-200 km) global climate model ensemble simulations of the SRES A1B emissions scenario were regionally downscaled to a 12-km grid using the Weather Research and Forecasting model for the period 1969-2069 (see below). These results were used to: 1) analyze the future potential changes and variability of coastal upwelling winds, and 2) provide forcing fields to a Regional Ocean Model System (see below) used to simulate the circulation and biophysics of the Salish Sea, including Puget Sound, and the coastal ocean. By comparing circa-1990 and circa-2050 climate scenarios for the environmental conditions that promote Alexandrium blooms (see temperature-gradient-bar work by Bill et al. by clicking on the “field and lab” tab to the left of your screen), we disentangle the effects of three climate pathways: 1) increased local atmospheric heating, 2) changing riverflow magnitude and timing, and 3) changing ocean inputs associated with changes in upwelling-favorable winds. Future warmer sea surface temperatures in Puget Sound from increased local atmospheric heating clearly increase the maximum growth rates that can be attained by Alexandrium during the bloom season as well as the number of days with conditions that are favorable for bloom development. This could lead to 30 more days a year with bloom-favorable conditions by 2050. In contrast, changes in surface salinity arising from changes in the timing of riverflow have a negligible effect on Alexandrium growth rates, and the behavior of the coastal inputs in the simulations suggest that changes in local upwelling will not have major effects on sea surface temperature or salinity or Alexandrium growth rates in Puget Sound.
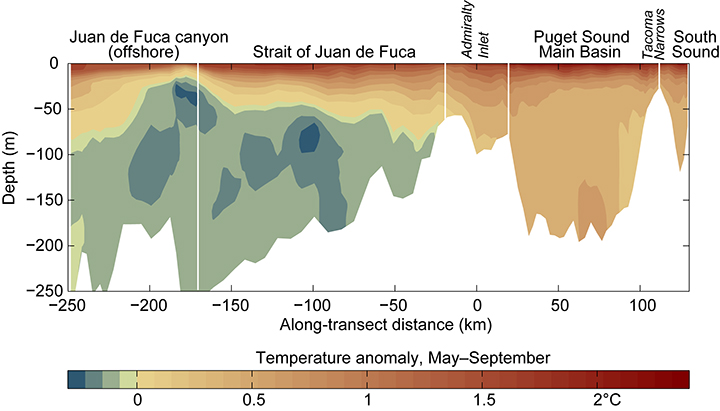
Change in mean summer temperature (future scenario minus present-day scenario, averaged May through September) along a transect line from Admiralty Inlet through the Main Basin of Puget Sound. From Moore et al. submitted.
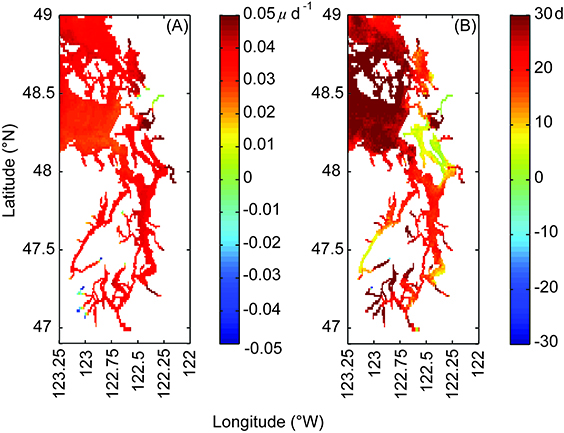
Differences between the present-day and future (A) growth and (B) bloom duration maps for Alexandrium in Puget Sound. Differences are calculated for the bloom season (May through October). From Moore et al. submitted.
Oceanographic modeling
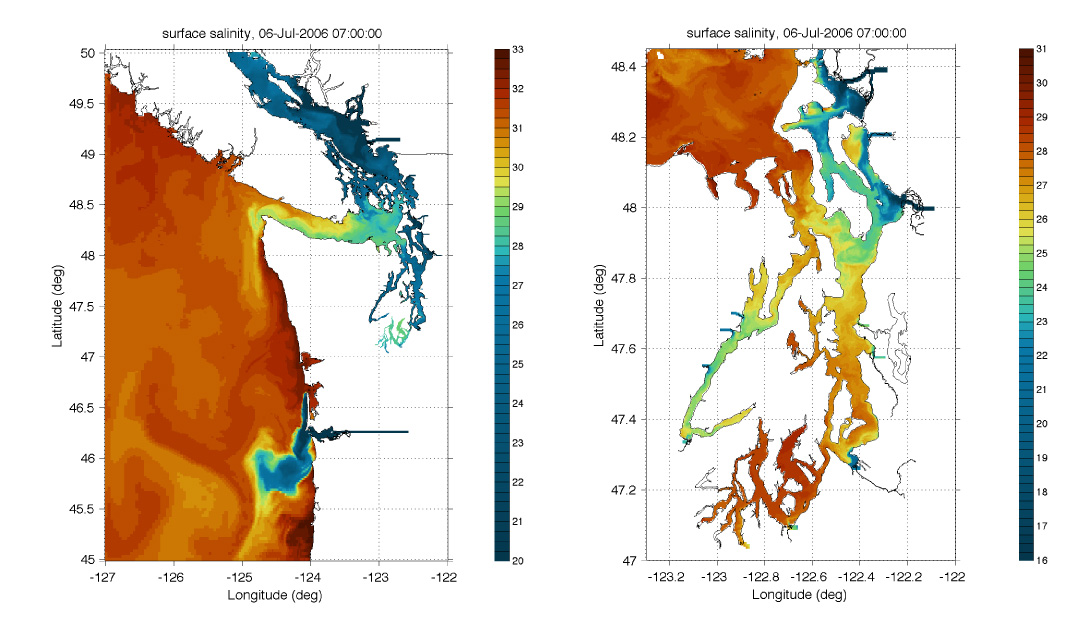
The oceanographic model of Puget Sound and surrounding waters used in this program is being developed by Parker MacCready, Neil Banas, and Dave Sutherland through the MoSSea program (Modeling the Salish Sea), sponsored by UW PRISM. The MoSSea website provides an overview of the model, animations of salinity, temperature, and more from a 2006 hindcast, extensive information on how the model performs relative to data from the many Puget Sound / Salish Sea monitoring programs.
The LiveOcean page includes model animations.
Read the manuscript by Sutherland et al. submitted to J. Phys. Oceanogr. documenting the 2006 hindcast in detail.
Regional climate projections
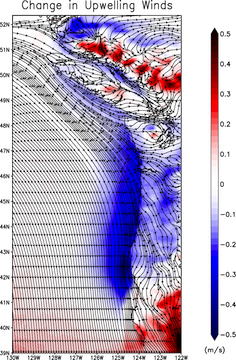
Regional climate simulations have been completed for this project using the Weather and Research Forecasting (WRF) model at 12 km grid spacing and forced by large-scale boundary conditions. Two long regional climate model simulations have been completed. One is a retrospective simulation (1948-2011) using NCEP-NCAR reanalysis as boundary conditions for WRF. The second is a 1970-2070 climate projection forced by ECHAM5 (Max Planck Institute, Hamburg) global climate model output, which will be used in addition to an existing WRF simulation forced by CCSM3 (i.e., Community Climate System Model Version 3) boundary conditions. These results will be used to support two tasks: 1) To provide forcing fields to the Regional Ocean Modeling System (ROMS) to simulate the circulation and biophysics of the coastal ocean and Puget Sound. The atmospheric forcing fields will be supplemented with freshwater river inputs derived from previous research. 2) The regional climate simulations will be used to analyze the future changes and variability of coastal winds. Results for the change in coastal winds from the current climate (1970-1999) to the future climate (2040-2069) are shown in the figure below. Contours show the streamlines for the current summertime surface (10 m) winds and shading indicates the change in meridional (along-shore) winds, with blue indicating an increase in southerly winds.