Japan 2011 - Port Orford Results (1/3 sec)
GeoClaw-MOST-Gauge comparison plot (Report Figure 34)
Plots and Movies for Japan 2011 - Port Orford
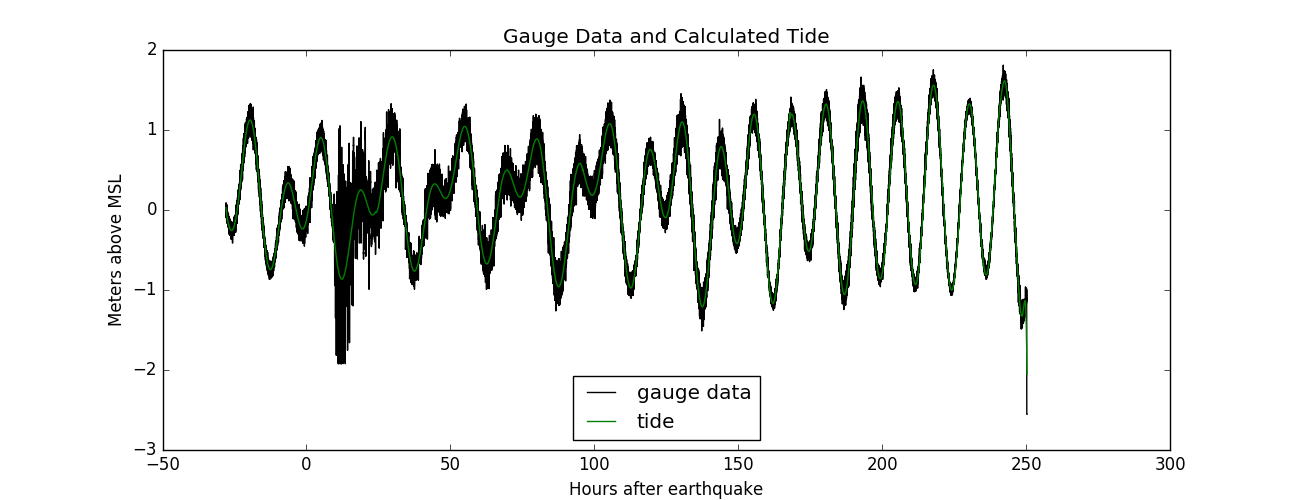
UW detided gauge results
Original gauge data and calculated tide
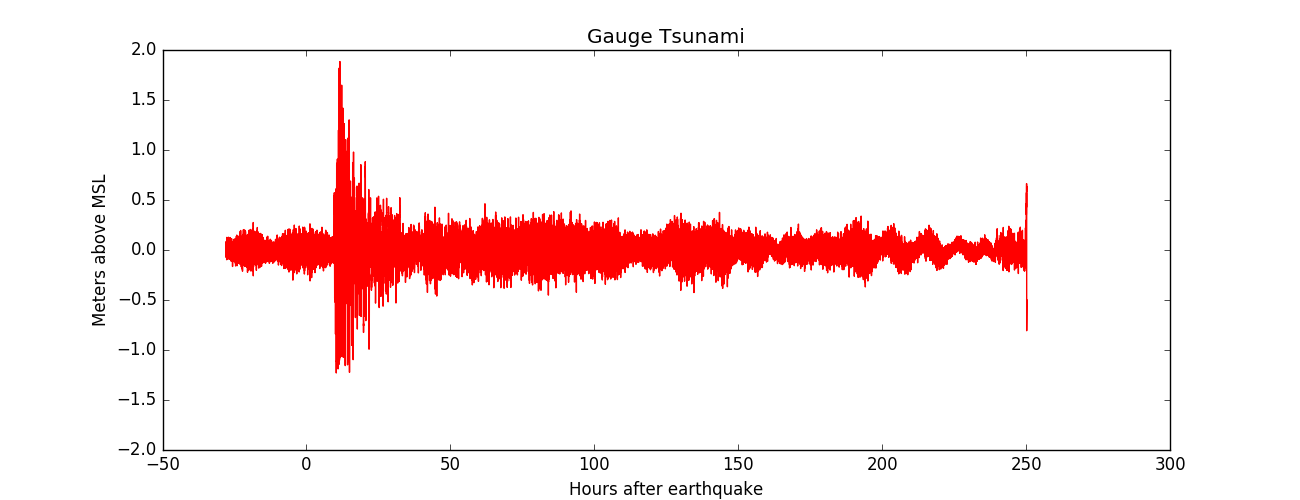
Calculated gauge tsunami
Google Earth .kml files. Click in Google Earth for description.
Computational domain (red)
Japan 2011 Source Location (pink)
Region 0 Location (white)
Region 1 Location (white)
Region 2 Location (white)
Region 3 Location (white)
Region 4 Location (white)
Region 5 Location (white)
Region 6 Location (white)
Region 7 Location (white)
Port Orford 1sec Topo Location (green)
Port Orford 1/3sec Topo Location (green)
Etopo 1 min Location (green)
Etopo 1 min Location (green)
Etopo 4 min Location (green)
Etopo 4 min Location (green)
Gauge Location (yellow pin)