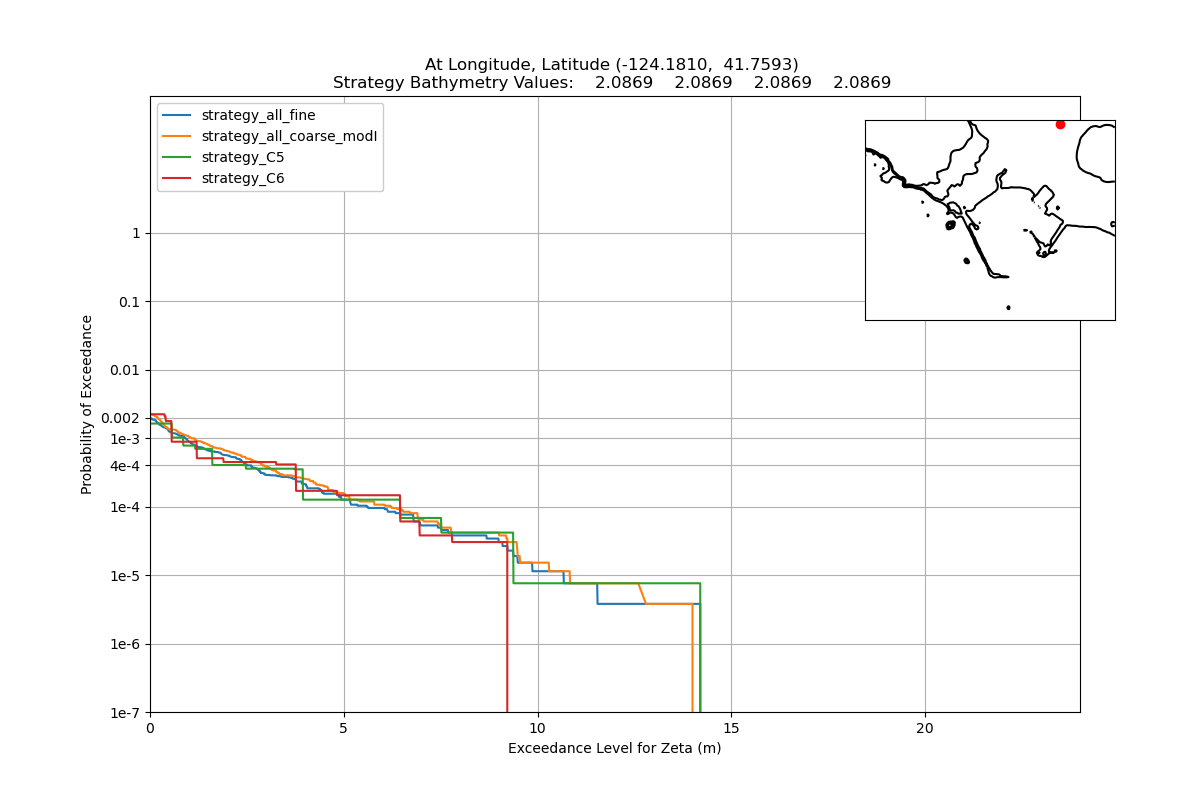
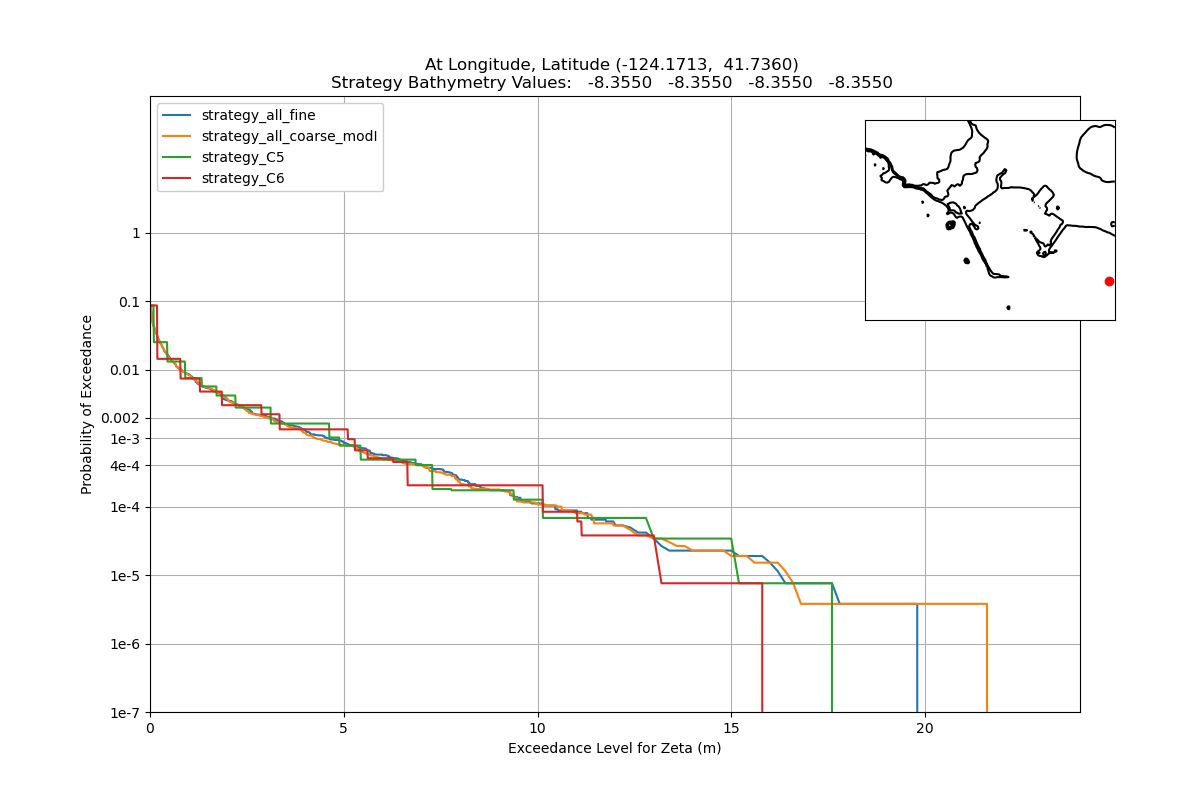
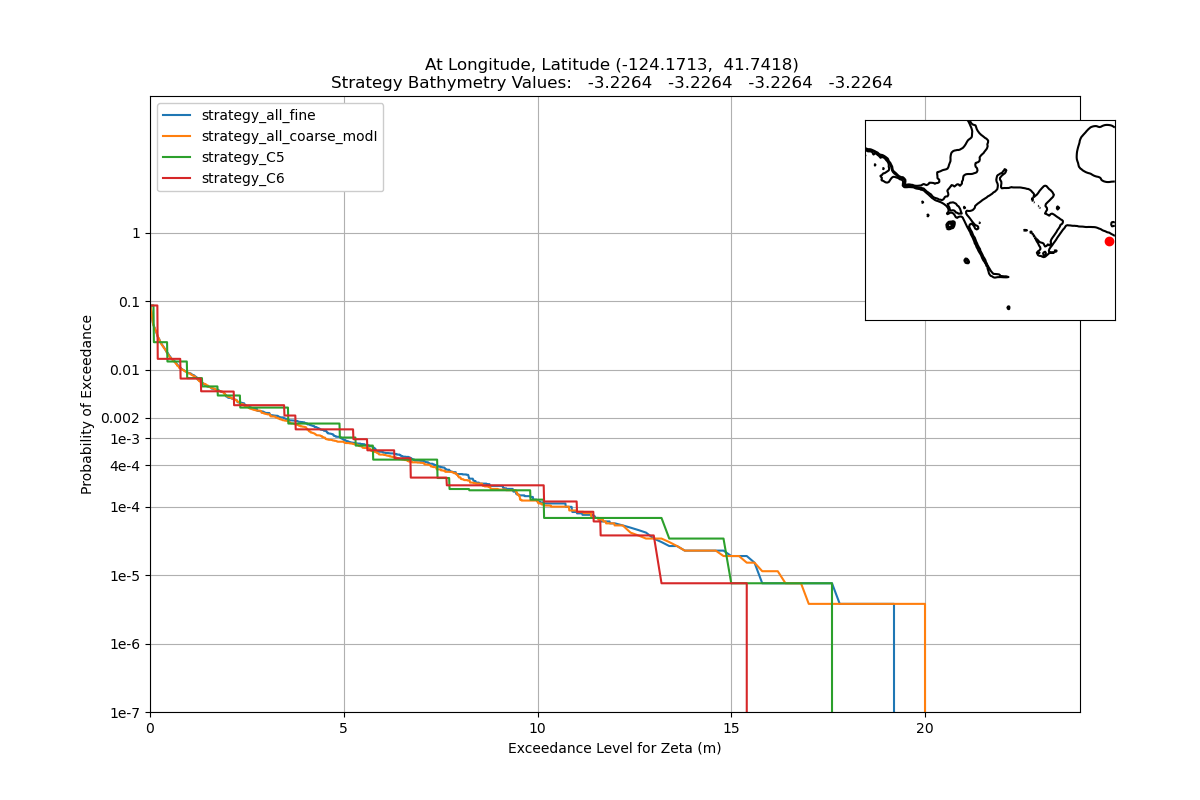
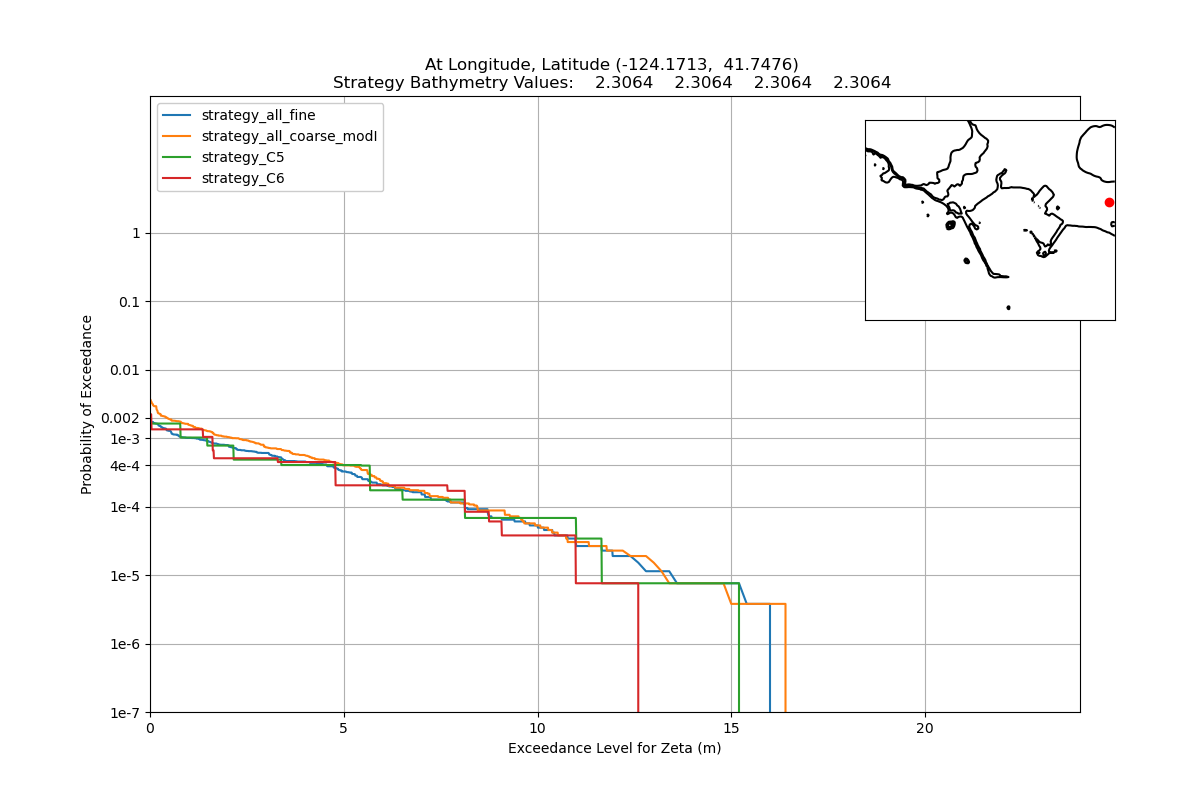
Comparison 20, Crescent City
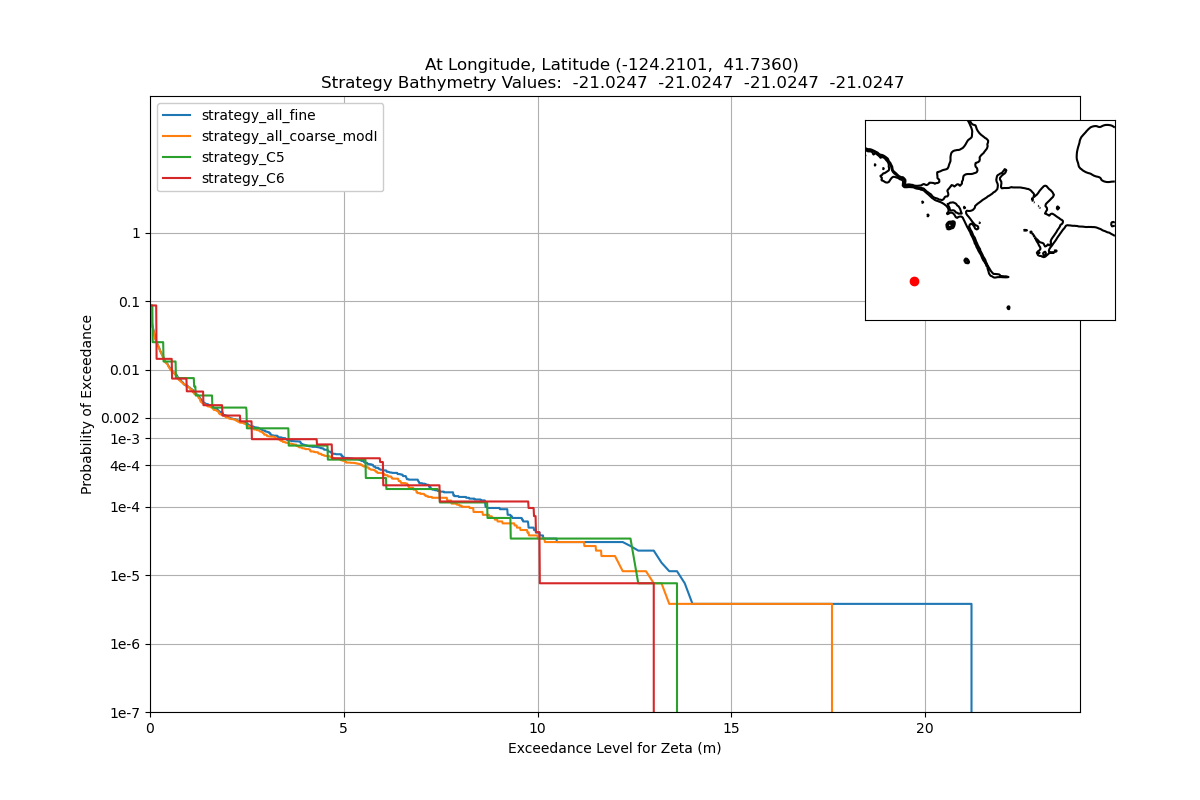
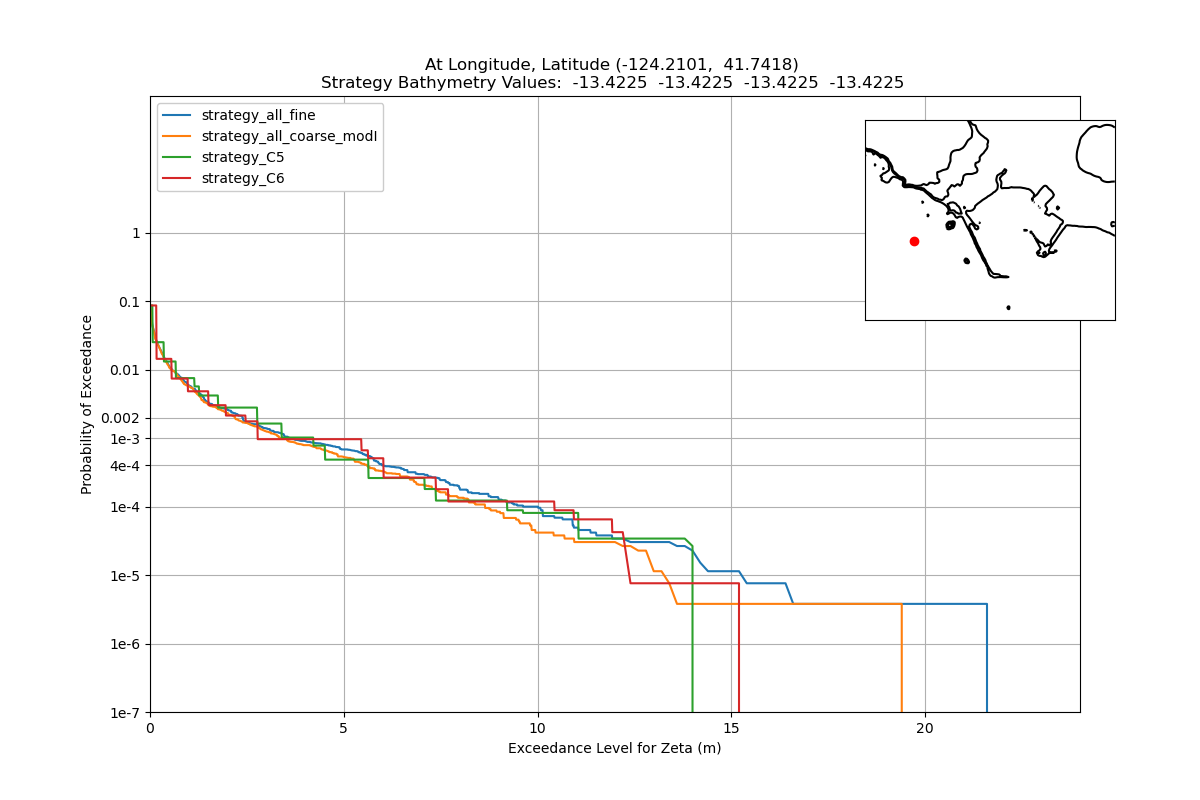
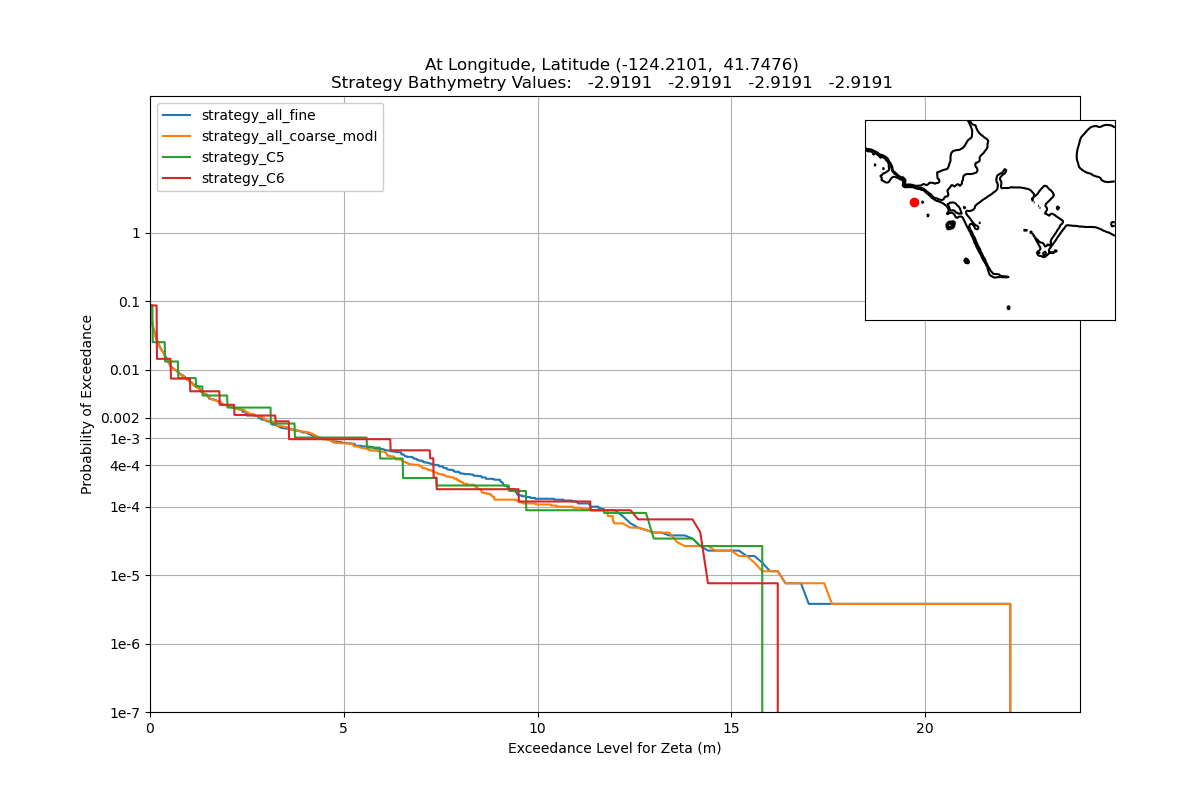
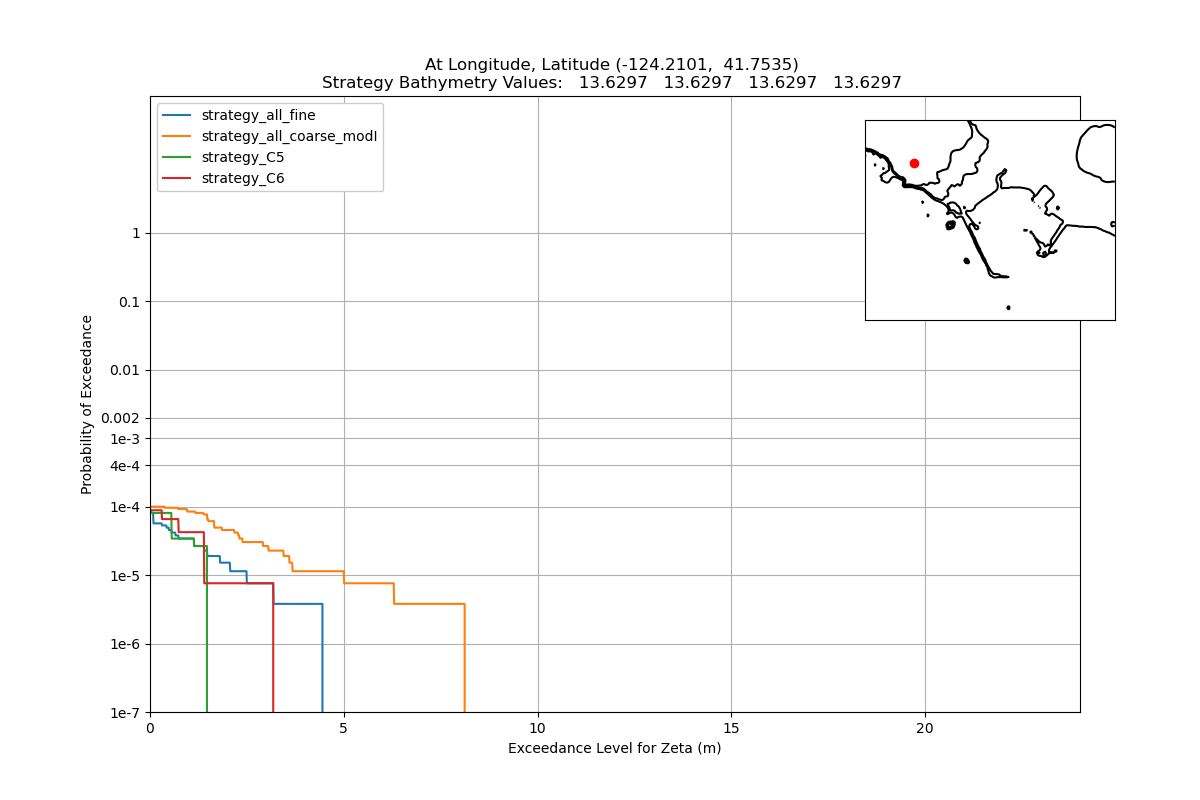
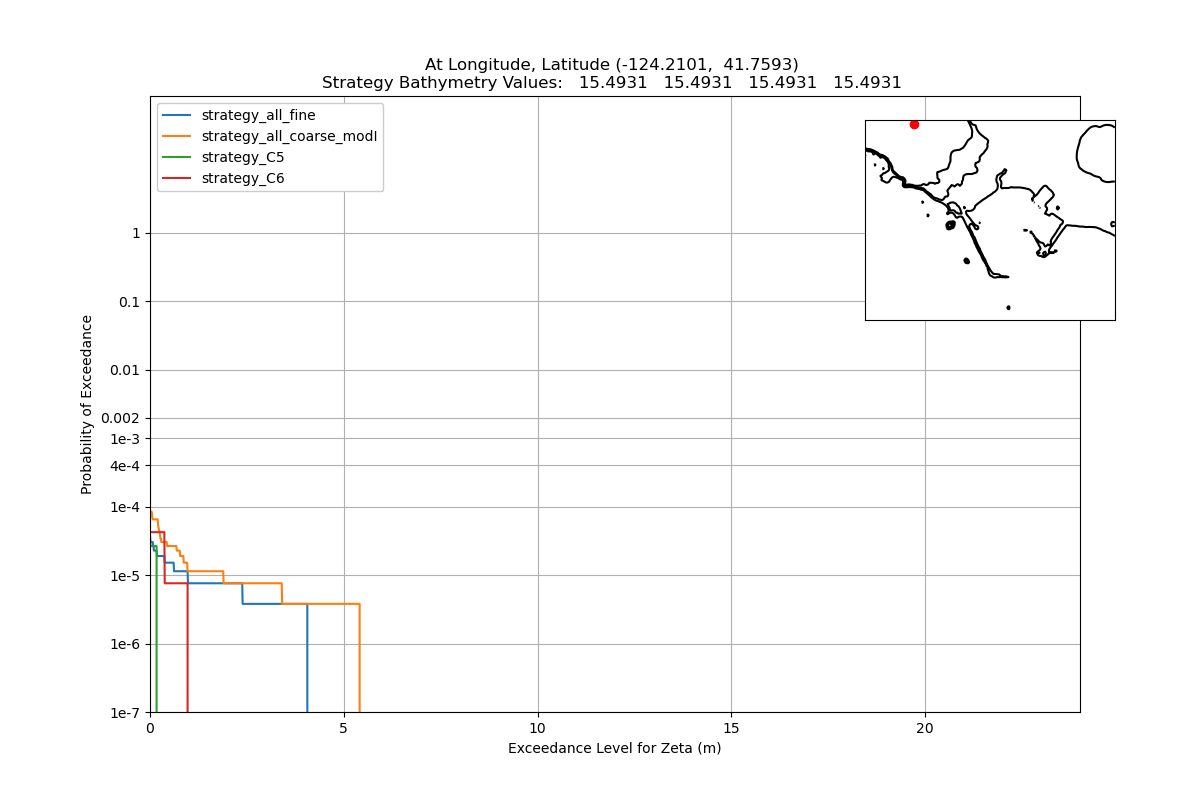
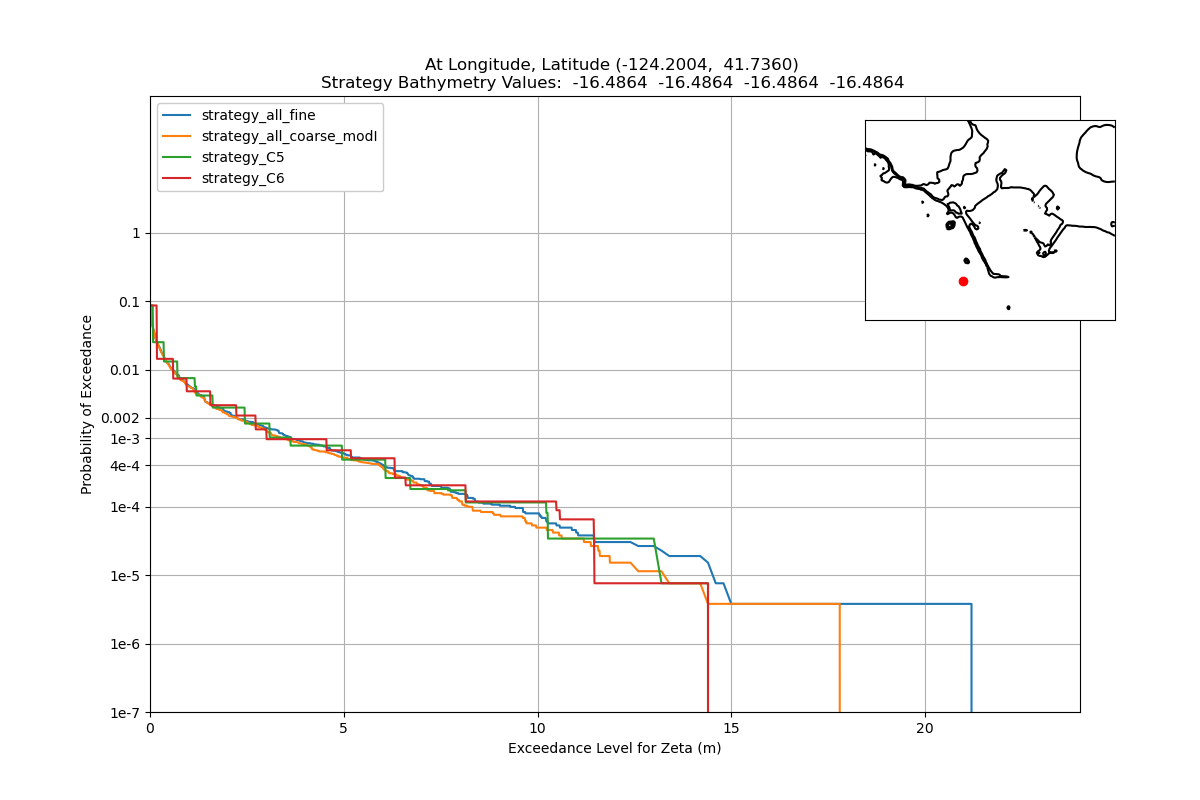
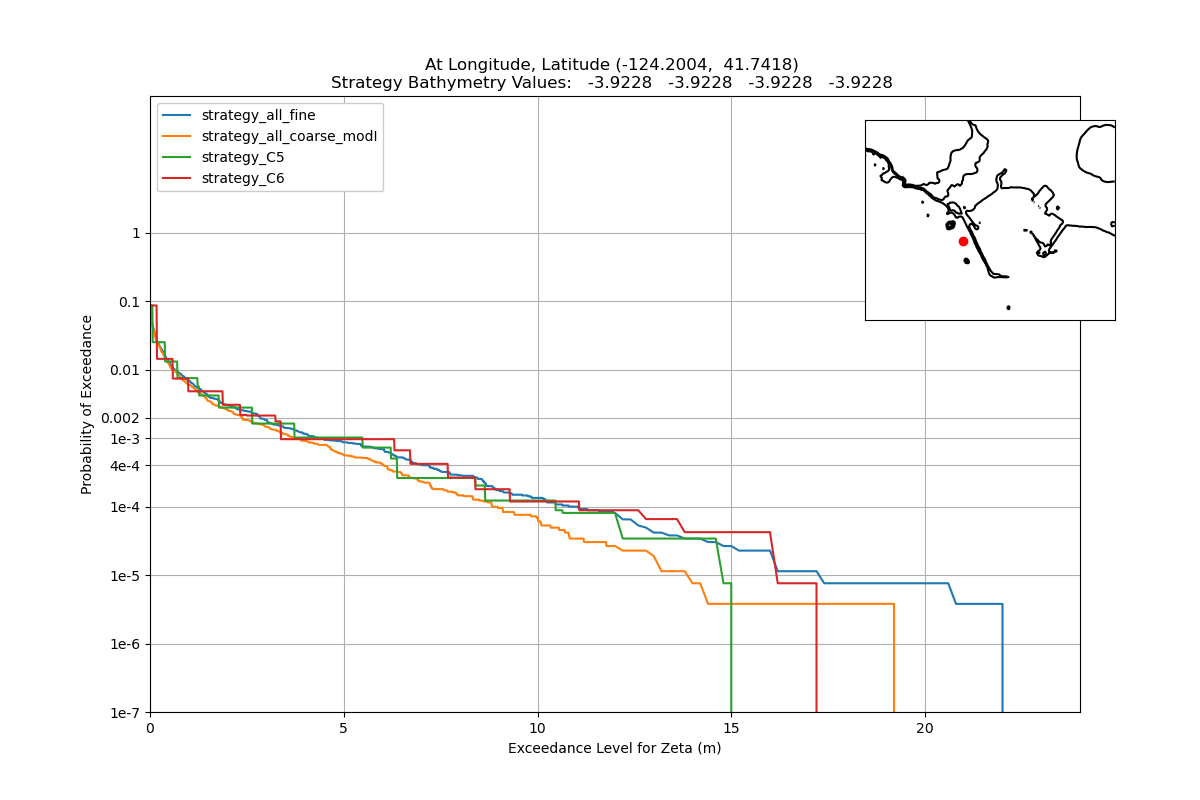
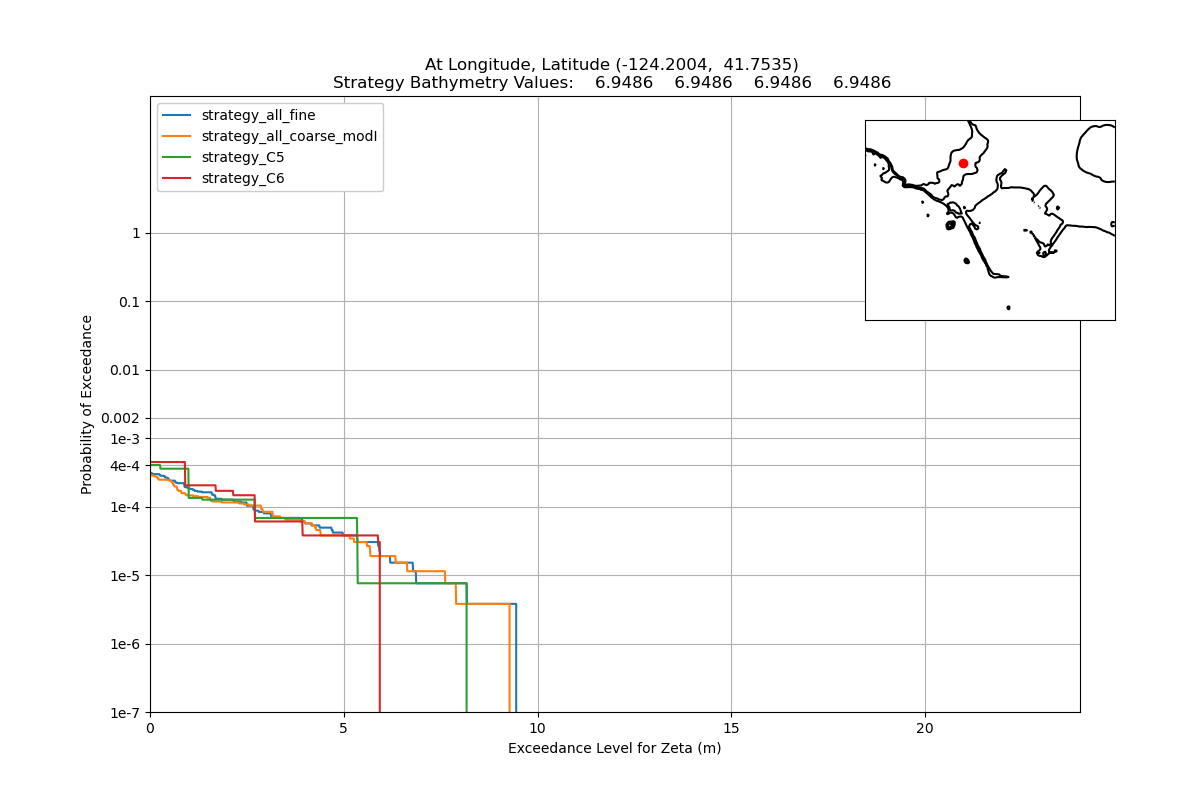
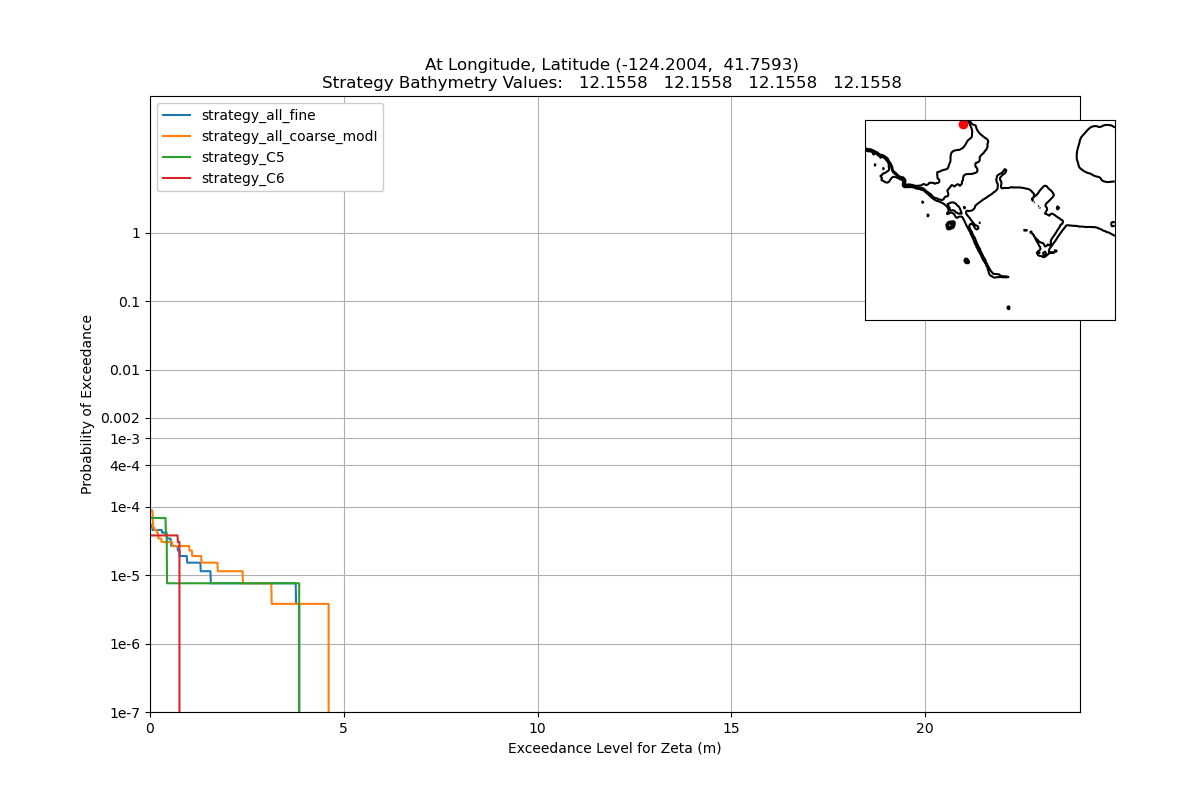
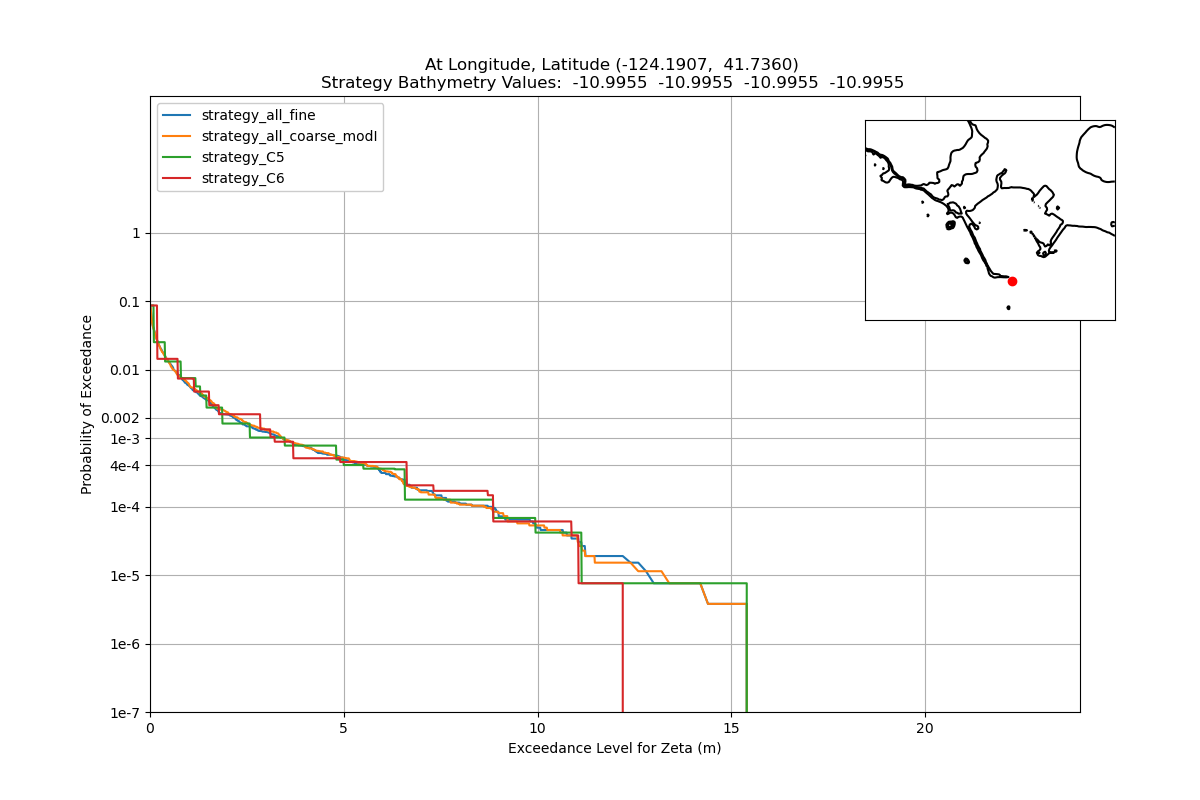
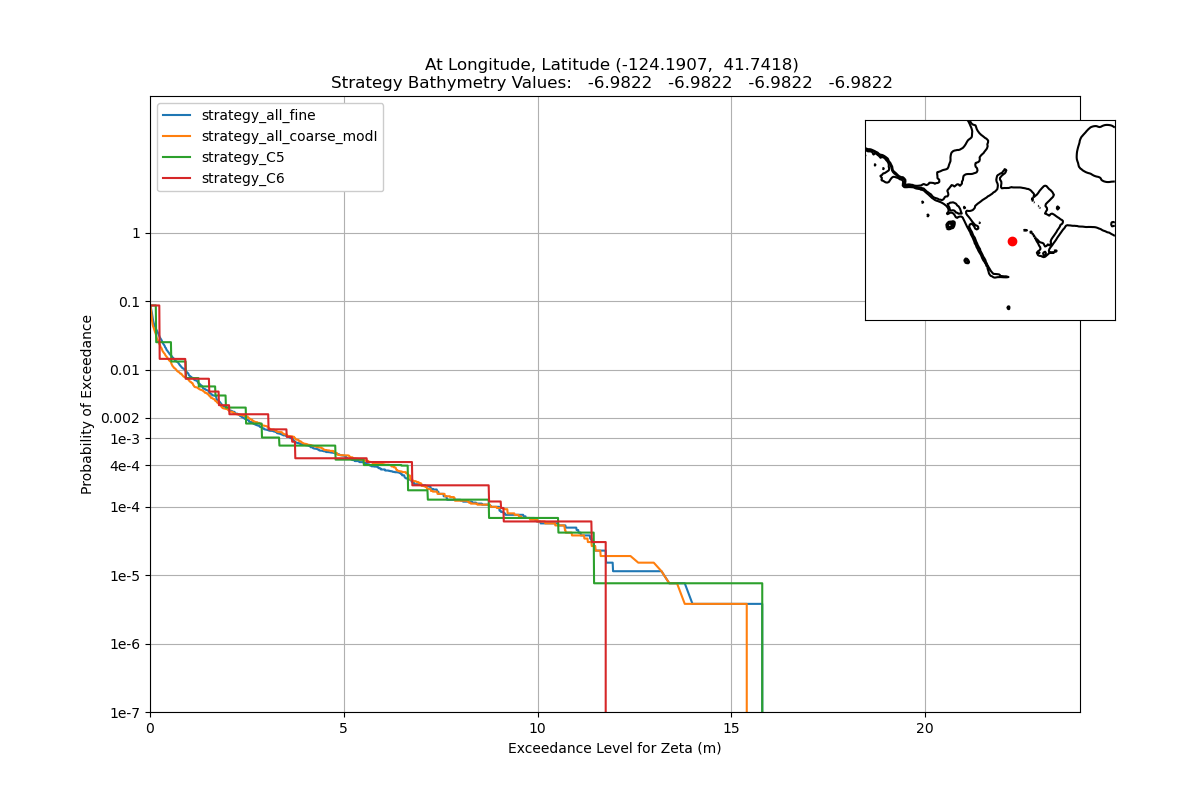
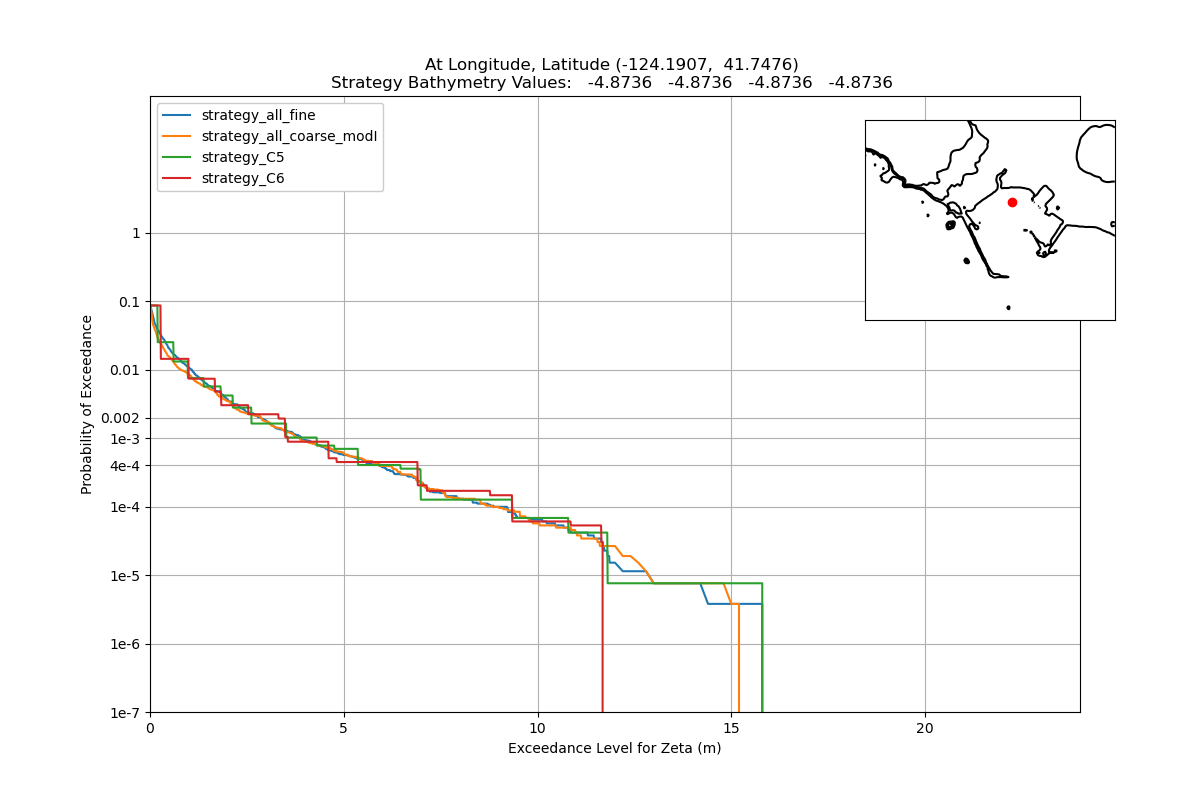
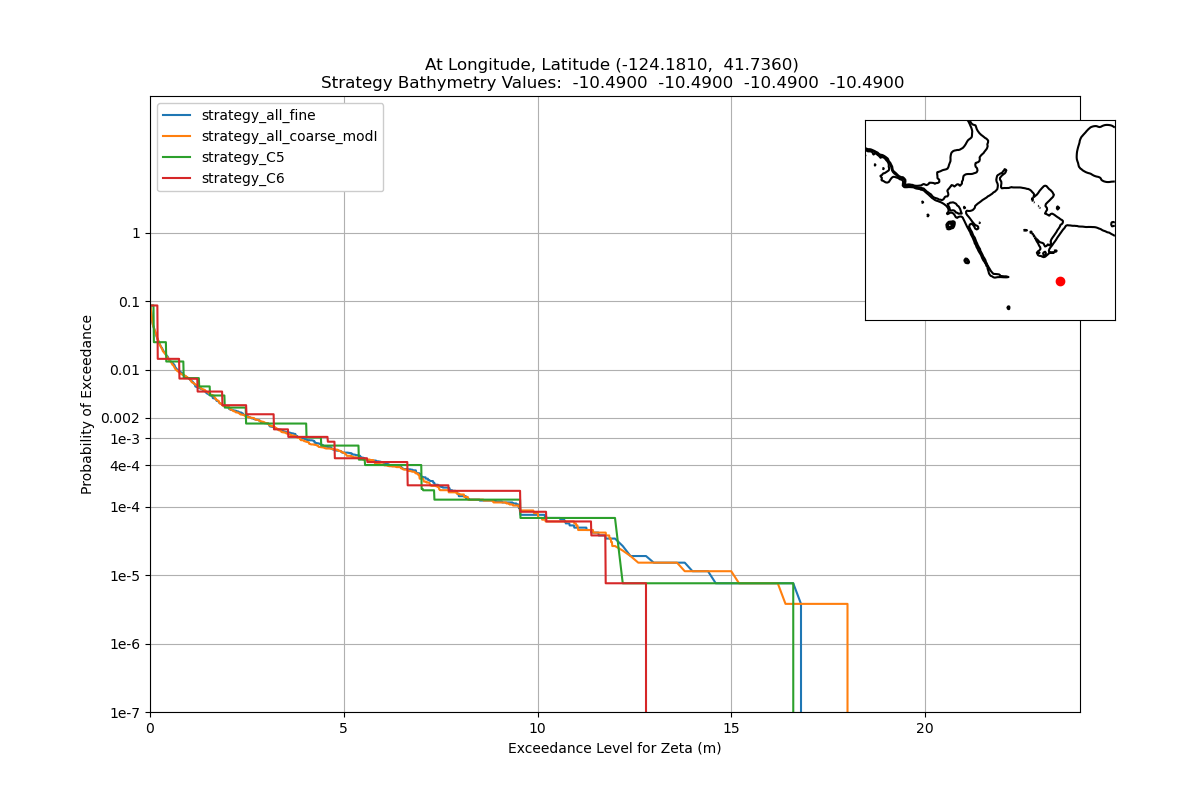
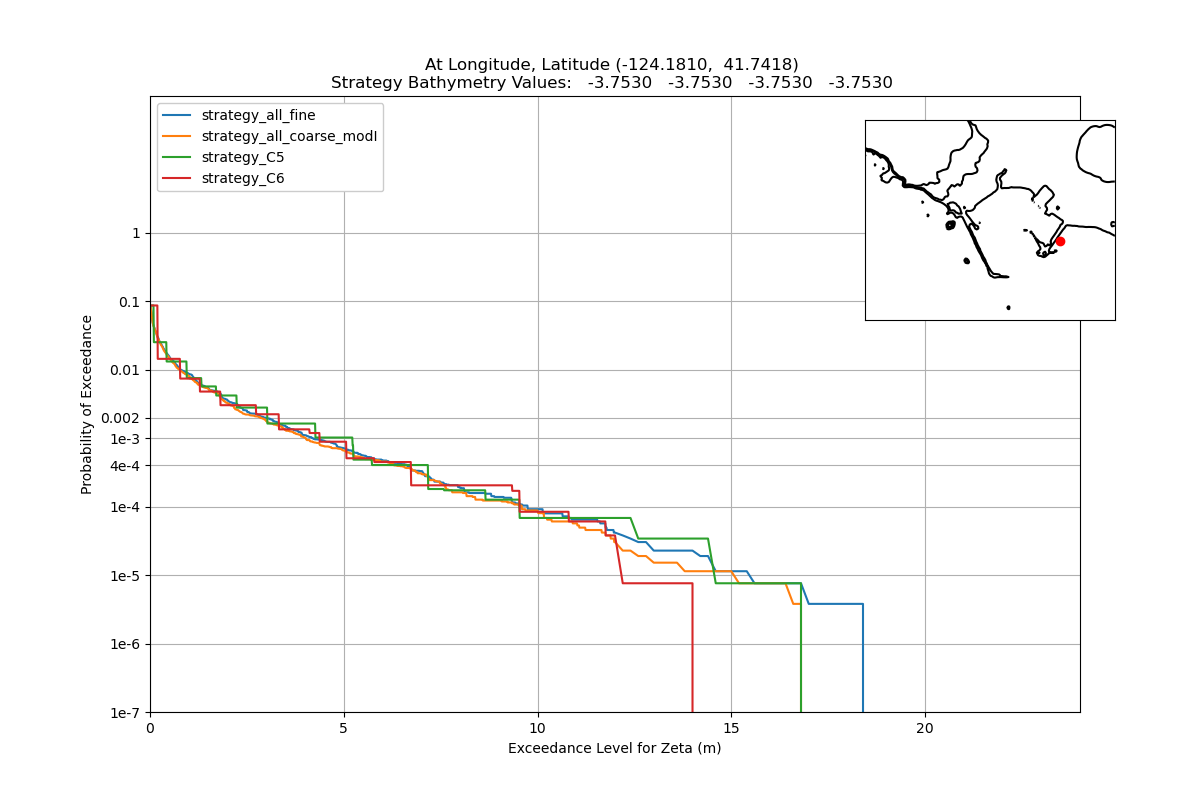
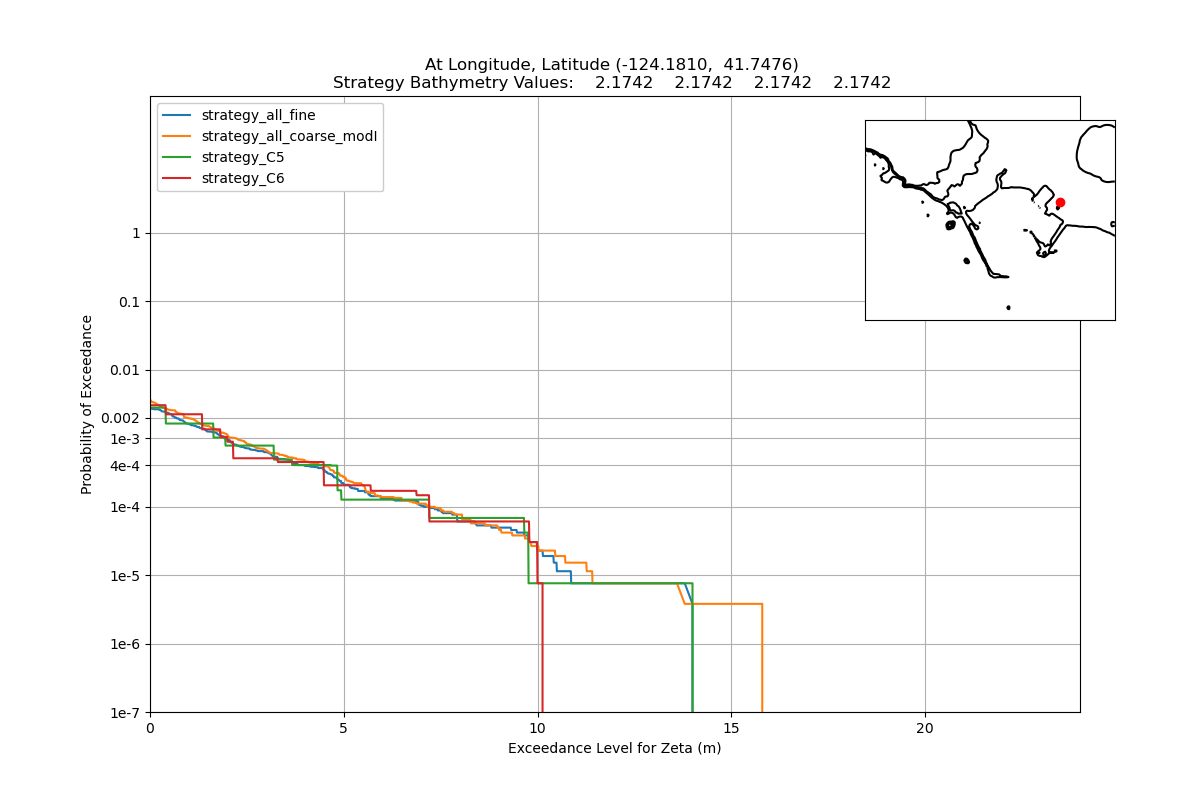
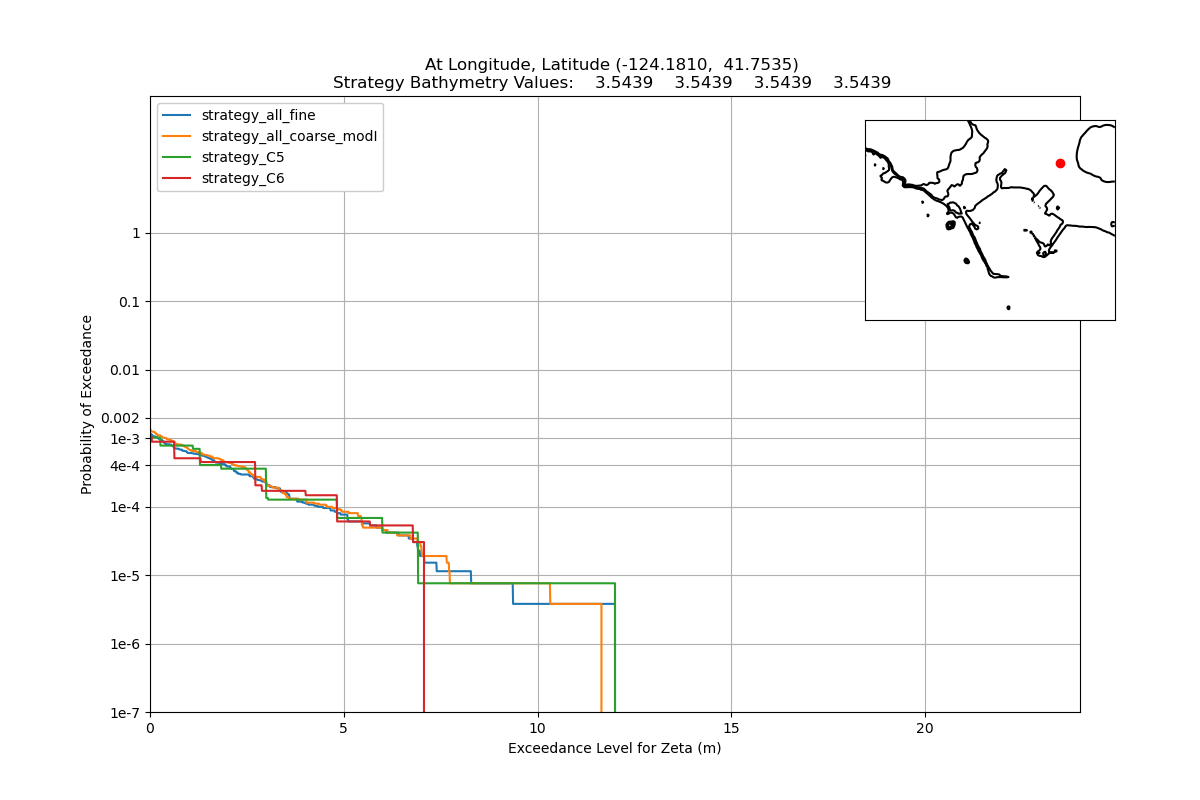
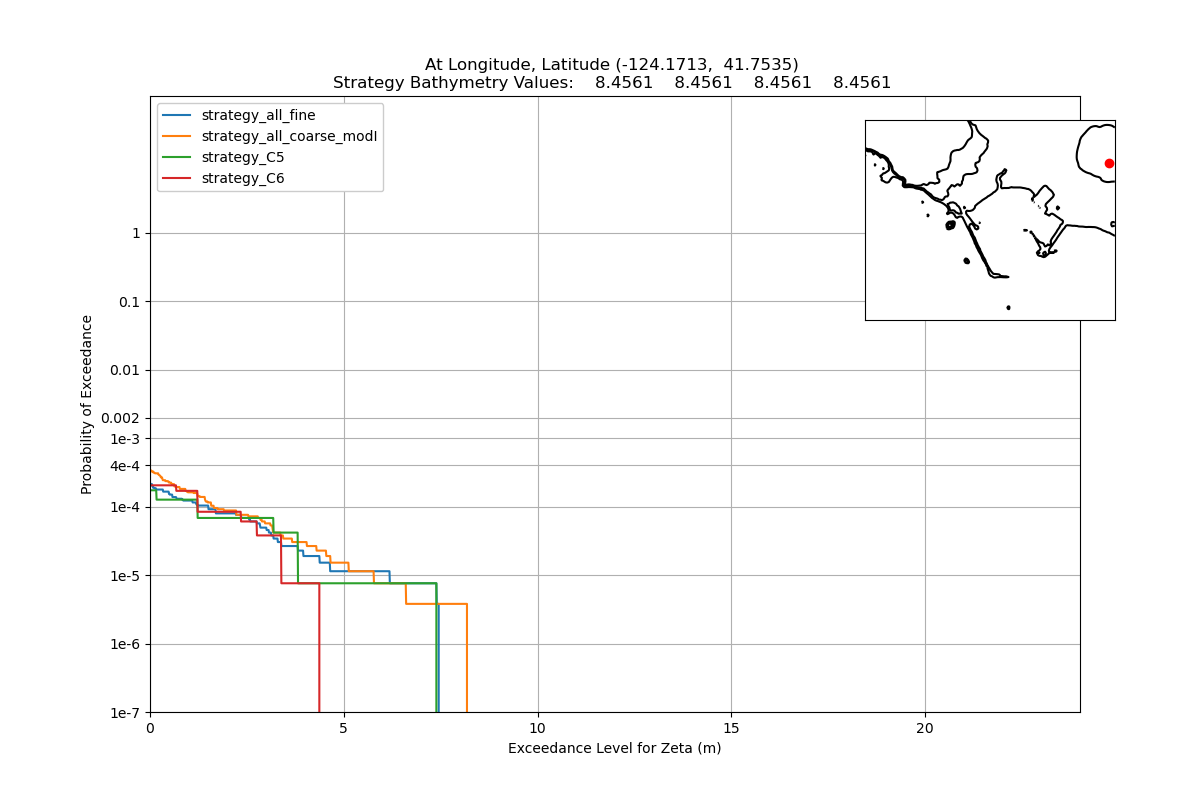
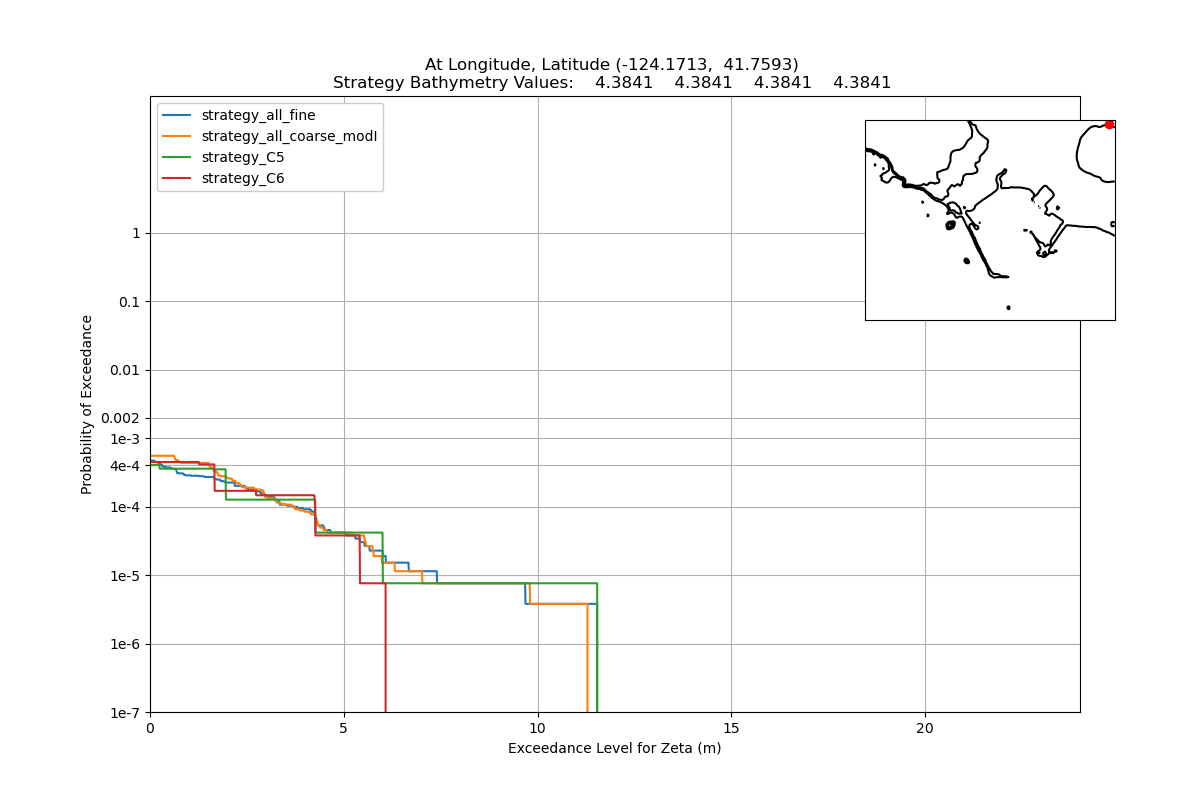
Hazard curves at selected locations
The four curves on each of these plots correspond to what is shown in the
four subplots of the plan view plots, described below.
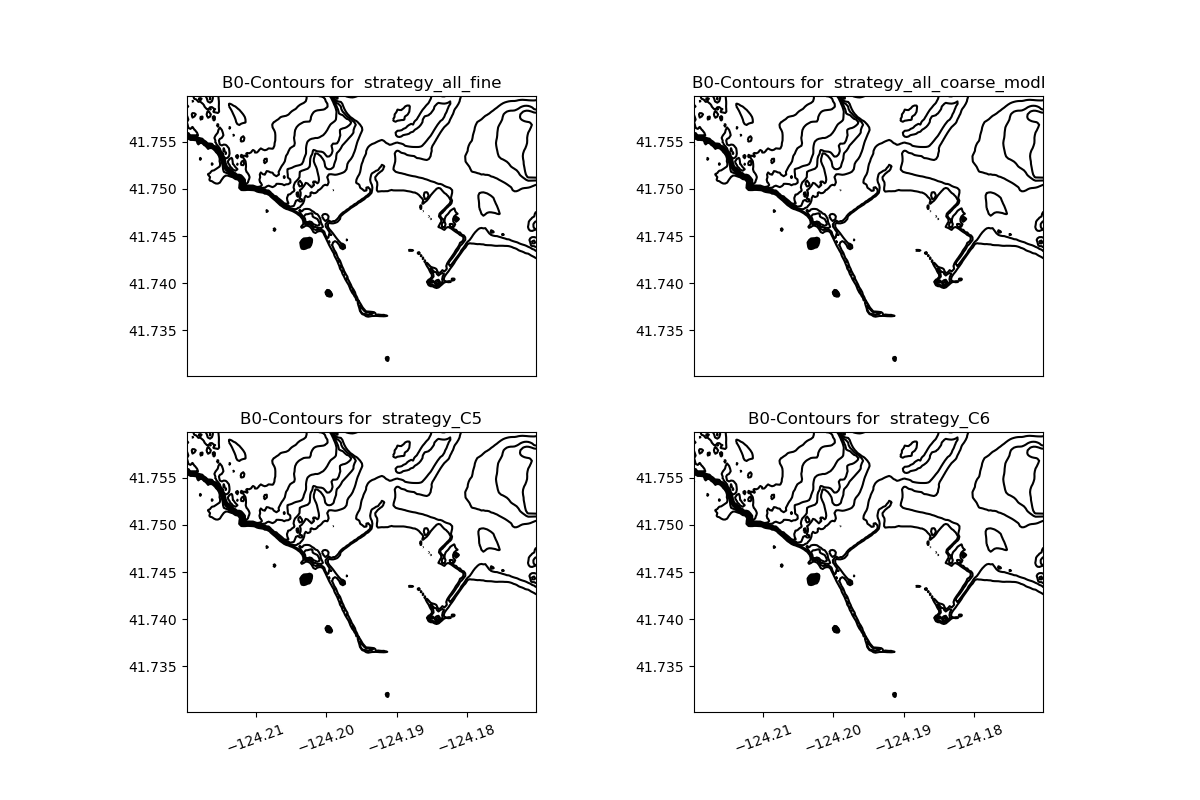
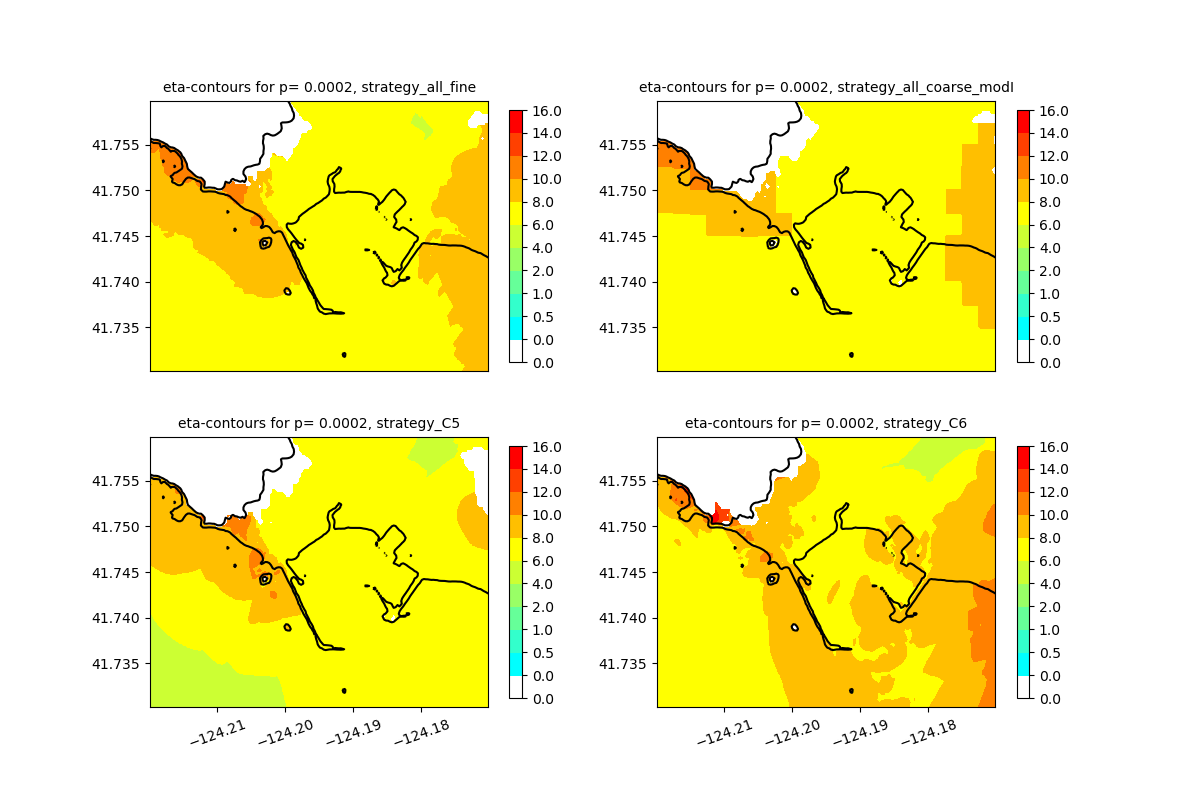
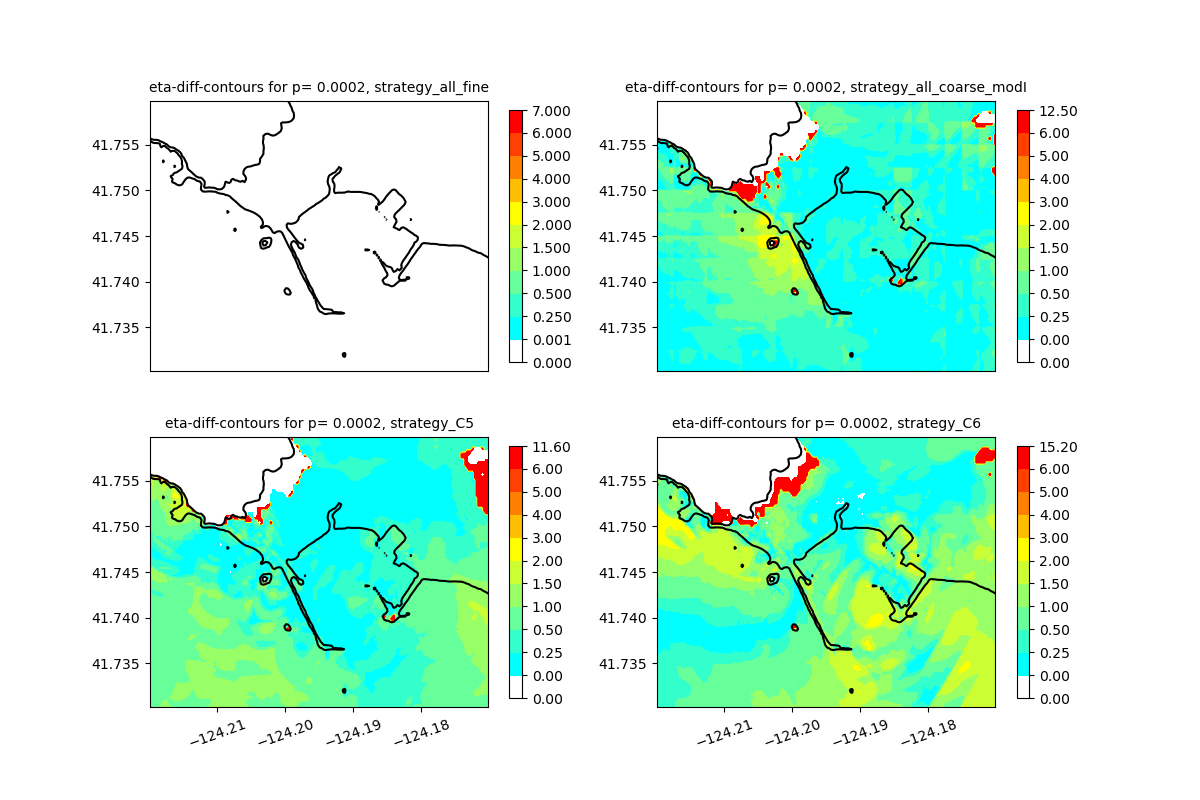
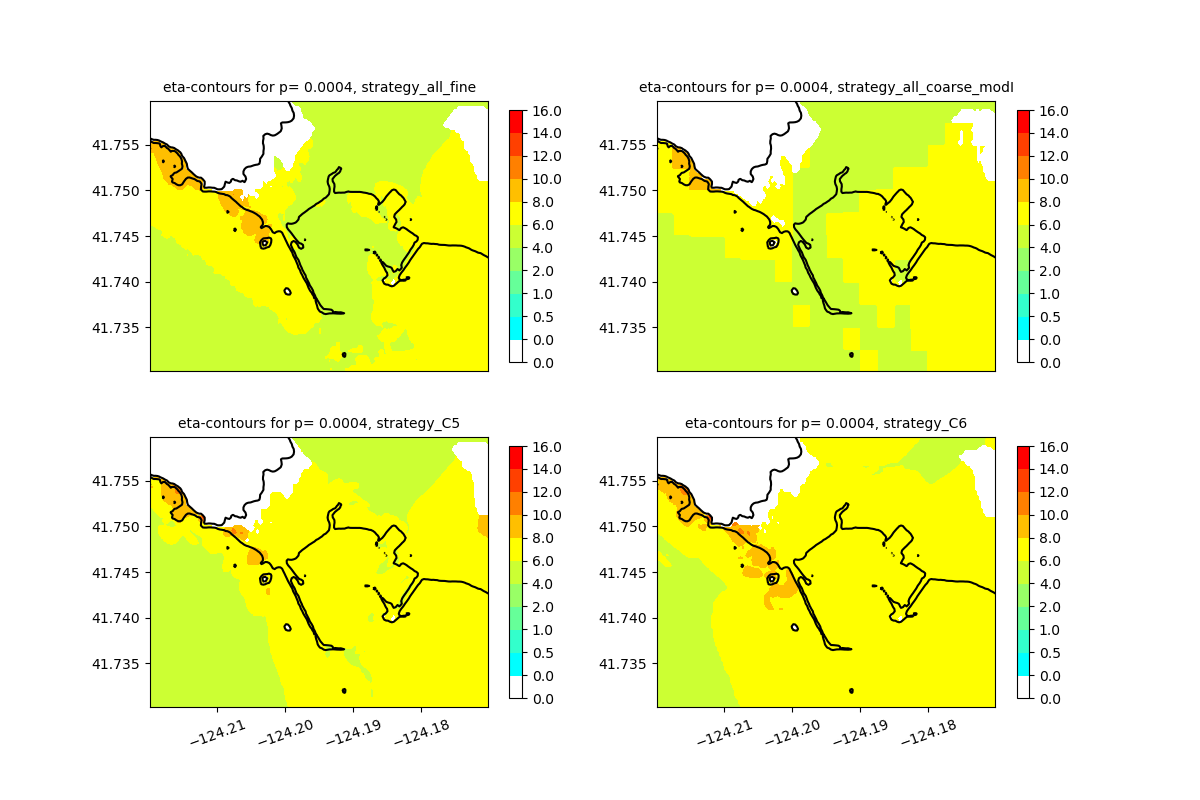
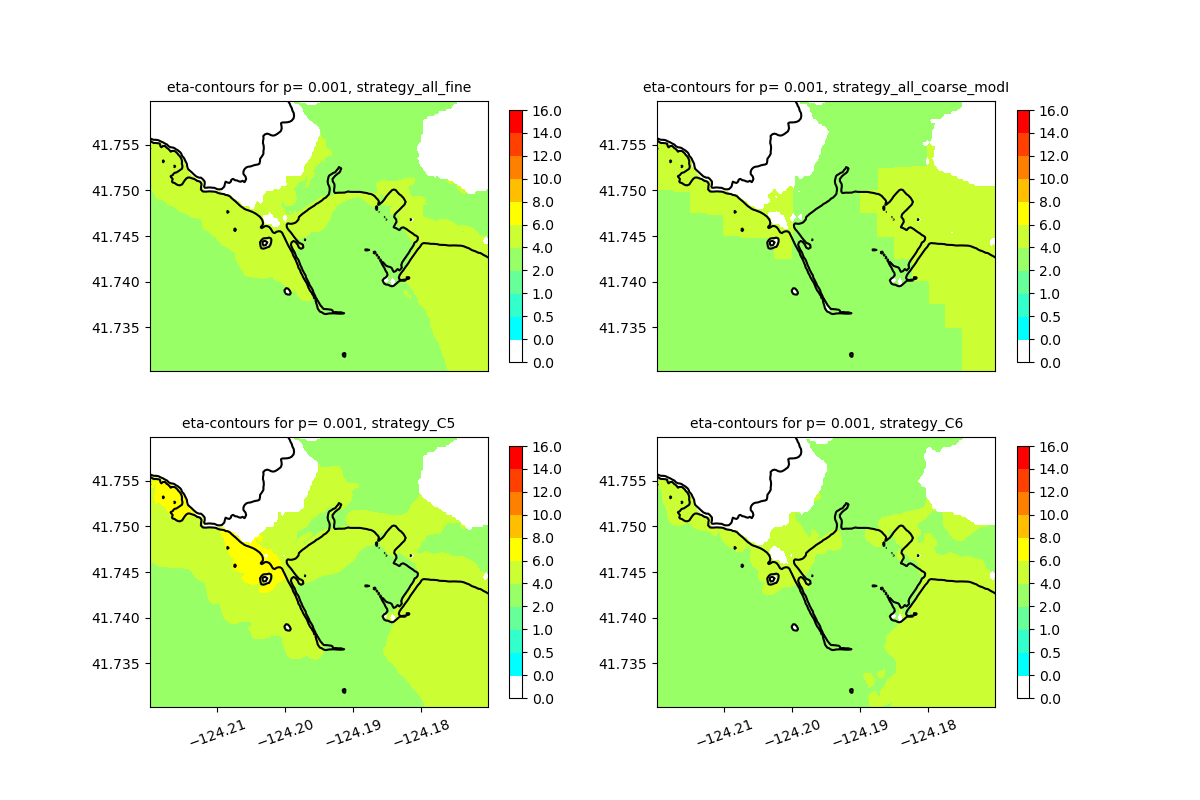
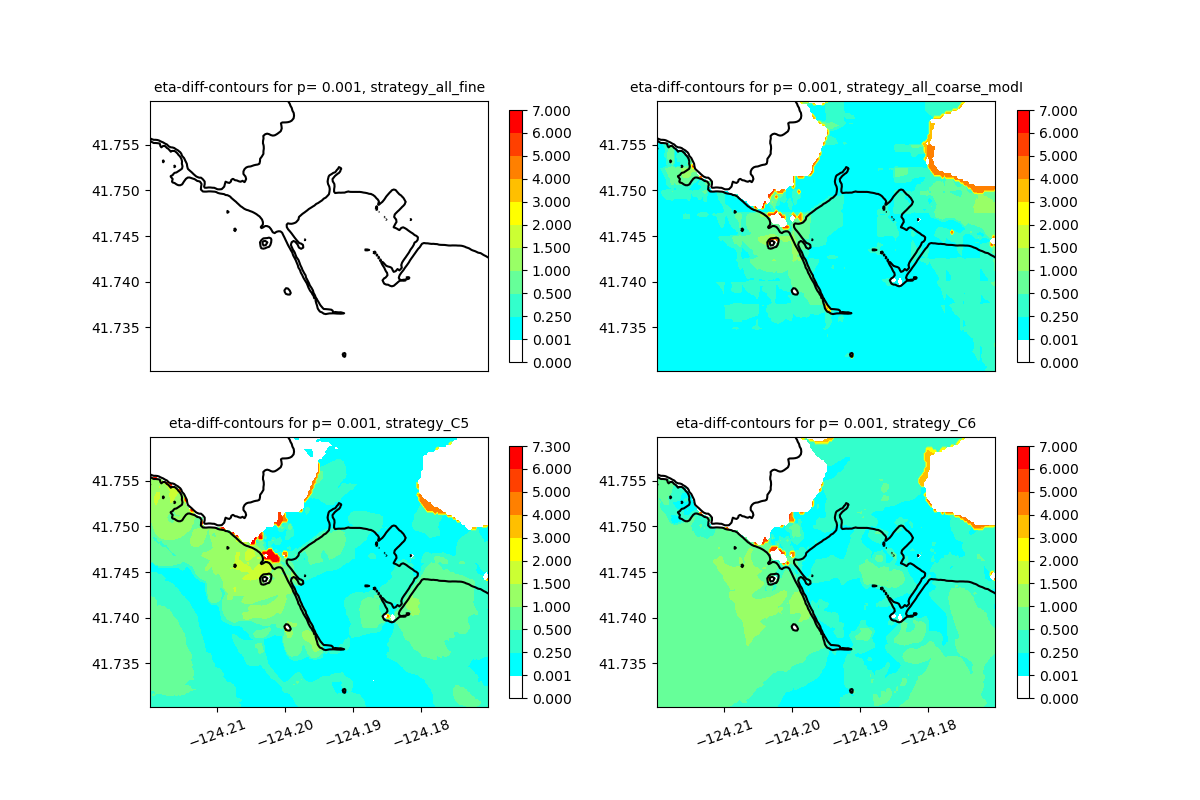
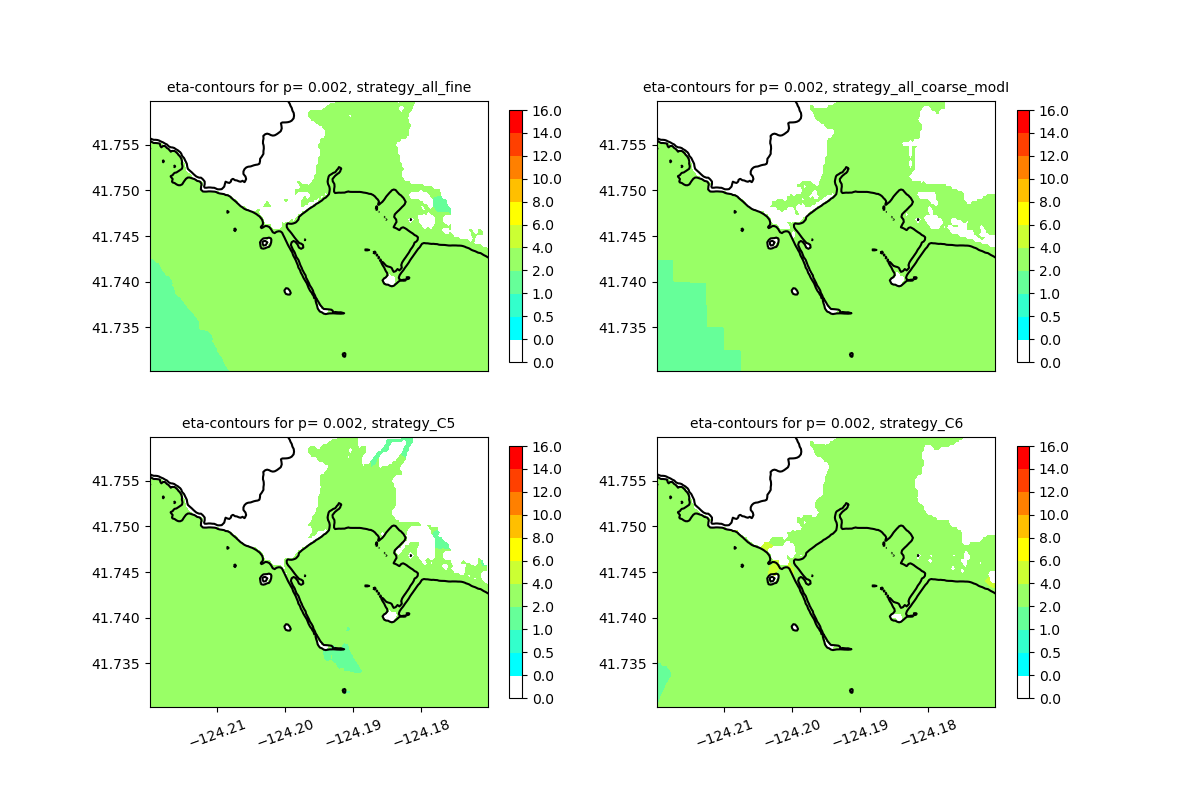
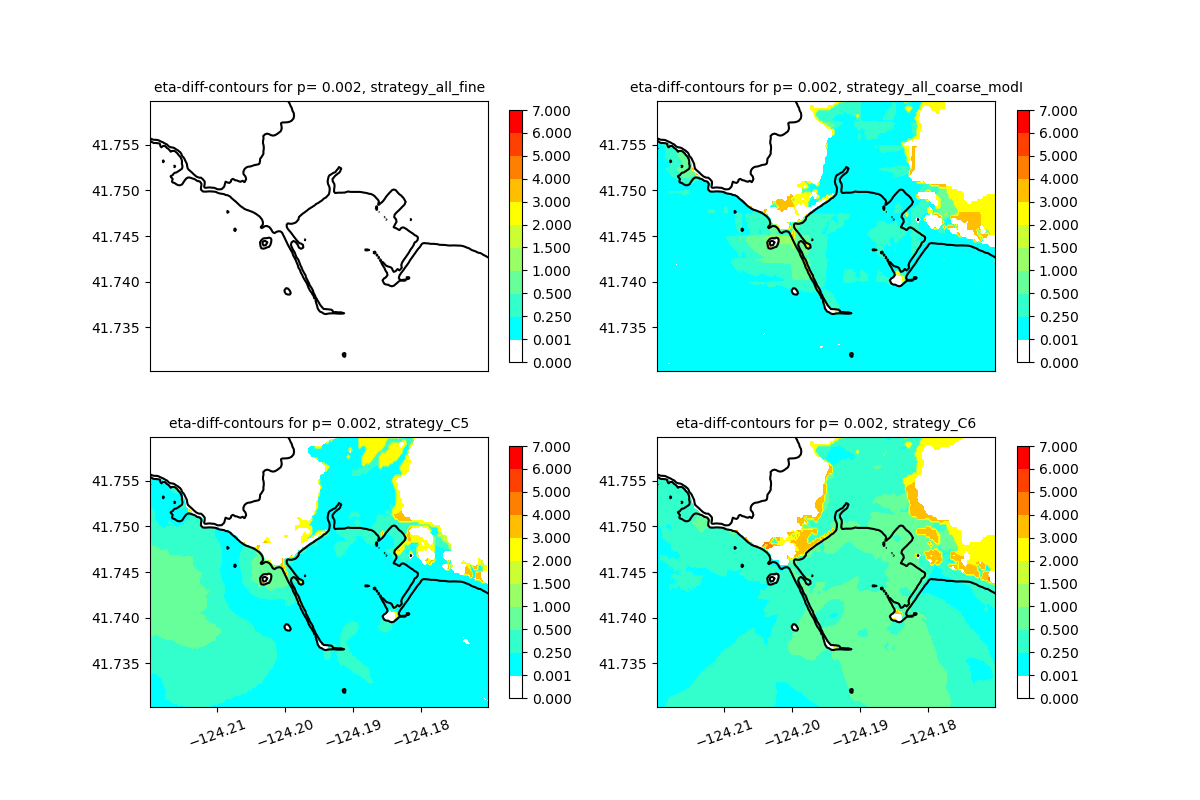
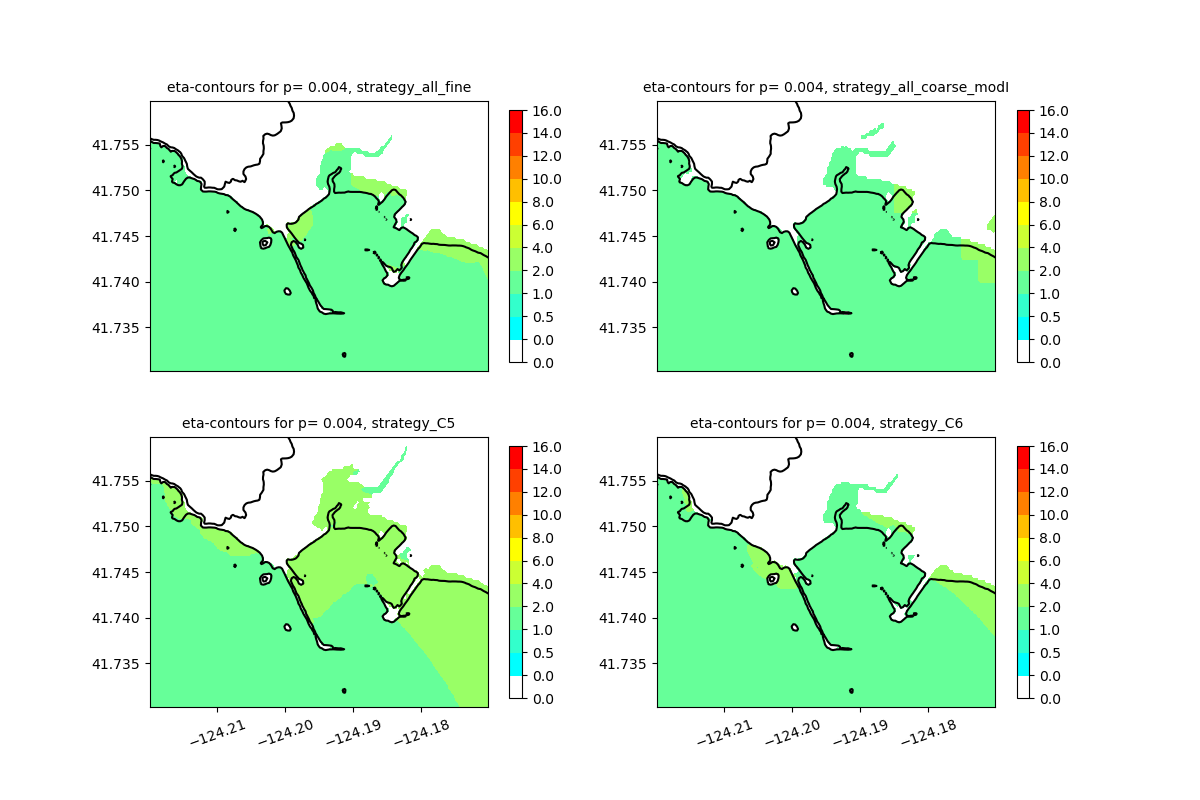
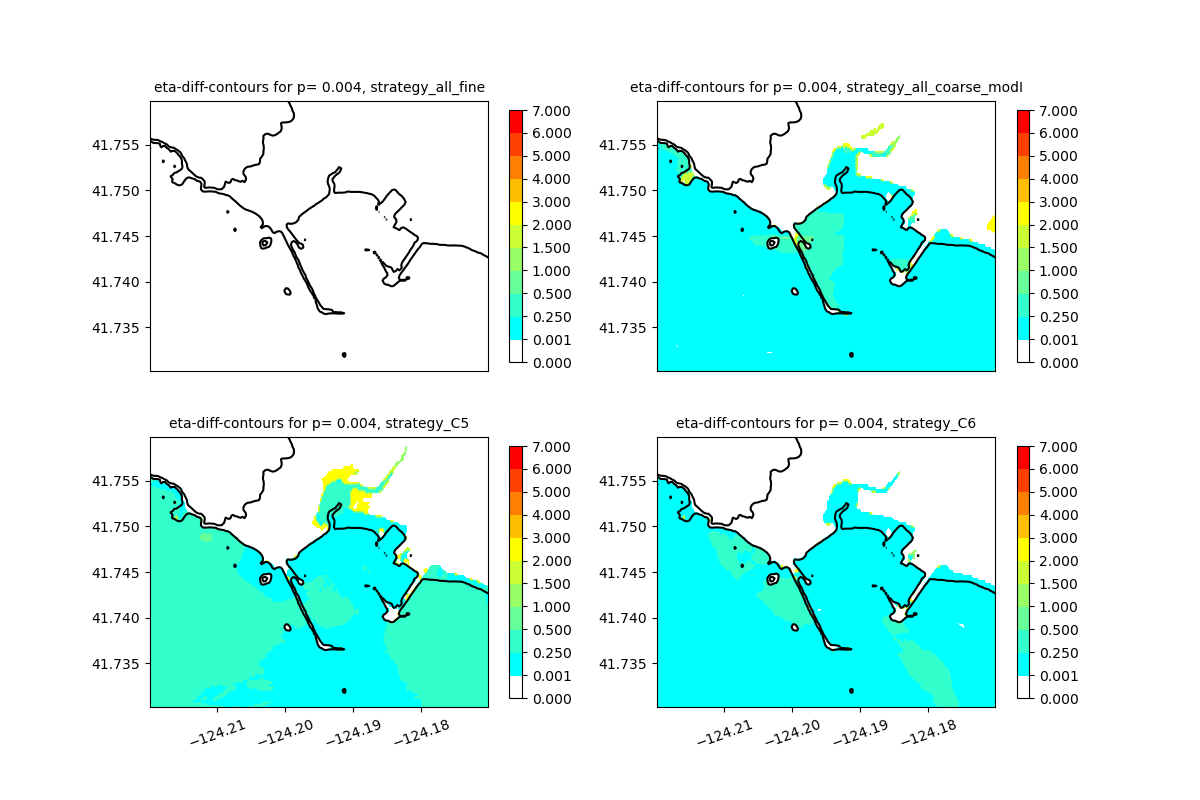
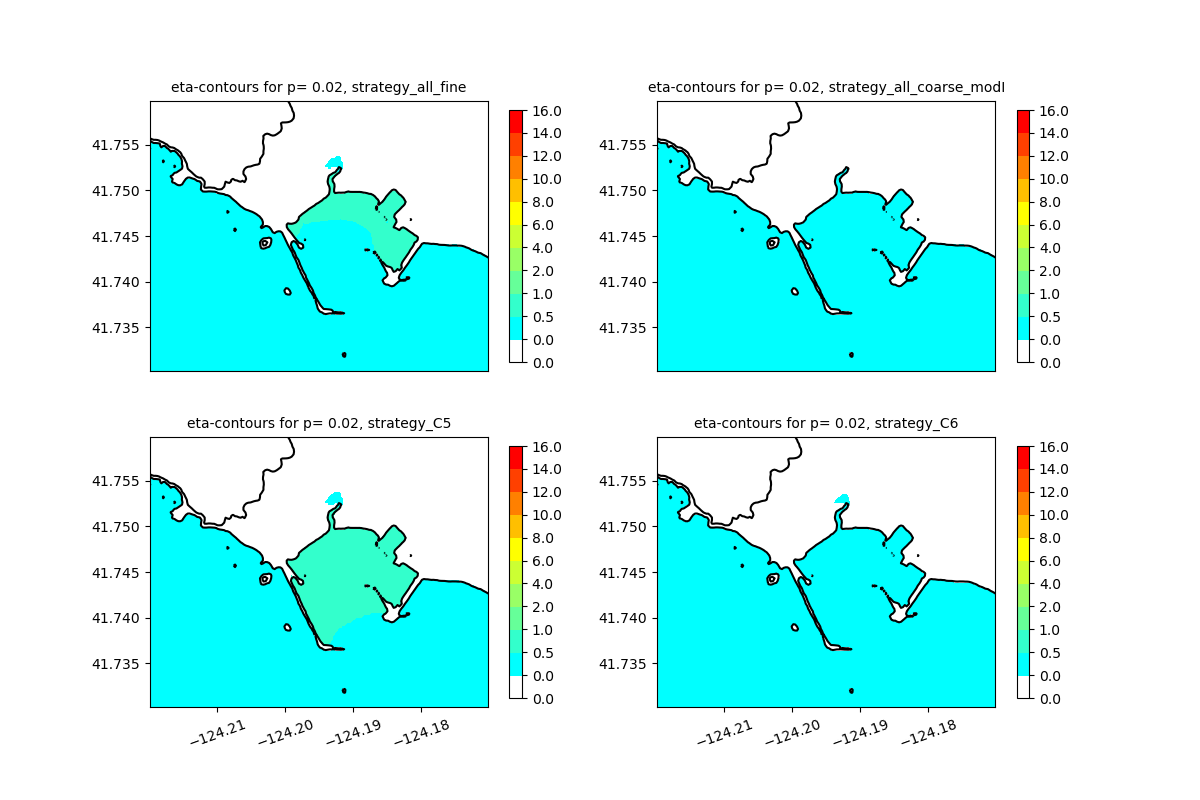
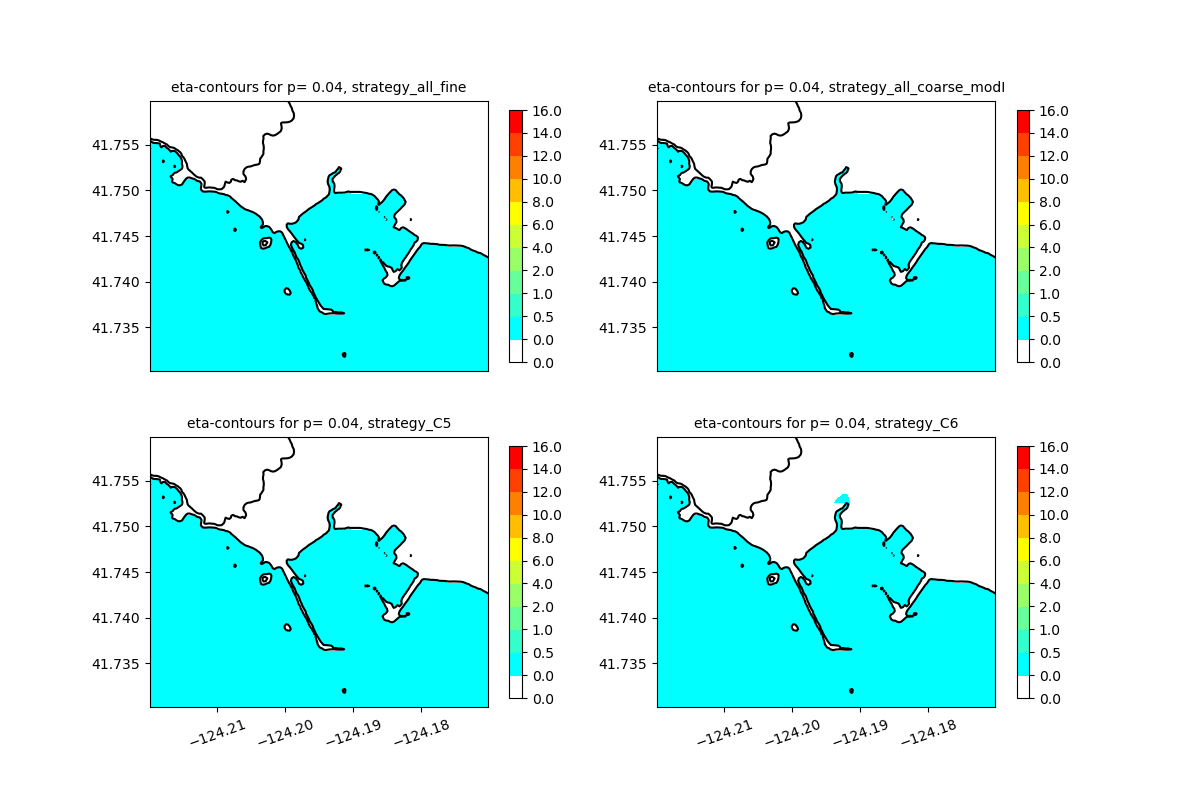
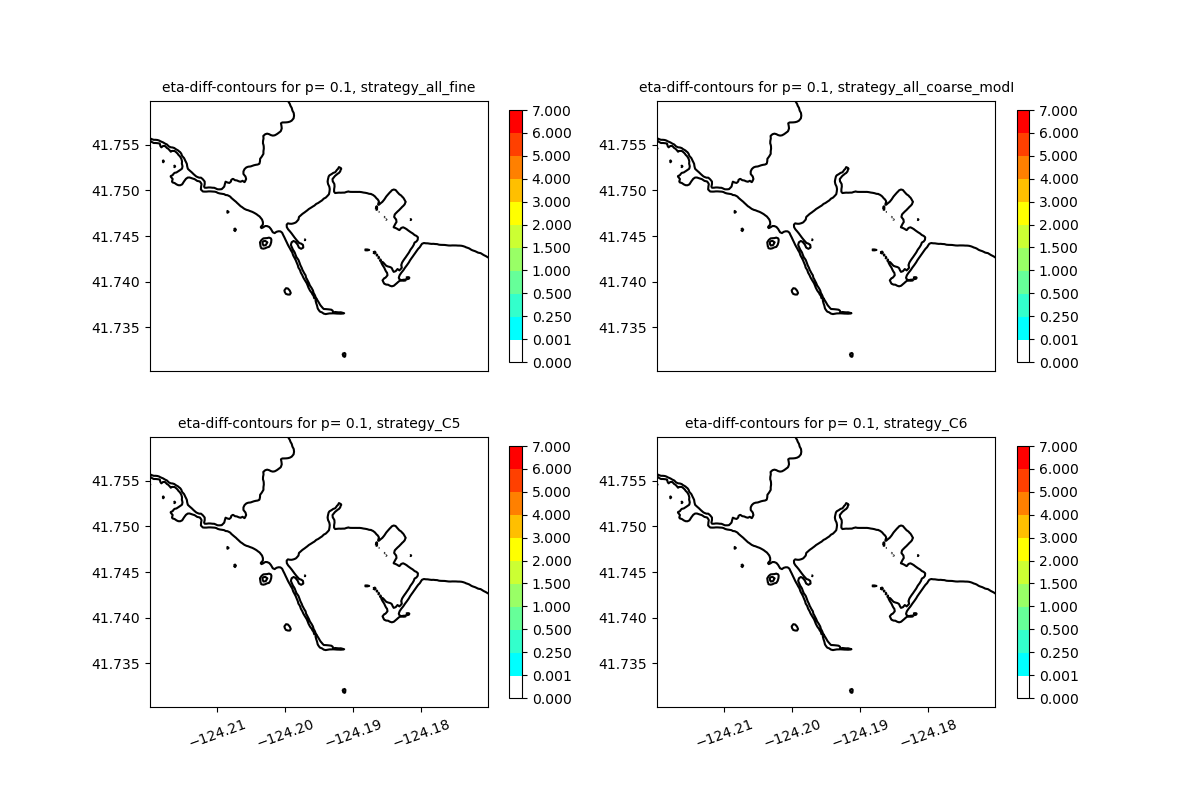
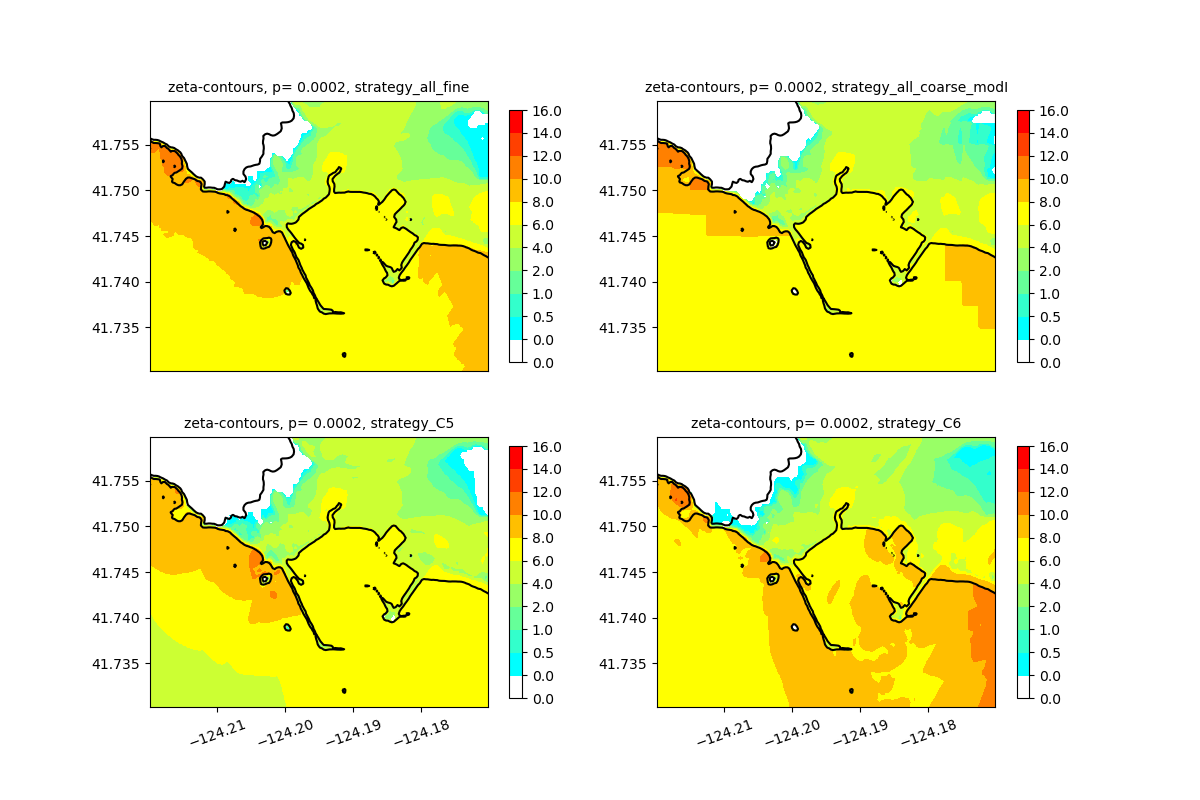
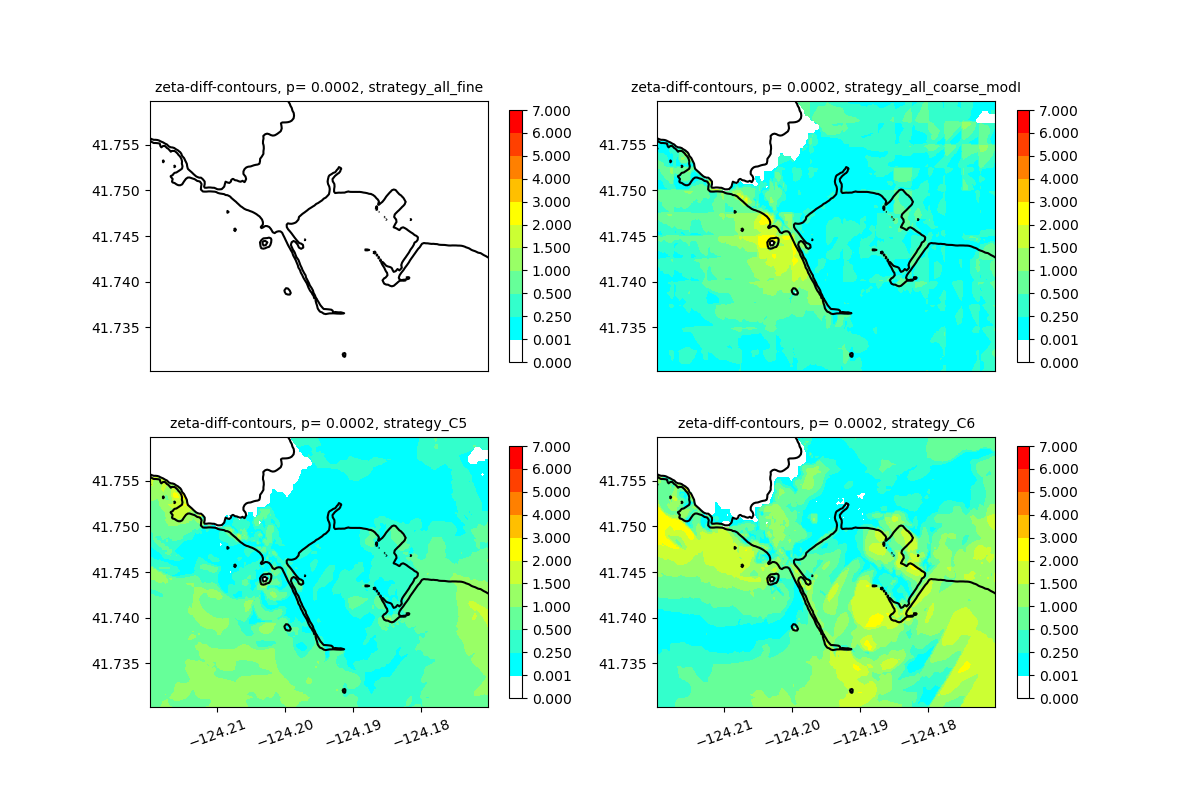
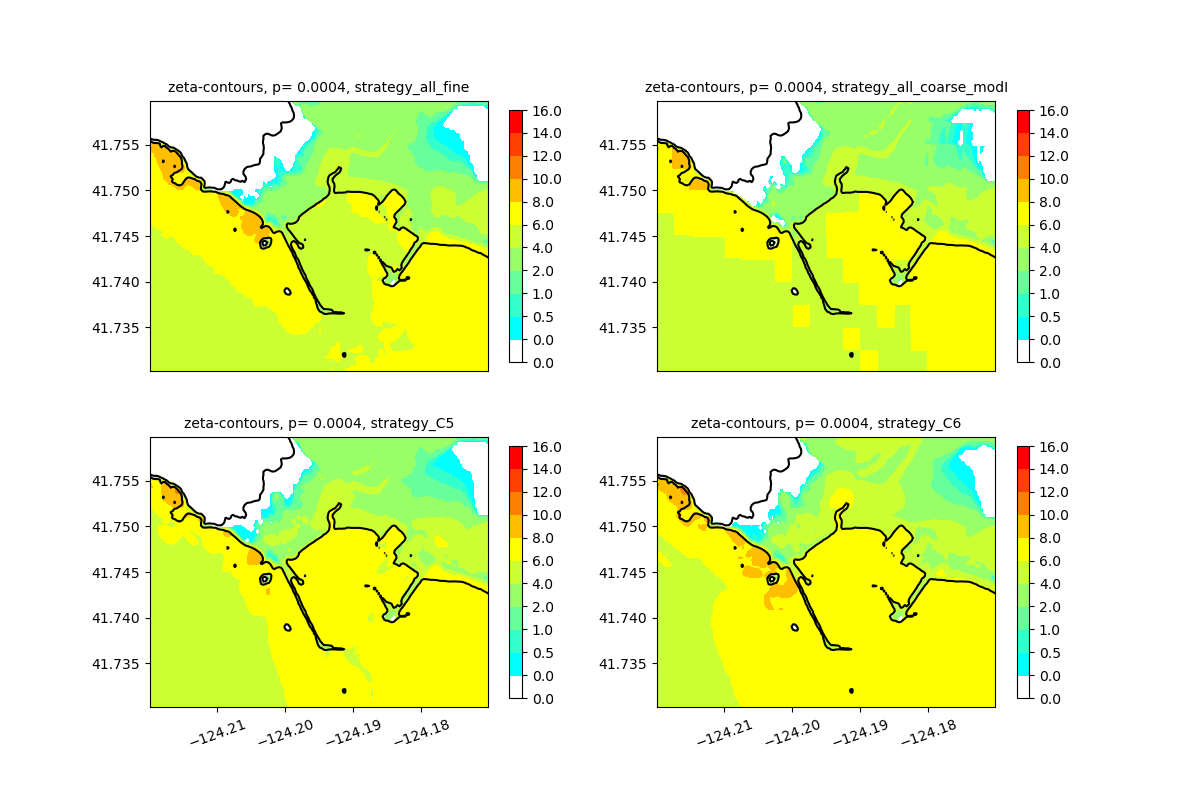
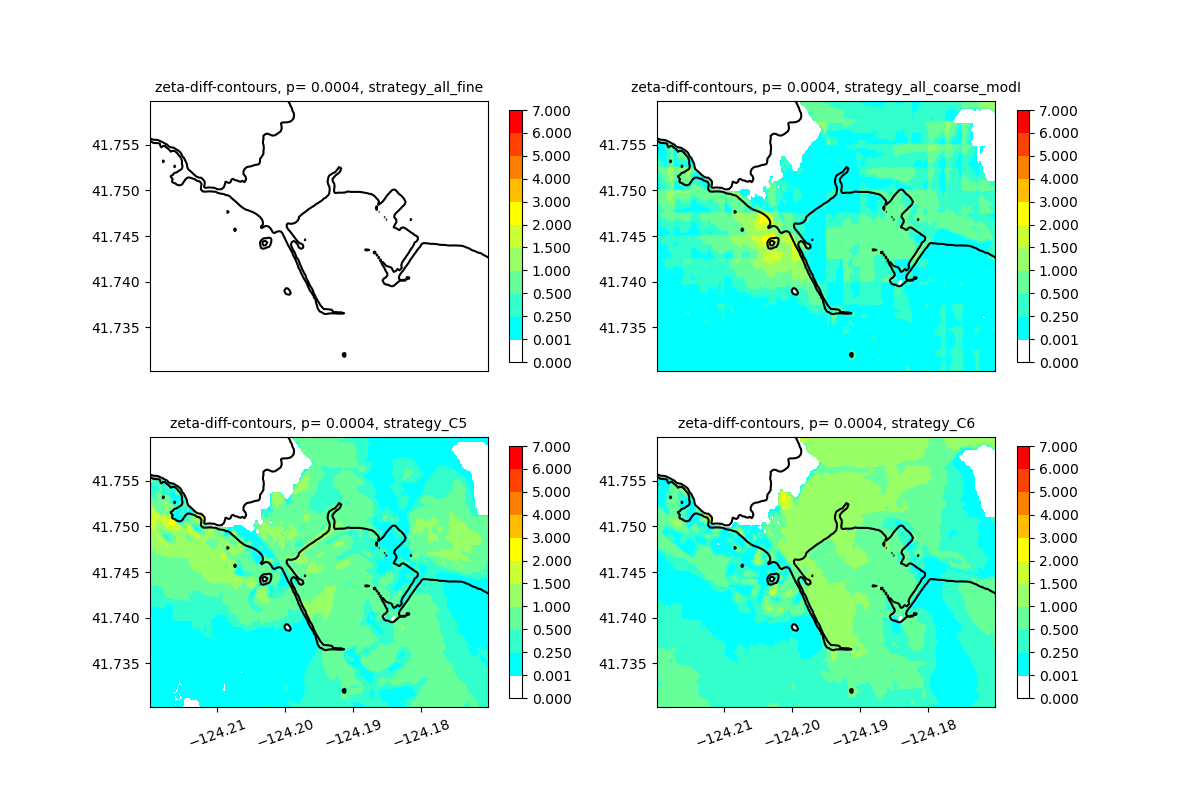
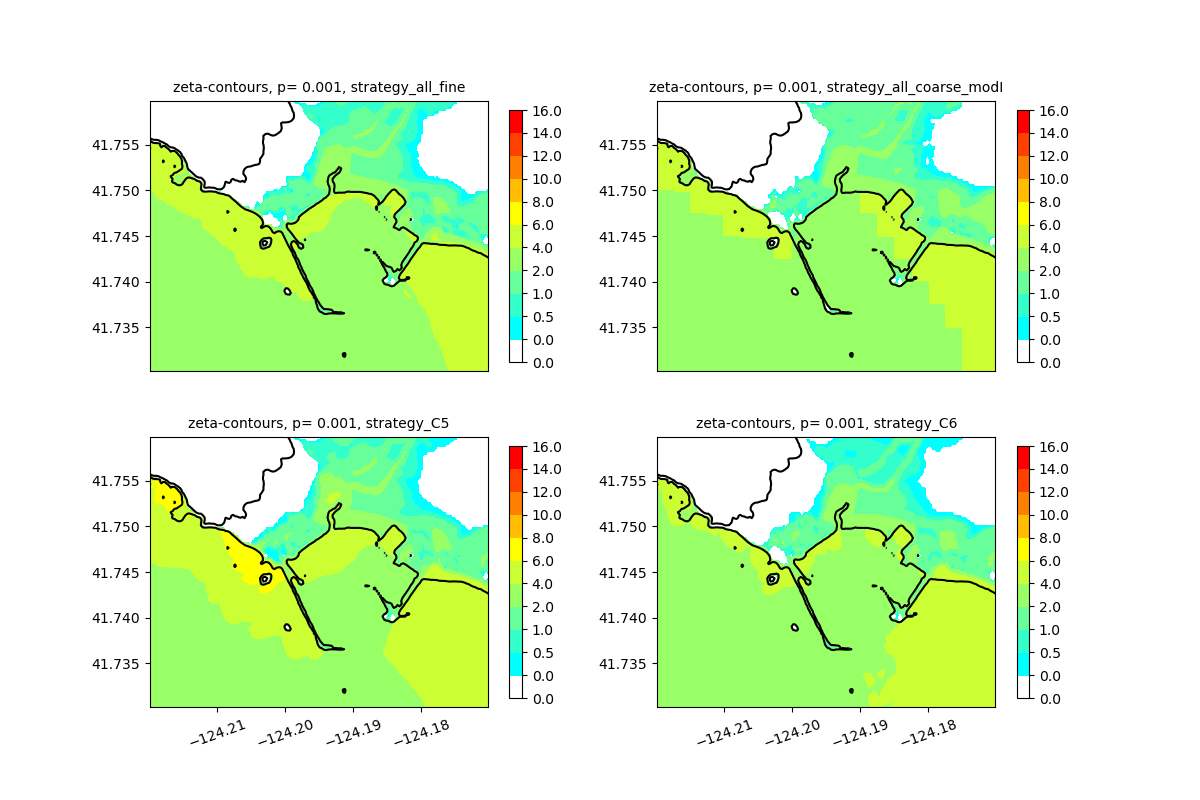
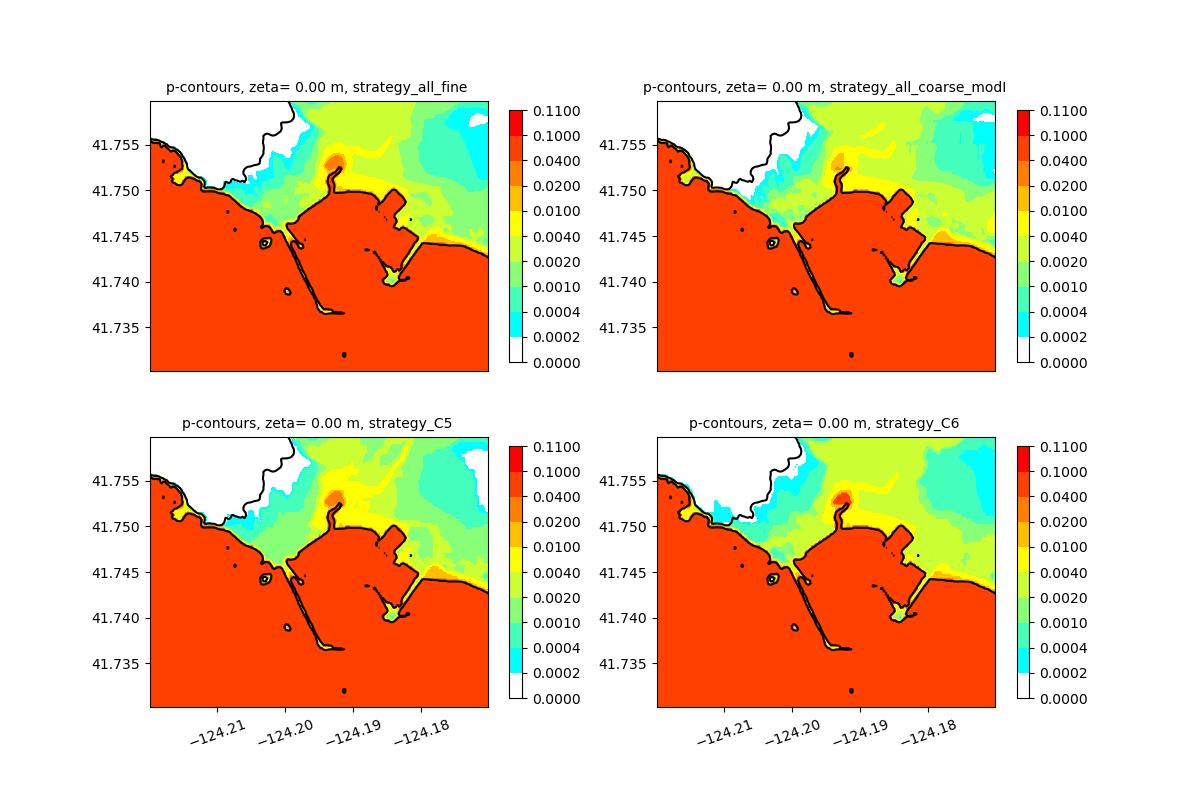
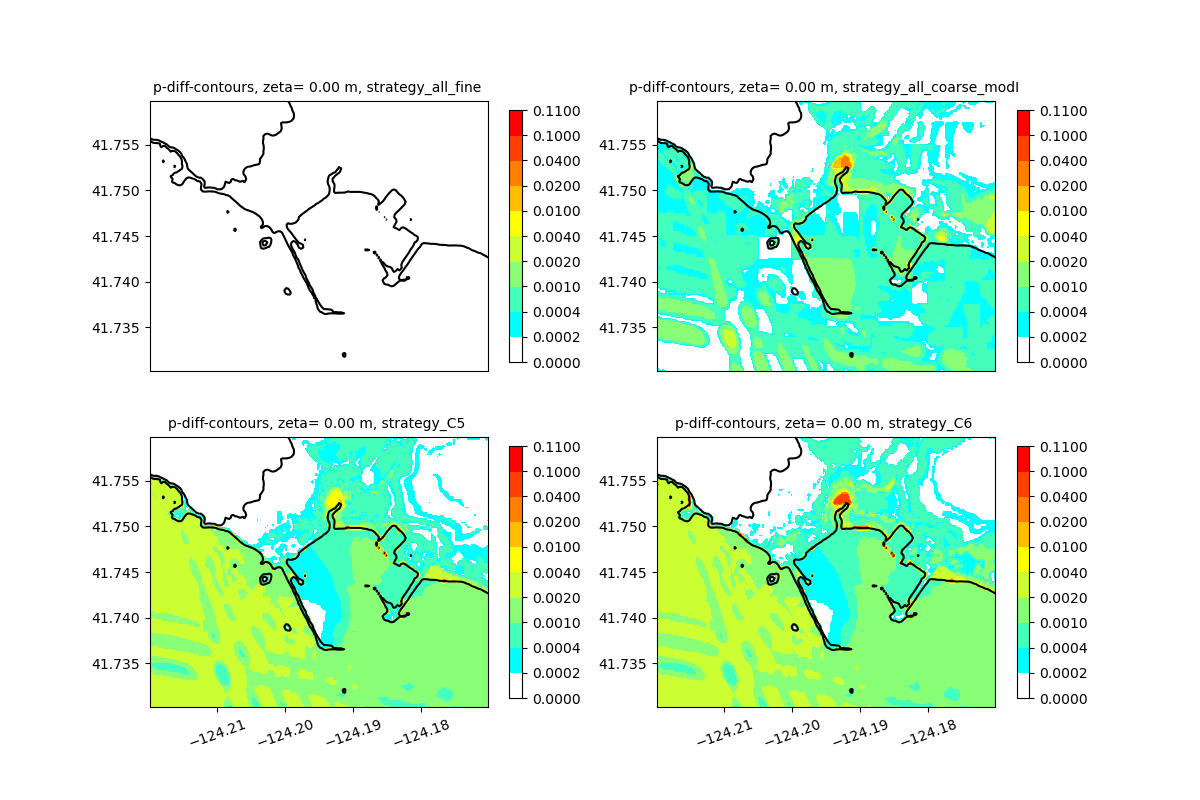
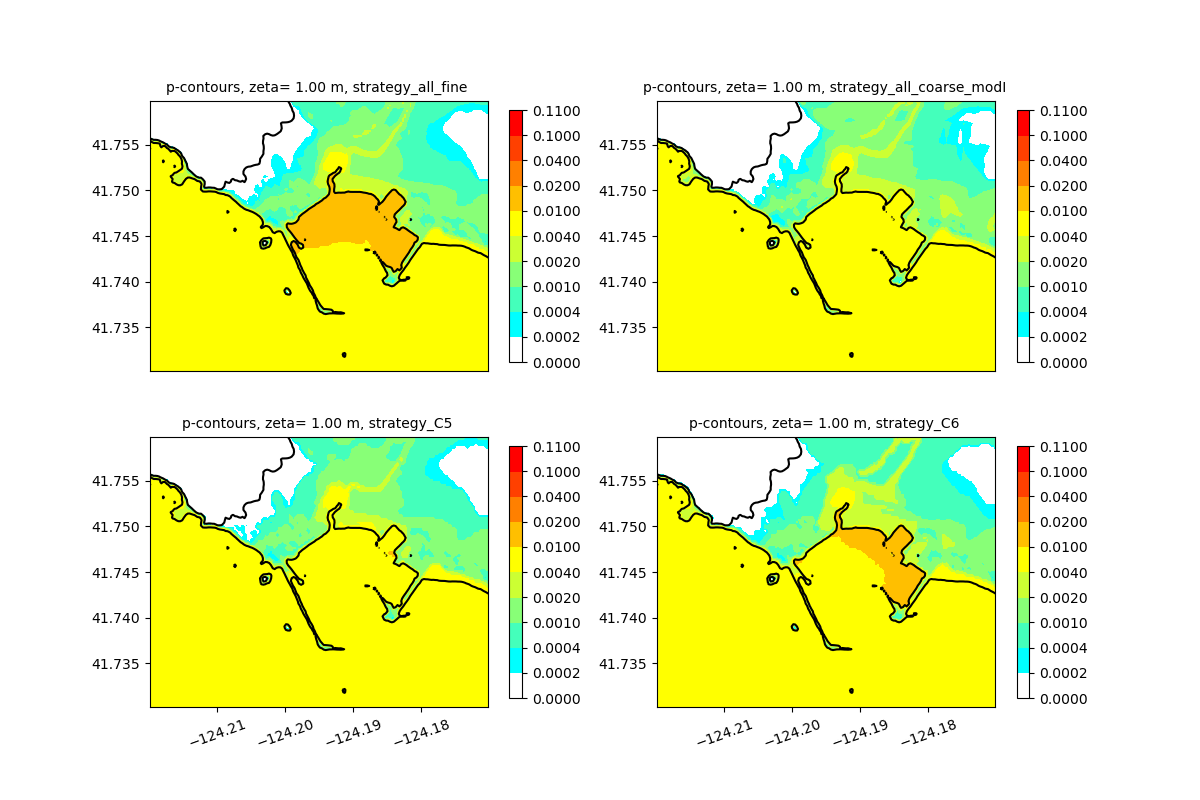
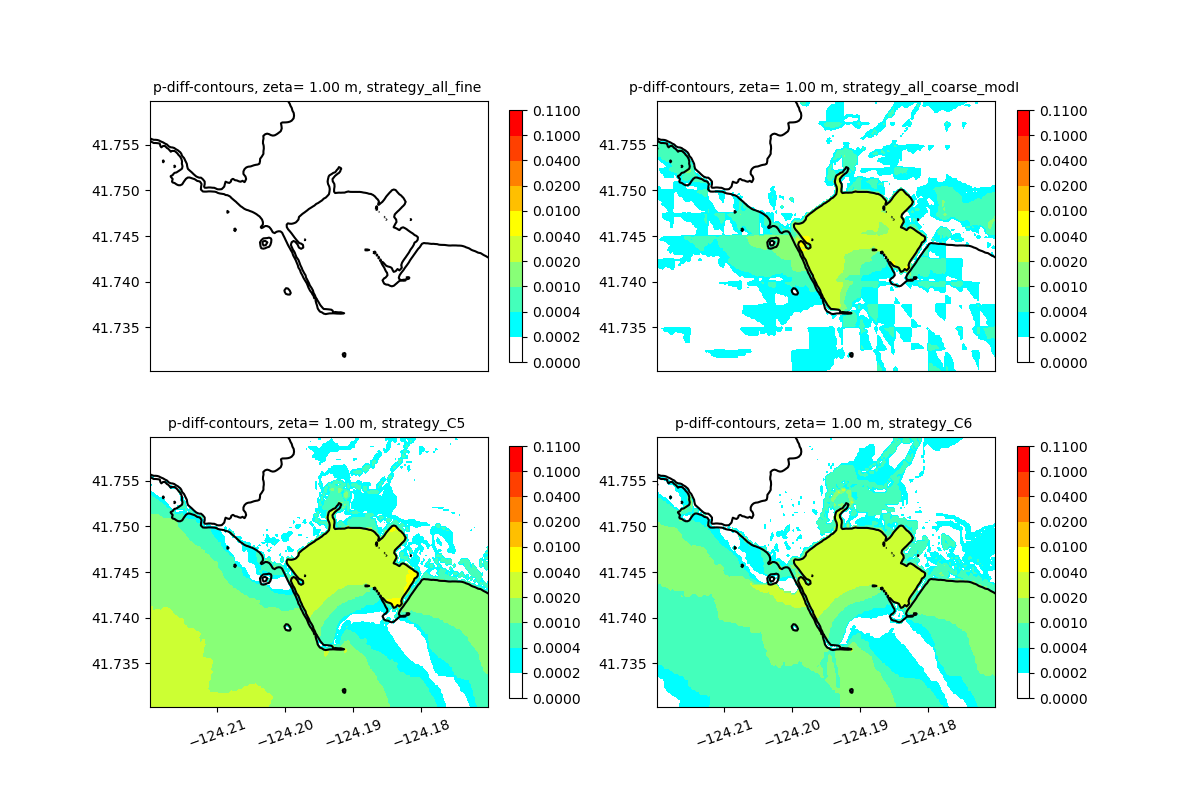
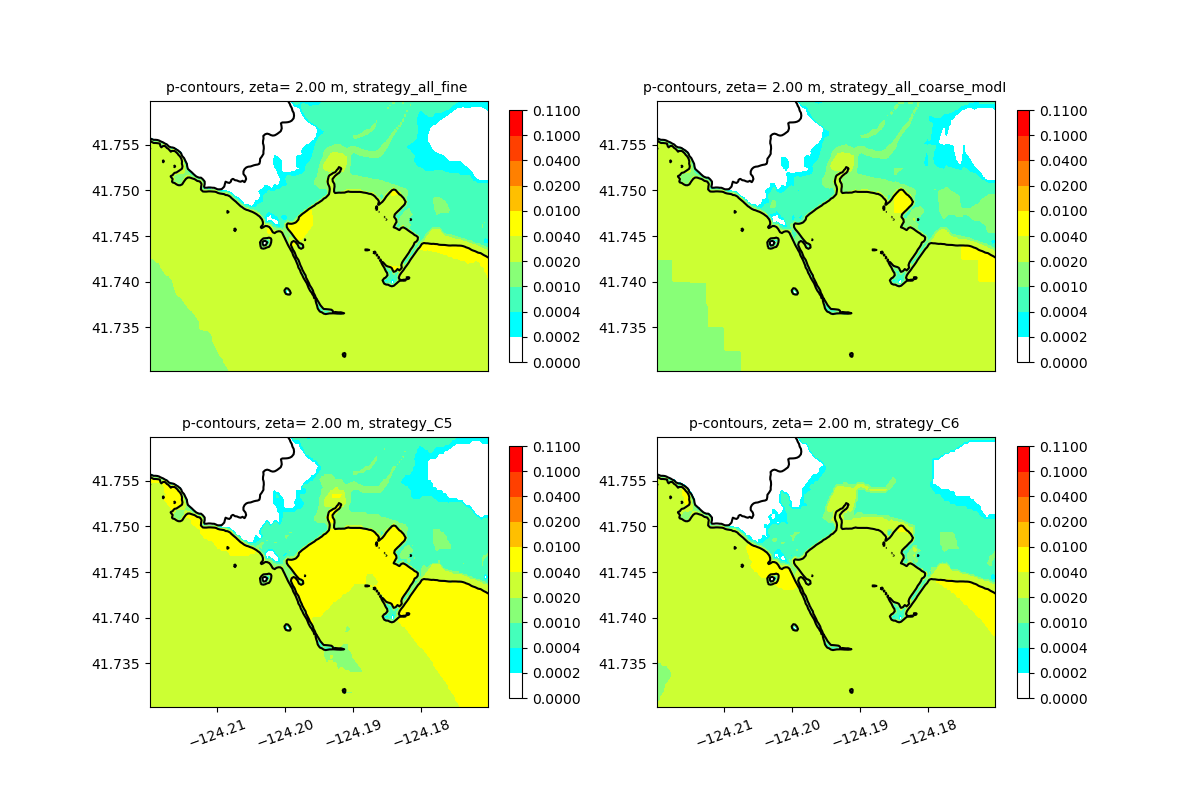
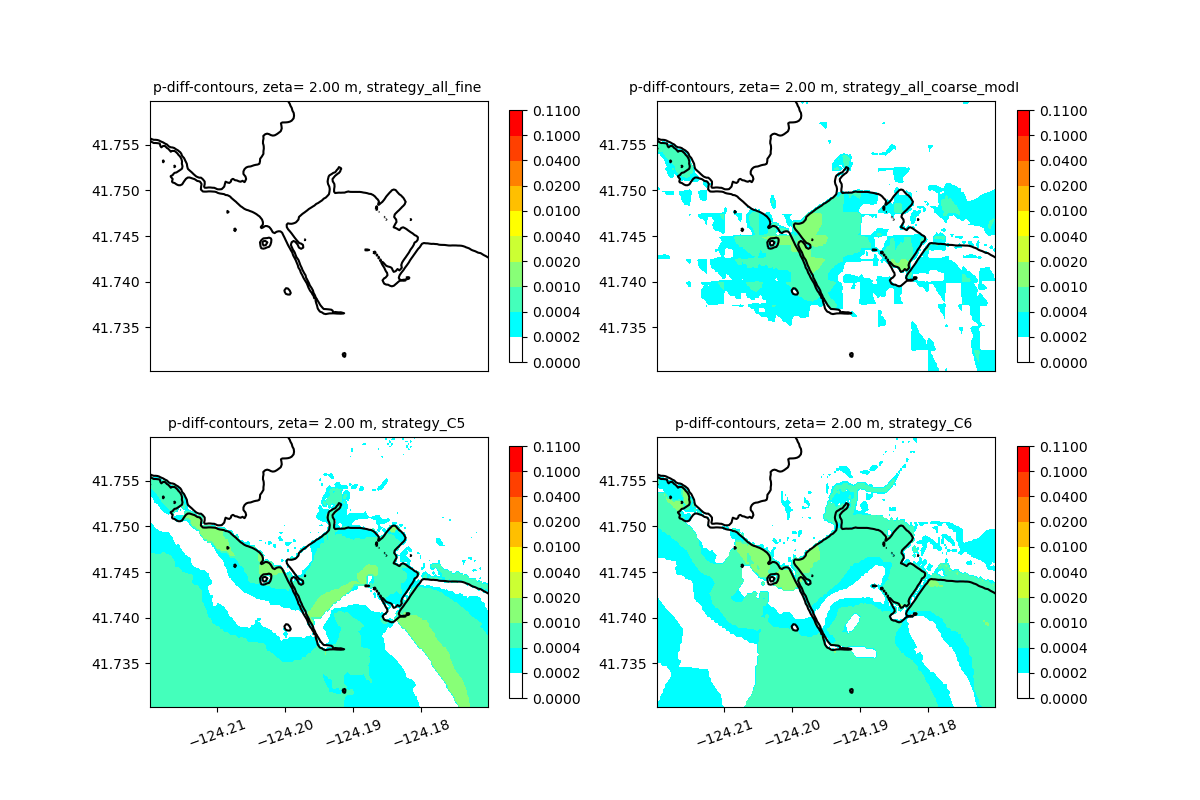
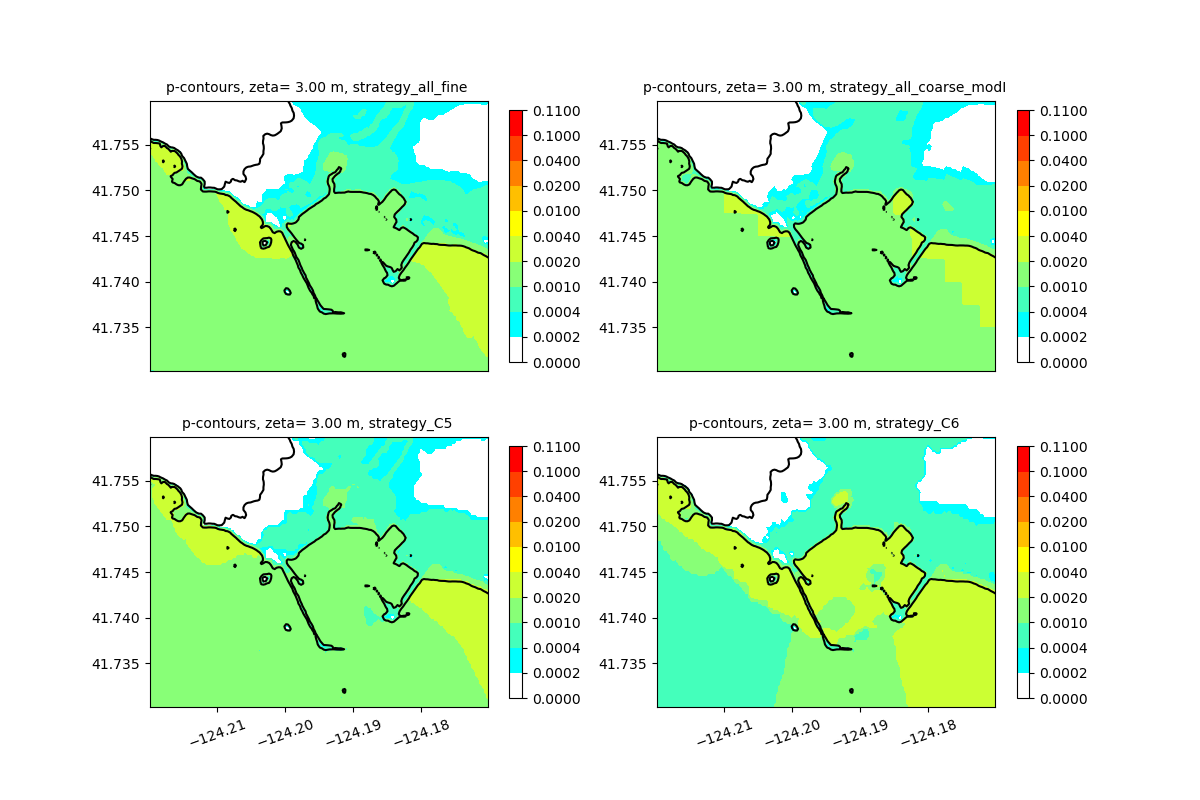
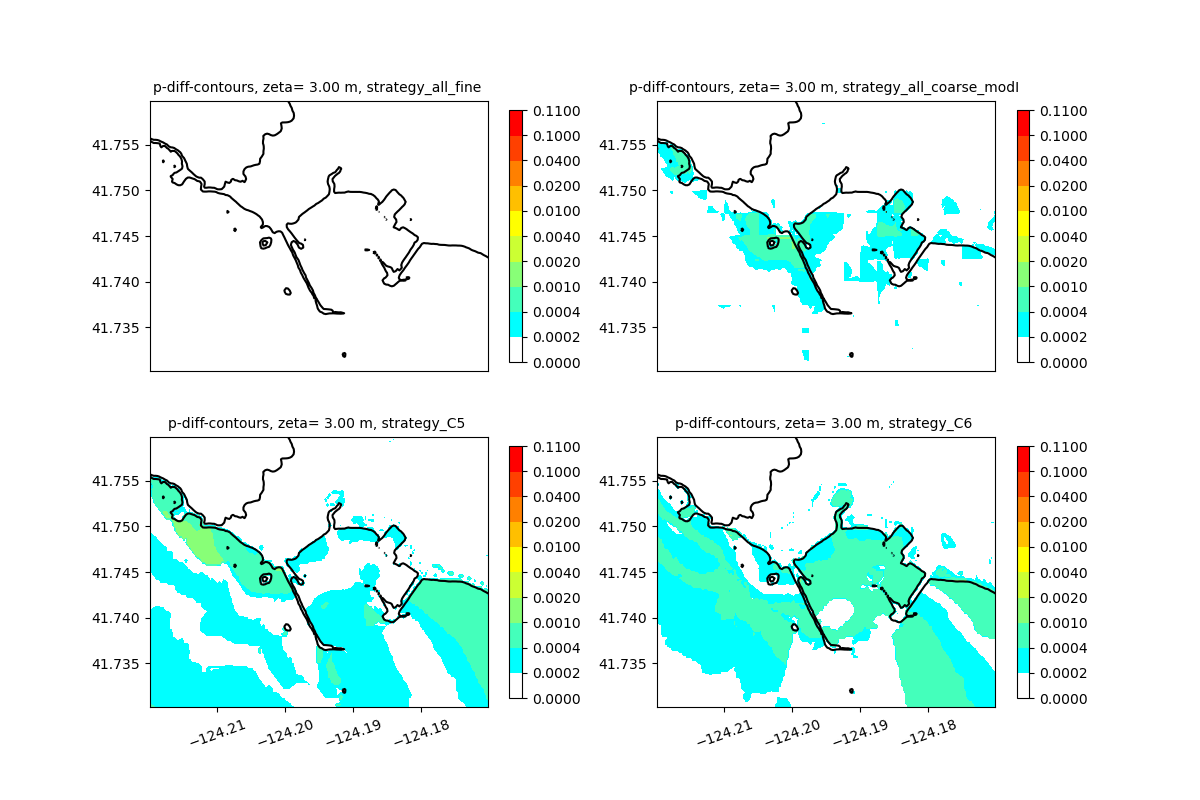
Plan view plots
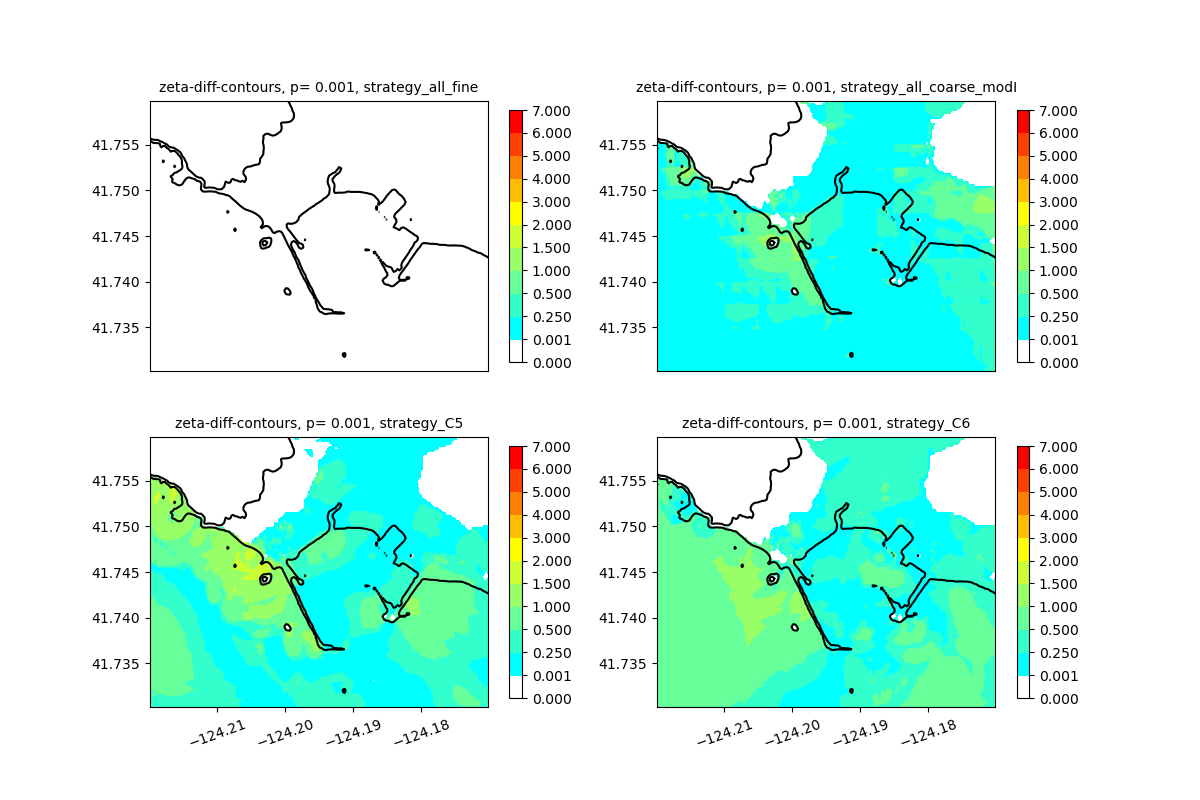
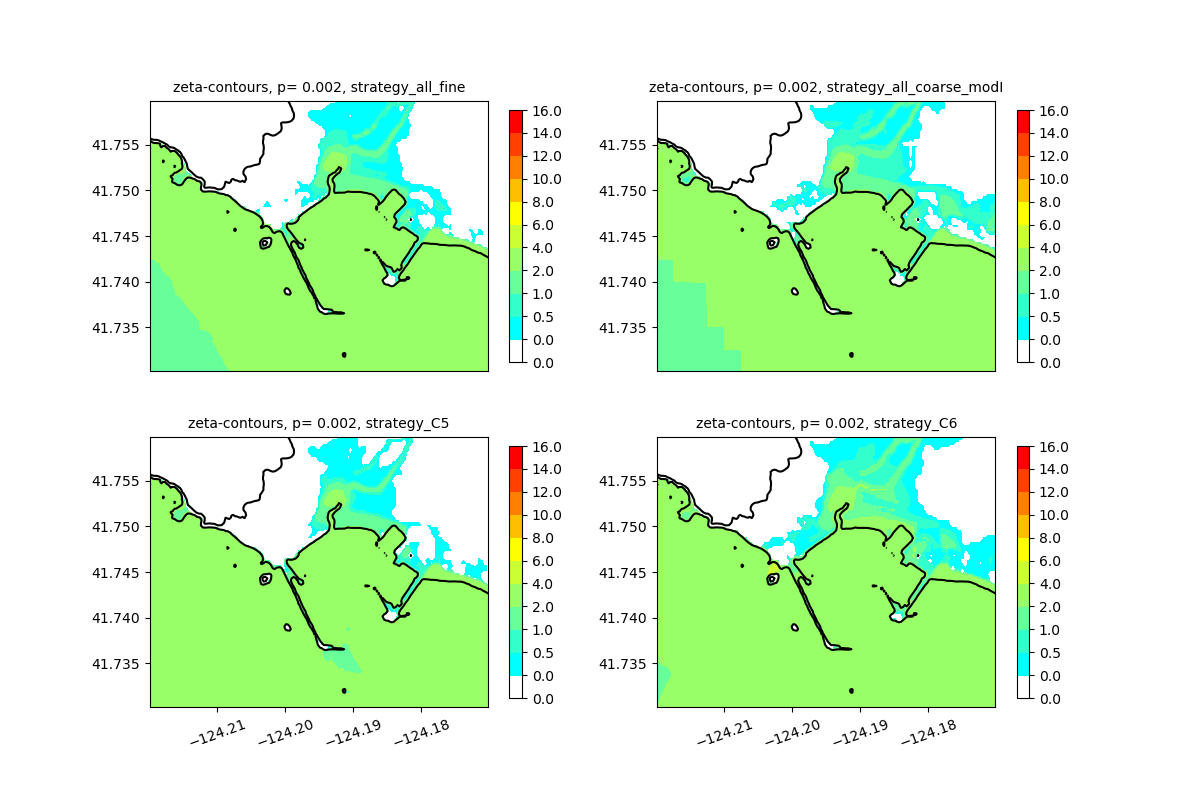
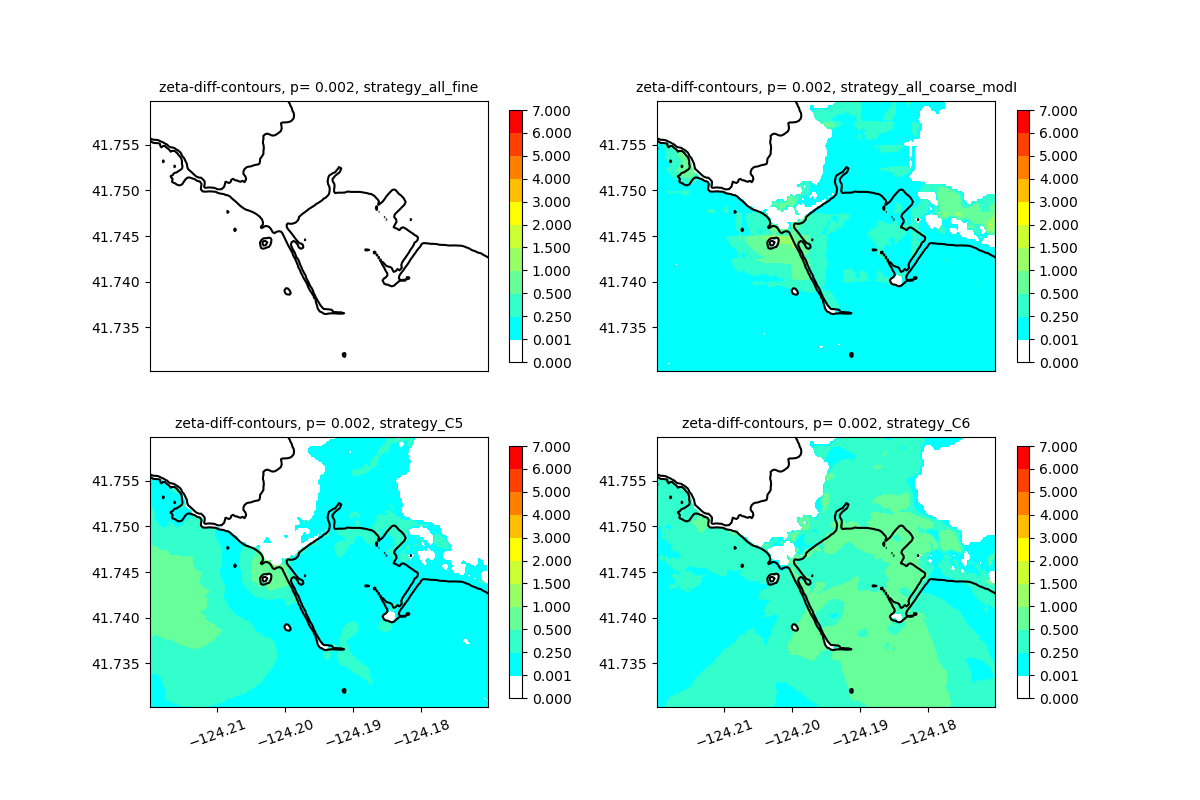
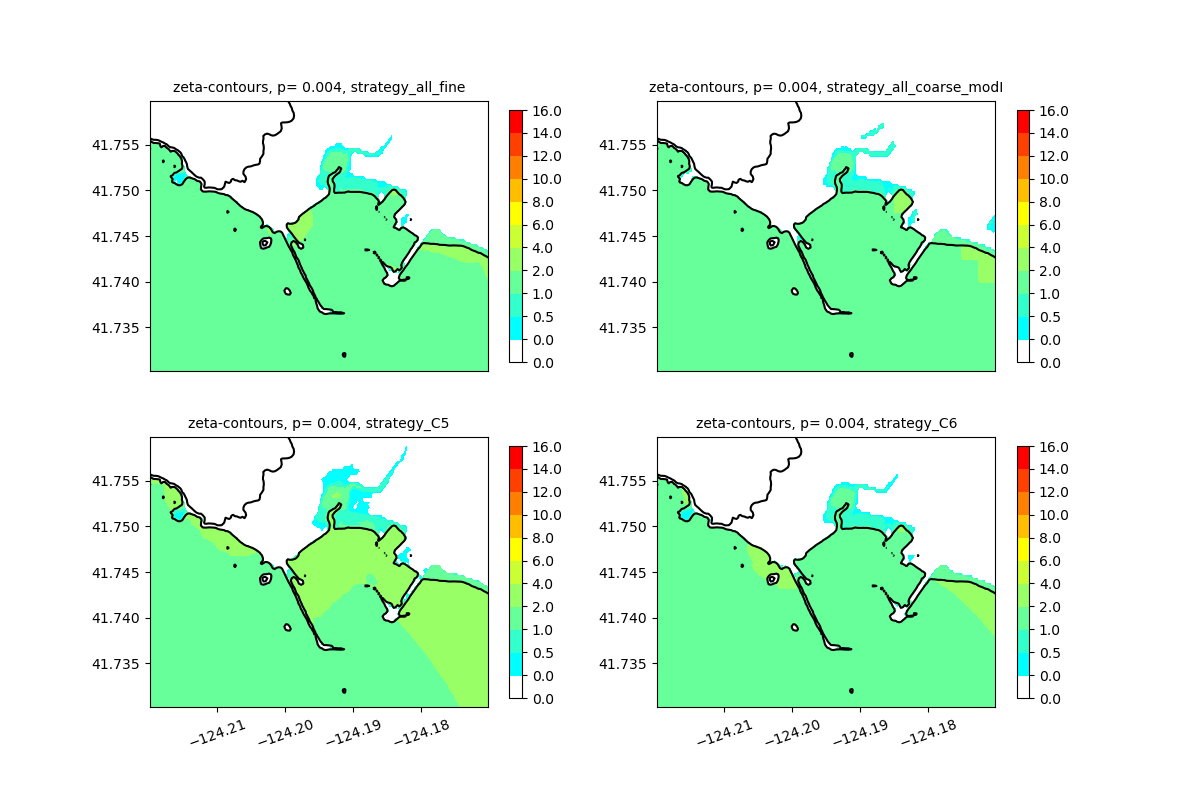
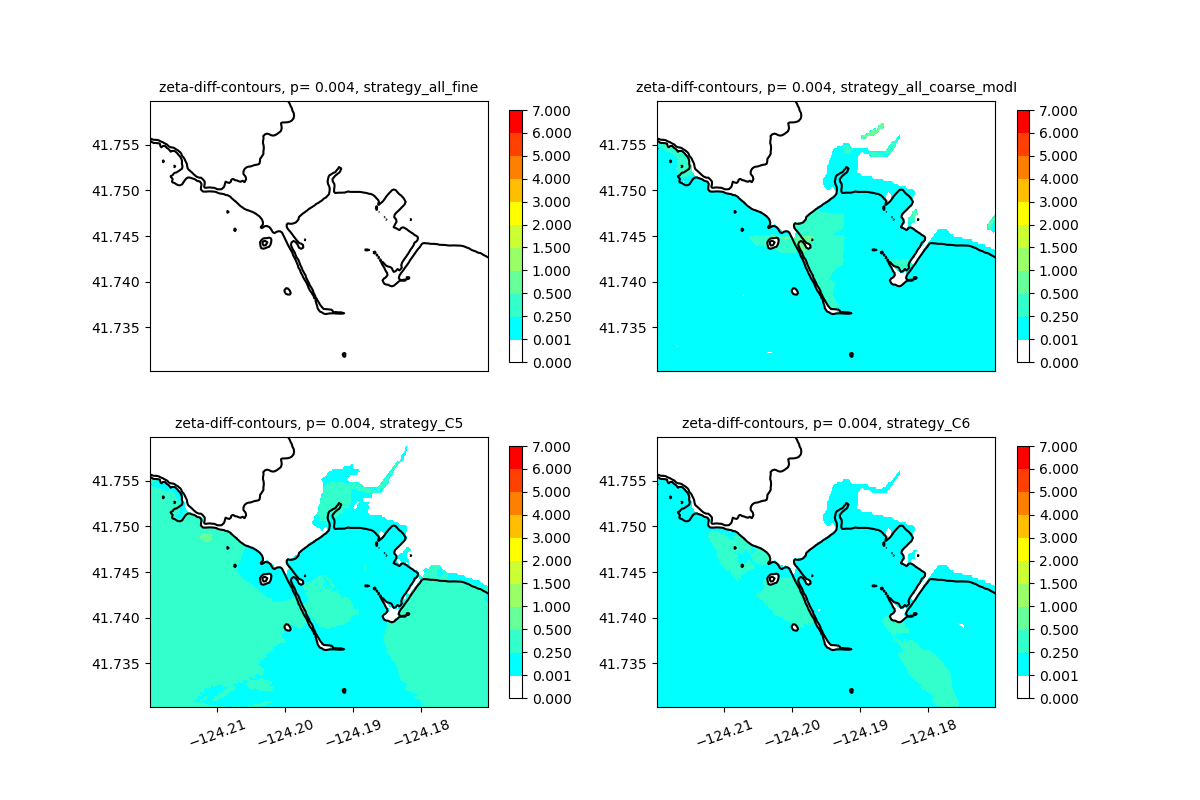
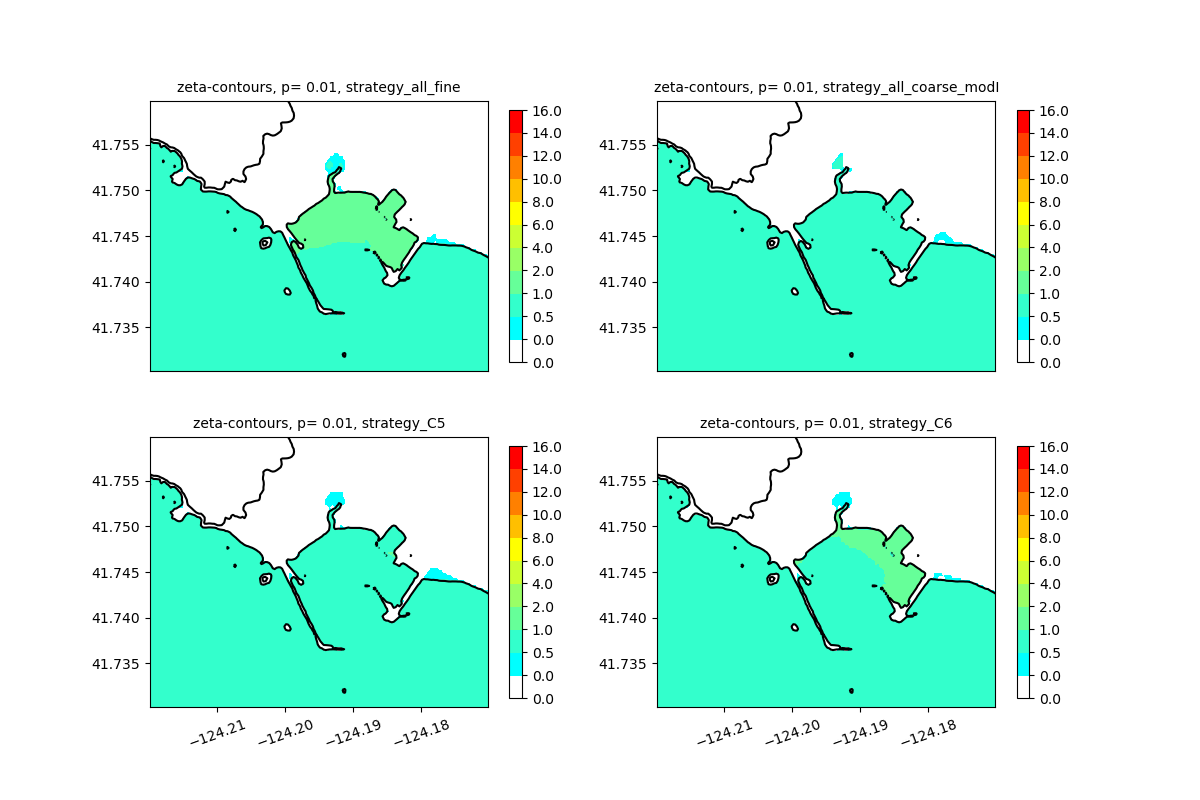
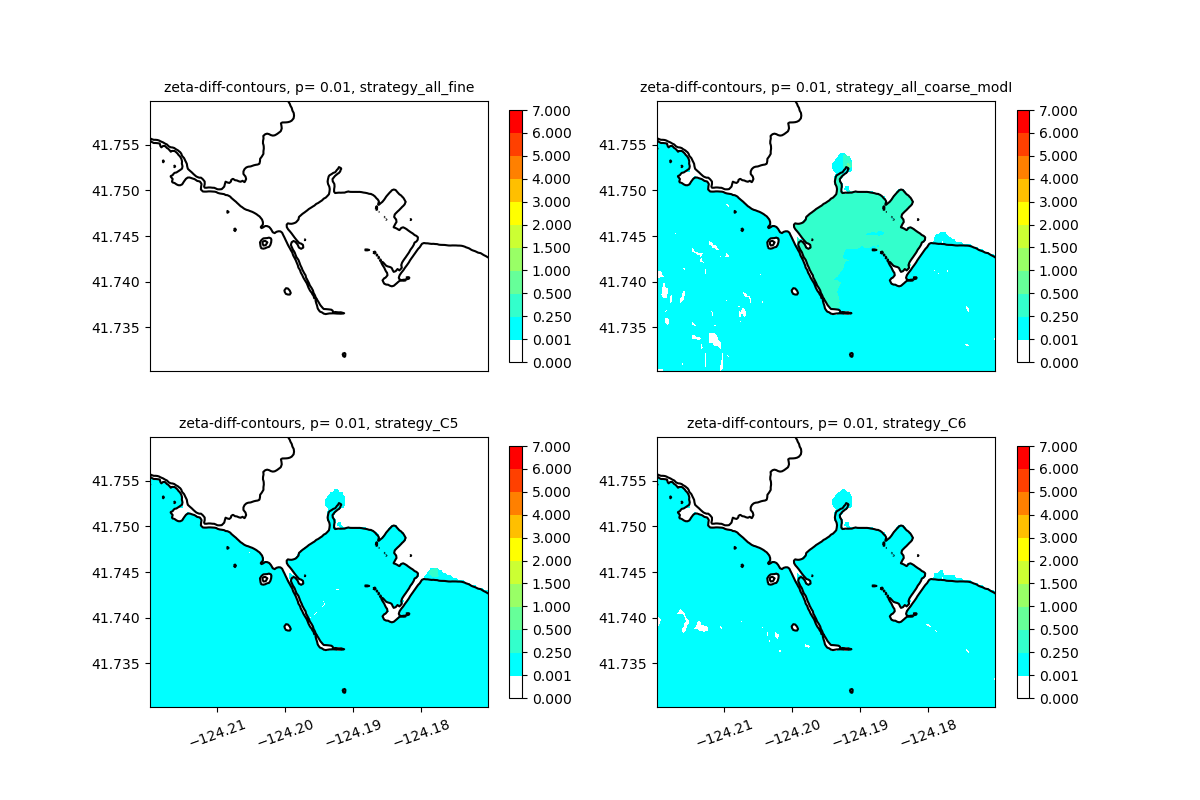
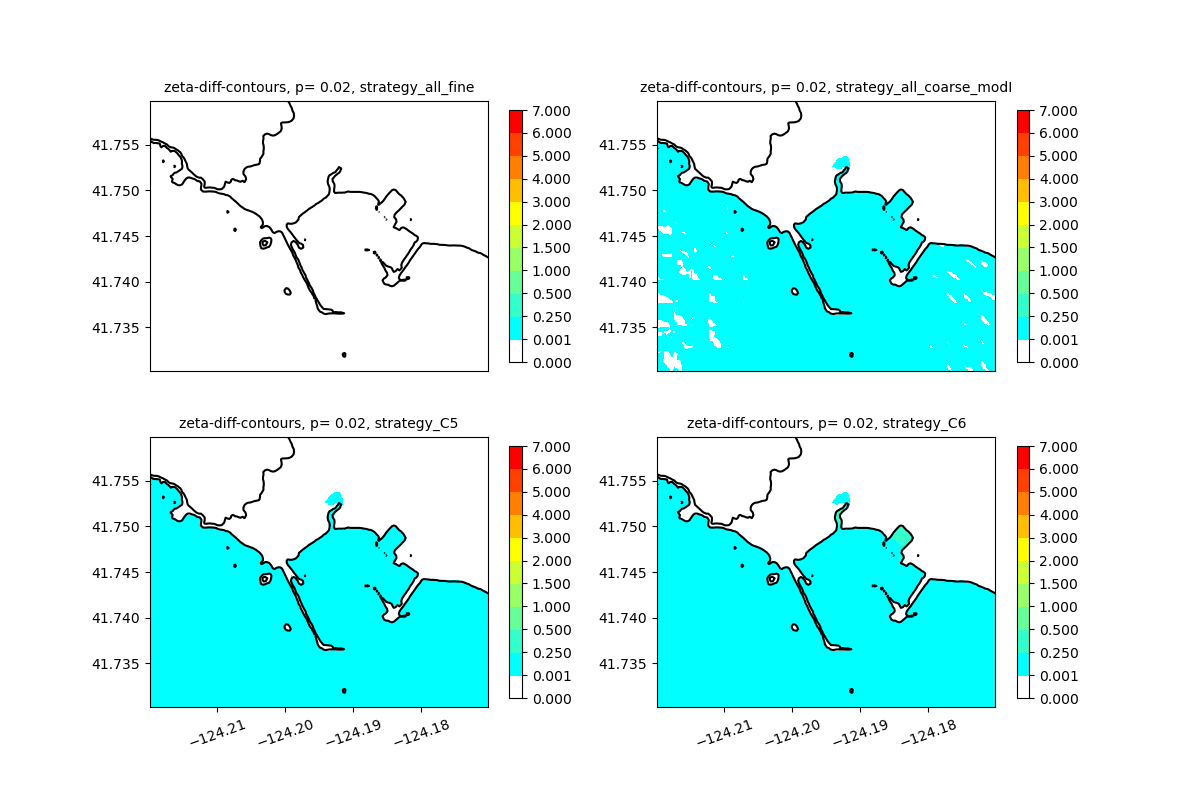
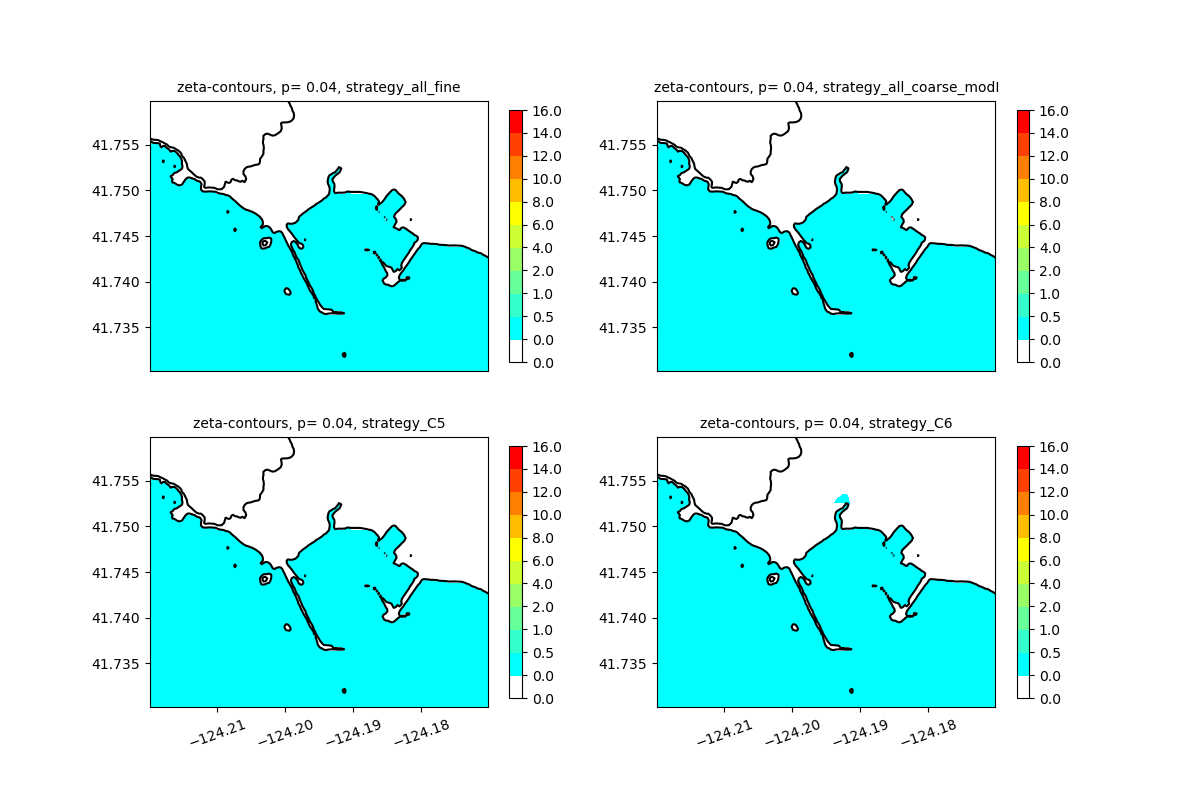
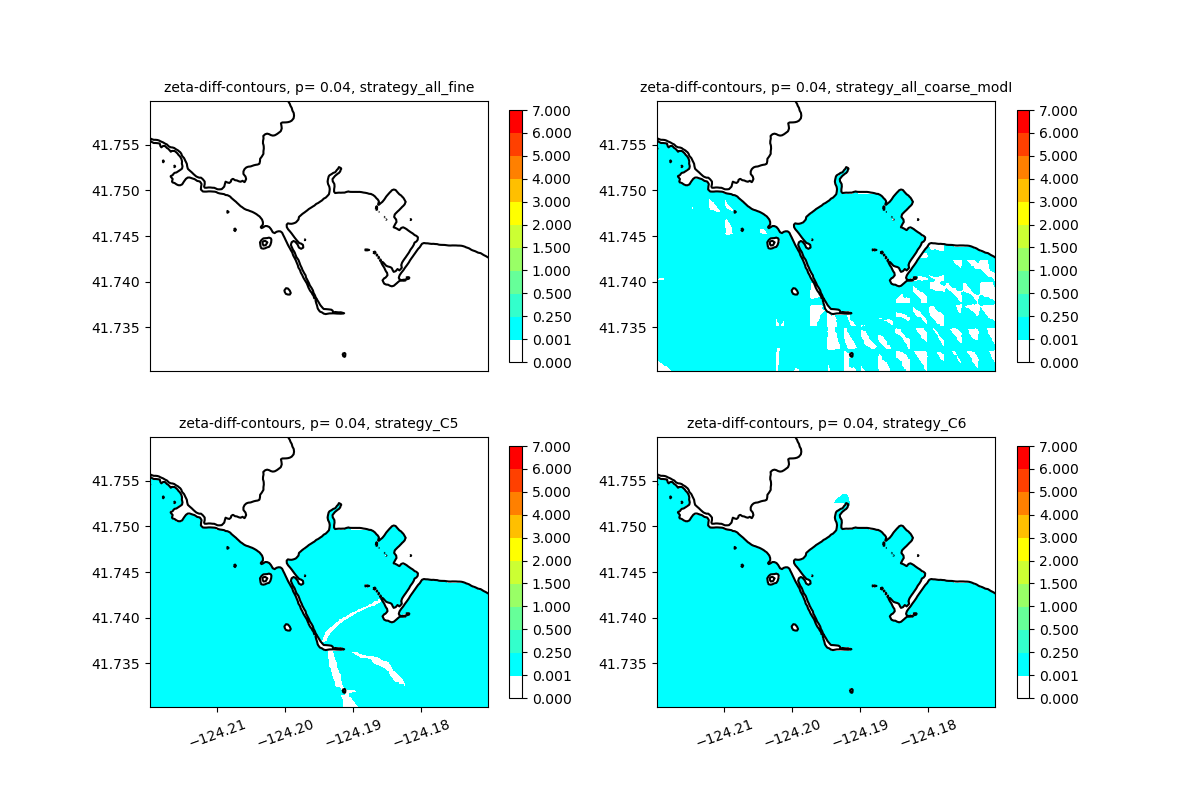
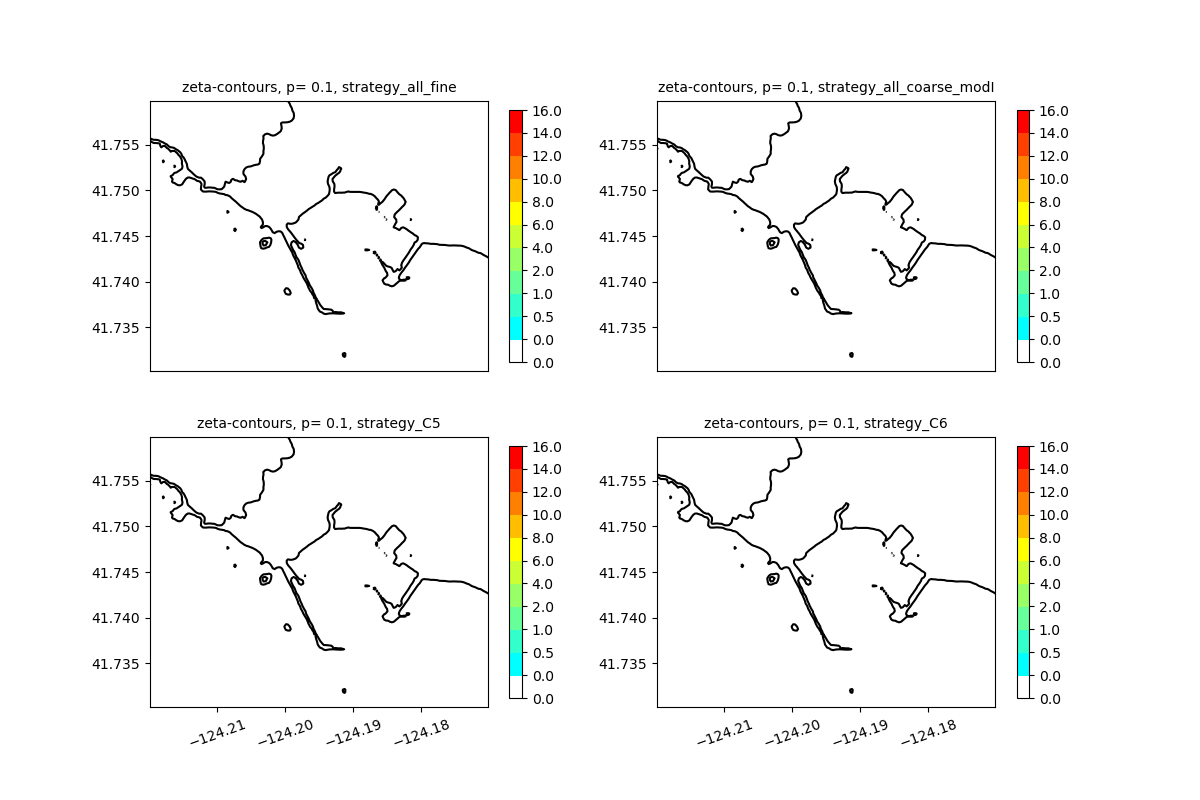
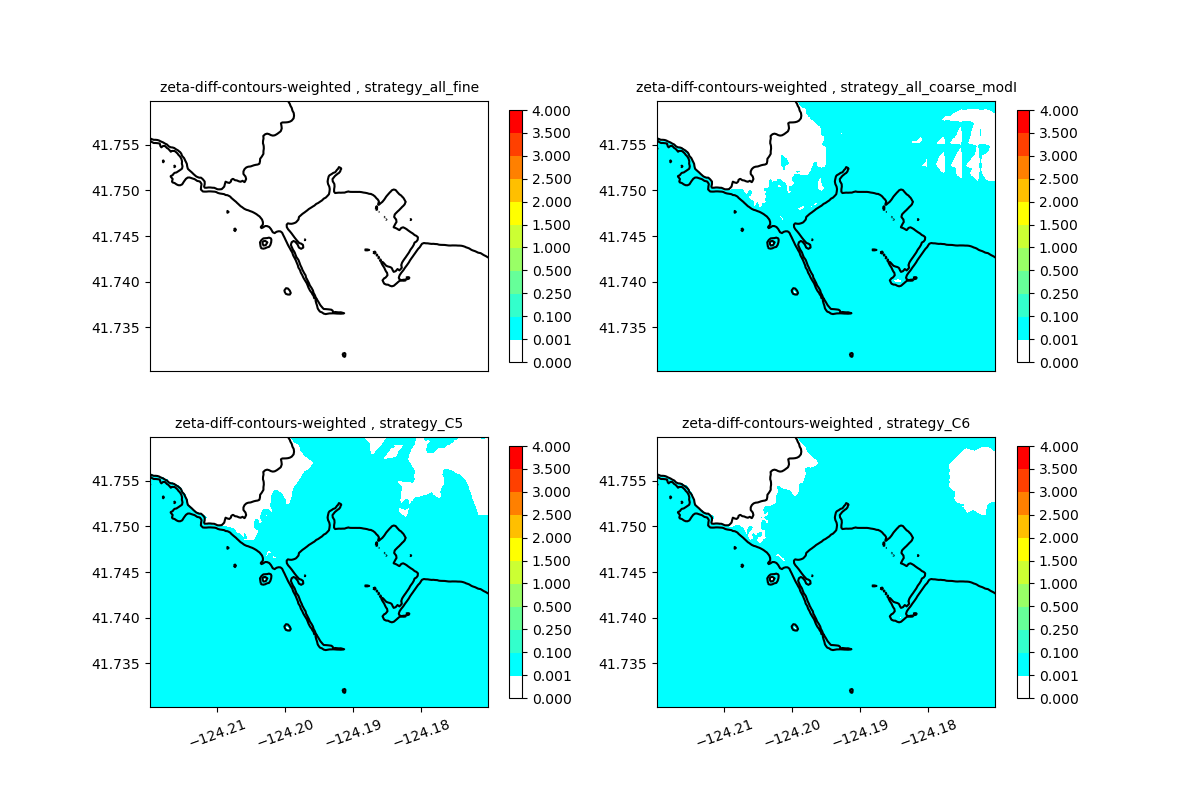
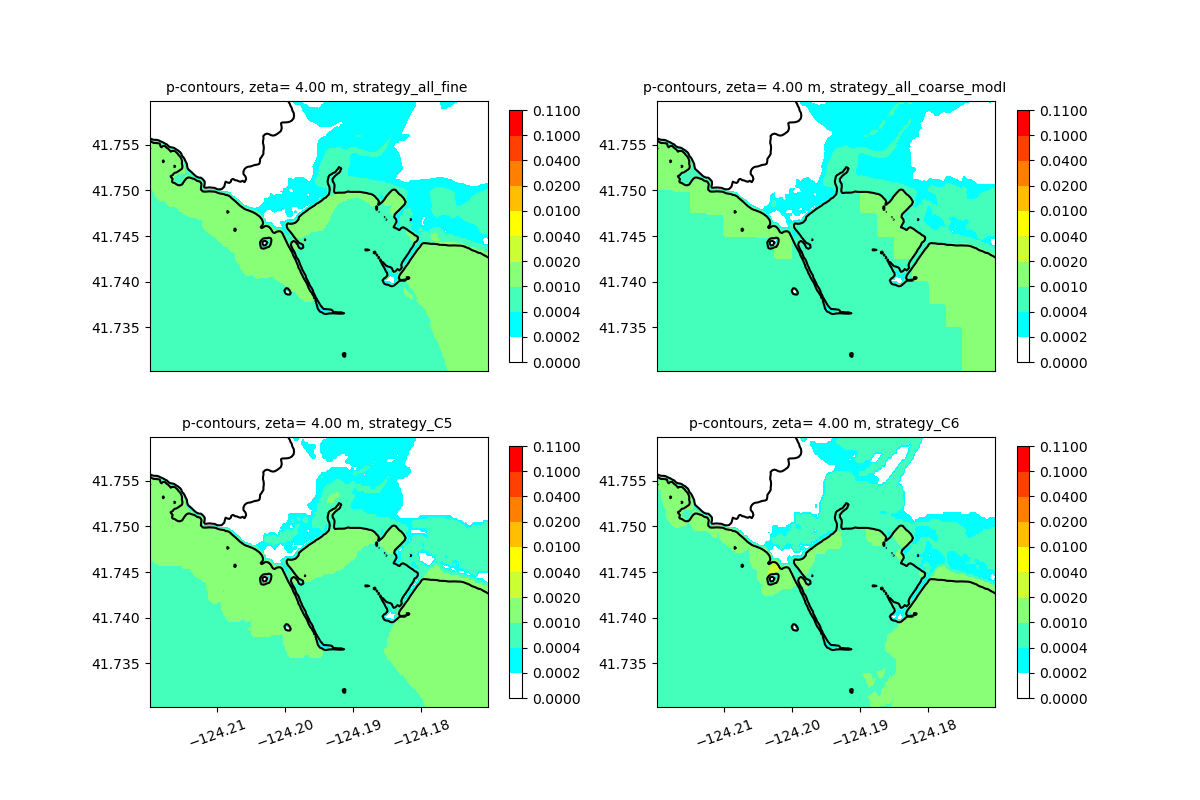
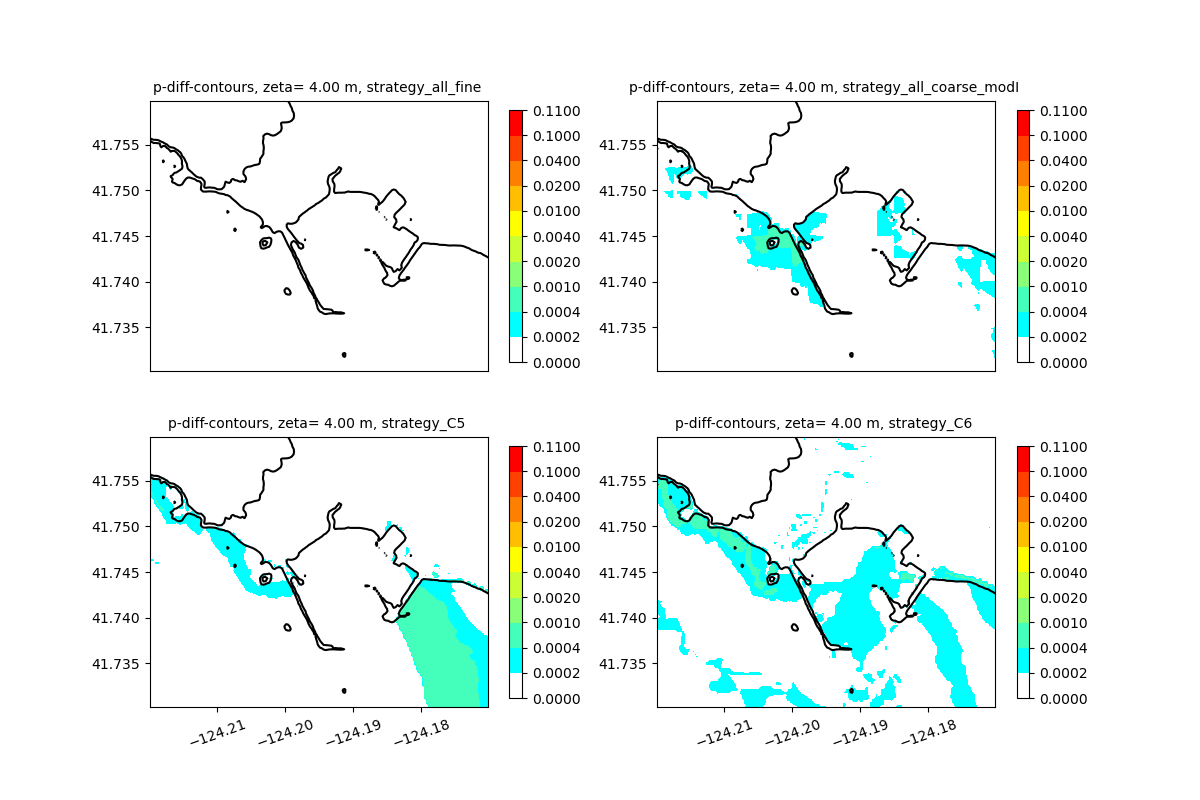
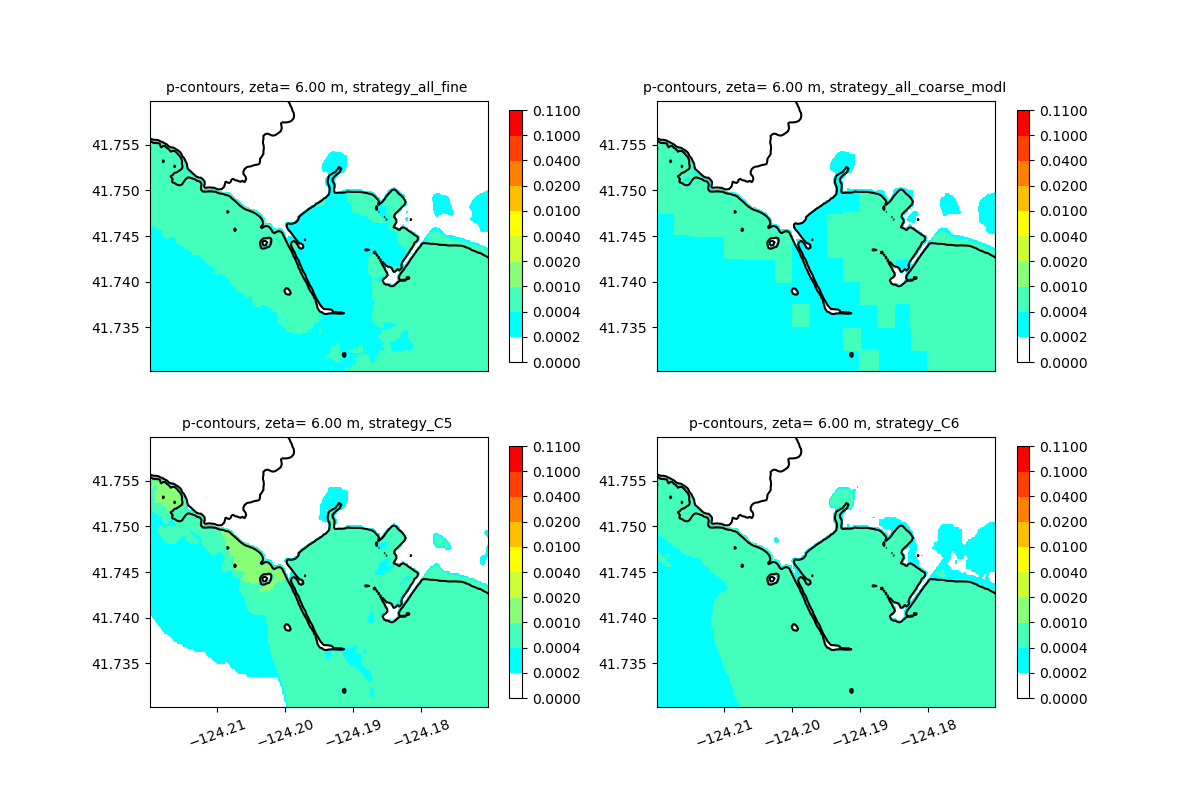
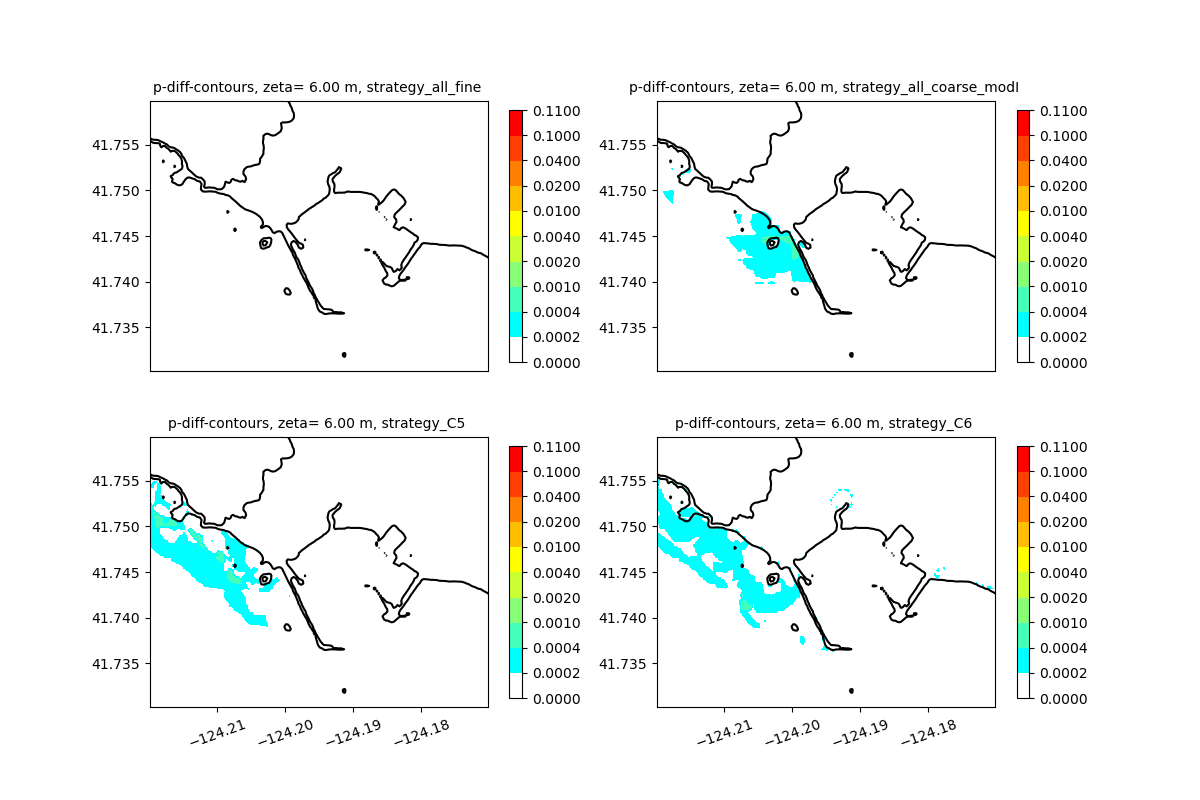
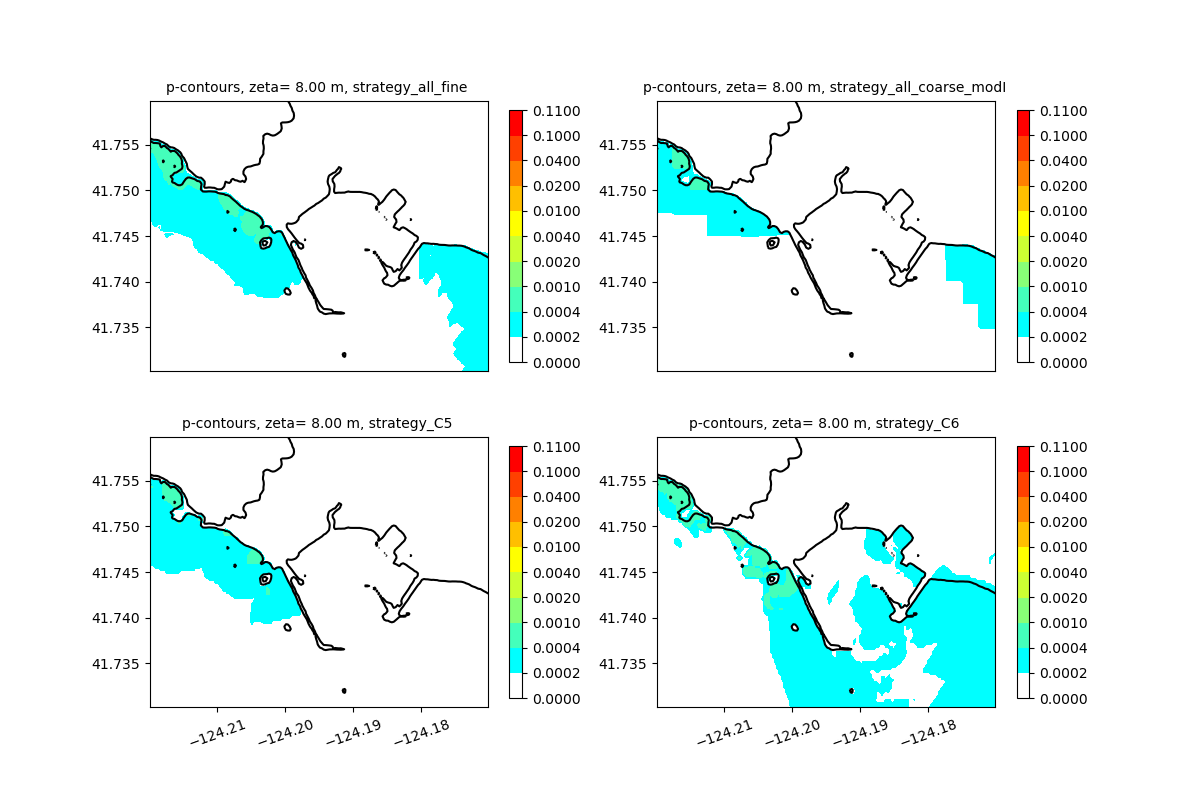
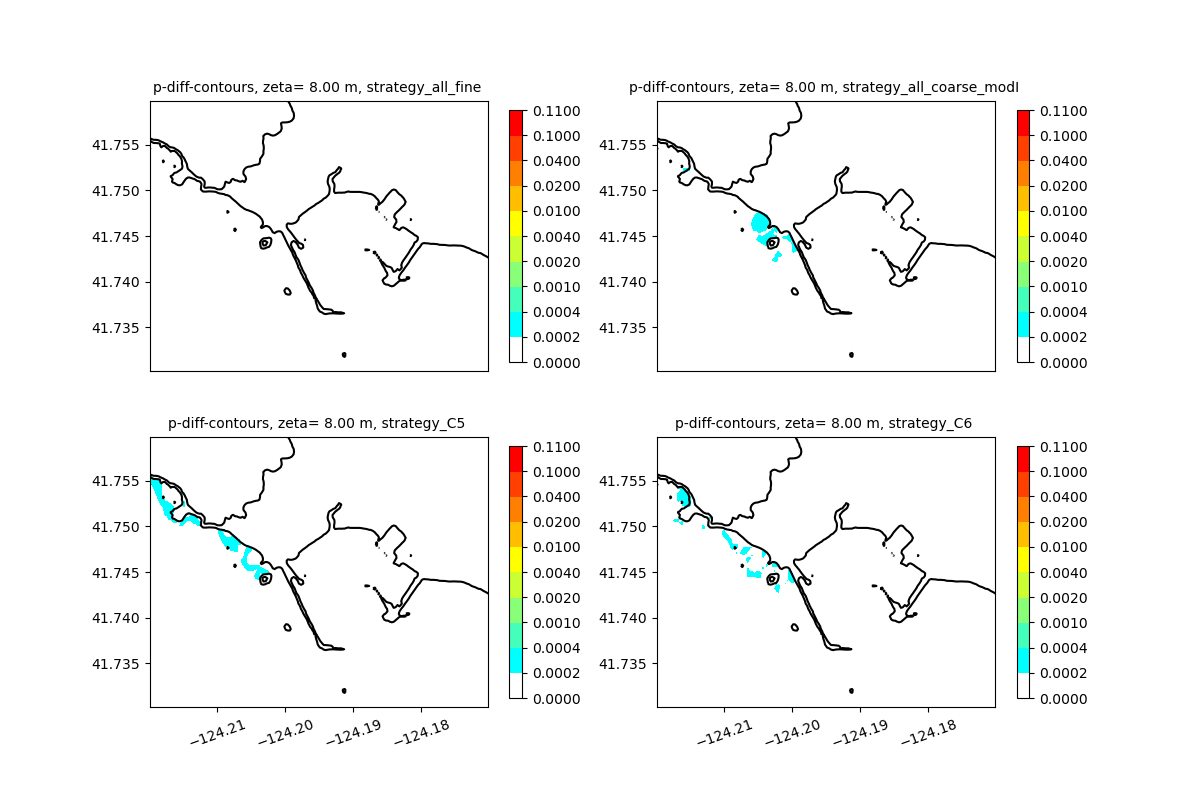
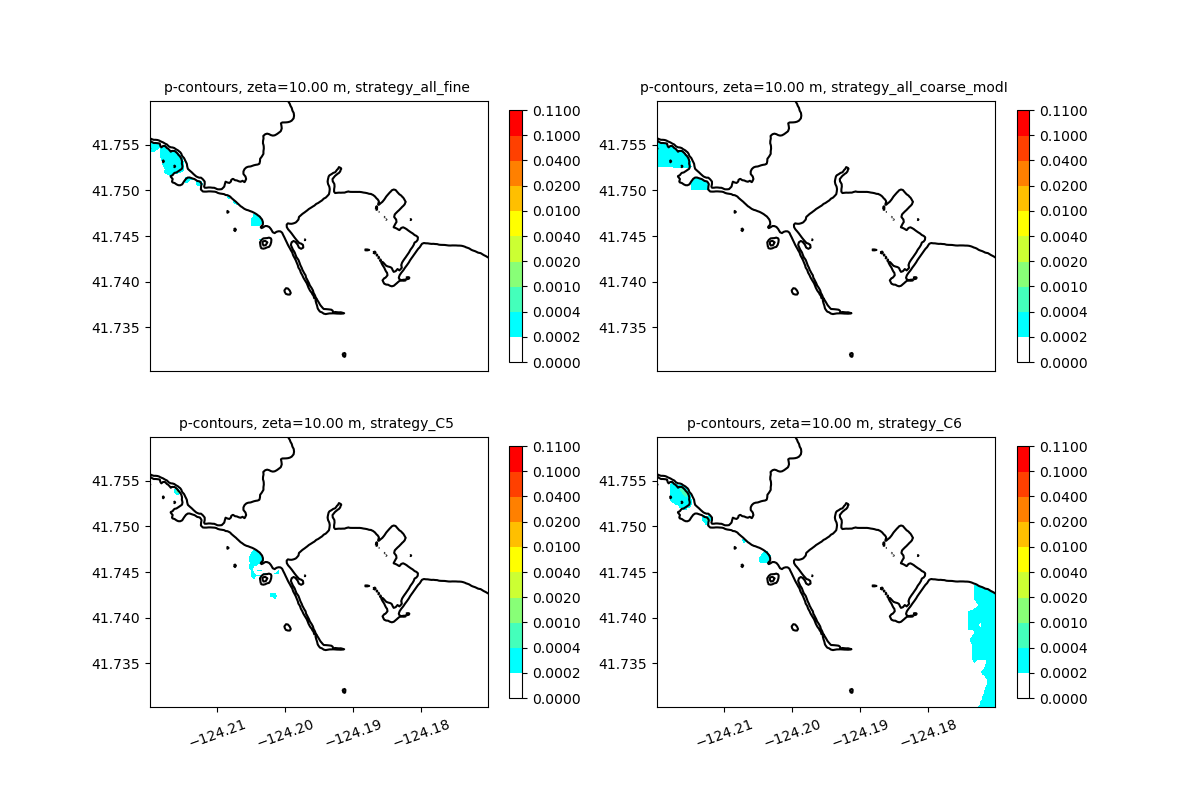
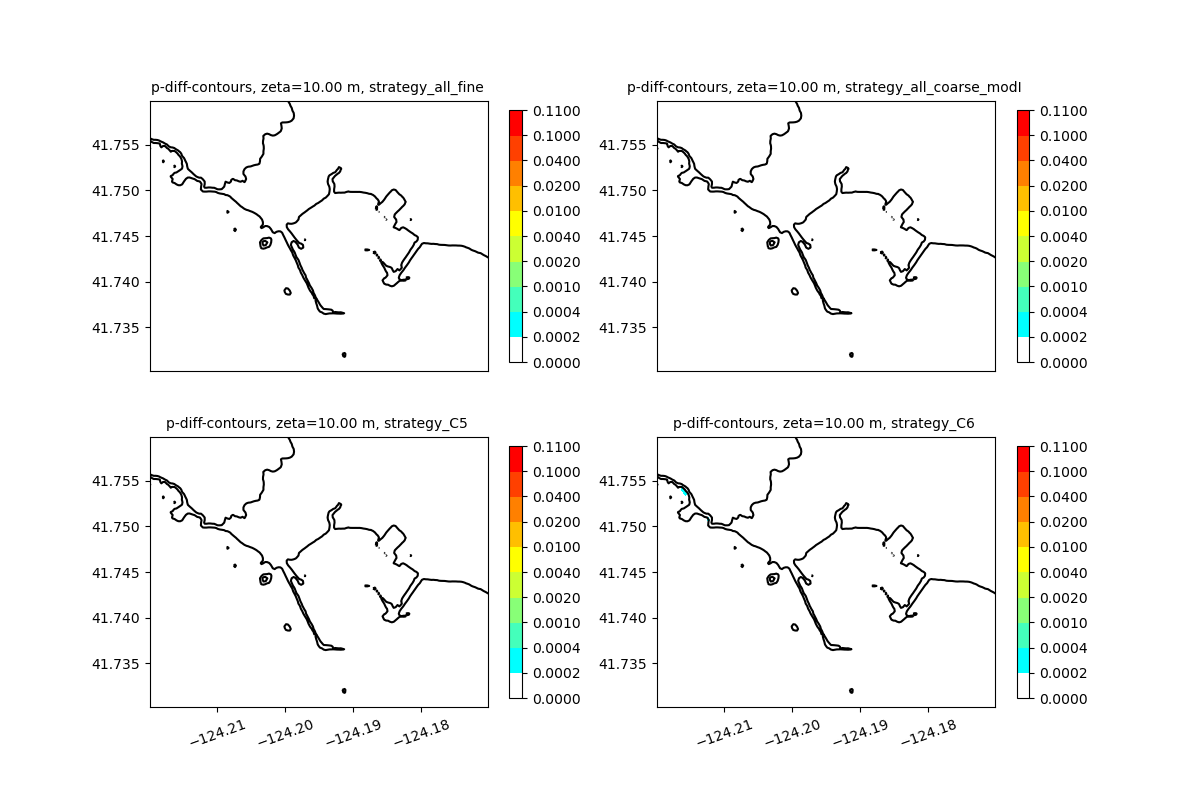
Note: All plots below have 4 subplots:
- Upper left: Ground truth using all 2000 fine grid runs,
- Lower left: Using only 18 fine grid runs (centroids of the C5 clusters).
- Upper right: Using all coarse grid runs after applying the "coarse-mod"
(improved) corrections,
- Lower right: Using only 18 fine grid runs (centroids of the C6 clusters).
Topo/Bathy contours
Eta contours for different probabilities (and errors)
Eta = h+B0 everywhere (B0 = original topo)
Zeta contours for different probabilities (and errors)
Zeta = h on land (where B0 > 0), Zeta = Eta = h+B0 offshore (where B0 < 0)
Probability contours for different exceedance values of zeta (and errors)