The investigators are assessing possibilities for cost-effective interpretative and analytical techniques and associated GIS infrastructure to meet the need for improved structural inventory data for seismic risk analysis. This project has applied two techniques of aerial photography interpretation in the process of developing an overall preferred method. The first technique delineated and classified groups of structures with homogeneous observable characteristics. The second technique identified and interpreted individual structures of interest (those with commercial, industrial, public, or multiple-family residential occupancies). Data derived from these techniques have been tabulated in spreadsheets for further analysis and will be complemented with sampling-based statistical techniques.
Planning for earthquake hazard reduction and mitigation is dependent on an understanding of the potential risk to an area from seismic activity. An analysis of risk requires data describing the nature of the seismic hazards (likelihood, spatial location, and magnitude of actions such as ground acceleration, displacement, and liquefaction and secondary hazards such as landsliding and seiches) and the resources subject to these hazards (including homes, businesses, and other everyday buildings; critical structures; and lifelines). The quality of the risk analysis, and subsequent damage and loss projections, is dependent on the quality of seismic and resource data.
This project was conceived to address the need for high quality and timely resource data to drive modern risk analysis tools such as FEMA's HAZUS (National Institute of Building Sciences, 1997). Recent advances in computer hardware and software technology have made powerful analysis tools readily available to local jurisdictions seeking to development earthquake hazard reduction and mitigation programs. Unfortunately, development of data suitable for these tools has not made similar advances. In particular, detailed structural inventories are still dependent on time-intensive door-to-door techniques. While techniques such as ATC-21 (Applied Technology Council, 1988) provide good levels of accuracy, their expense hampers their ability to deliver timely data.
The project got underway in December 1997 (after some initial work in April, 1997). An unfunded contract extension was used to develop the project team's background and resources in the field through participation in HAZUS training and the PEER Invitational Workshop (May 14-15; Berkeley, CA). The HAZUS training (E307 Basic Hazards in the U.S. (HAZUS) Training, May 18-21, 1998; Emmittsburg, MD) was partially funded through FEMA Region X's Project Impact, with the intention of developing potential applications from this project for HAZUS.
As of this writing, the original aerial photography interpretation and GIS development tasks have been completed. This work included three phases (detailed below):
Pre-existing Data
METRO Data: Five data sets used in the analysis were acquired from METRO, the Portland metropolitan area's regional government: a PLSS grid layer, a street layer based on the U.S. Census TIGER files, a jurisdictional boundary layer, a parcels layer with Tax Assessor data, and digital orthophotography.
PSU ATC-21: Portland State University has undertaken an ATC-21 inventory of the METRO area over a period spanning approximately the last five years. This inventory has collected data on over 50,000 commercial, industrial, public, and multi-family residential buildings. The inventory information has been converted into a GIS database by linking the collected data with METRO's parcel records (geographic point locations). The PSU ATC-21 data from the study were made available to this project to be used as ground truth for interpretation and the basis for statistical extrapolation. The data set was assumed to be a complete census of the structures of interest for the purposes of this project.
Preparation of the GIS Environment
The majority of the GIS tasks used ESRI's
ARC/INFO 7.1.2. Data preparation and processing were automated using
Arc Macro Language (AML) scripts to expedite this project and to lay the
groundwork for future studies. A total of twenty-three AML scripts
and ten user-interface menus were prepared.
Clustering Analysis
The first interpretative technique delineated and classified groups of structures with homogeneous observable characteristics. The cluster analysis technique was designed to provide two functions:
Concept Development
Delineation and classification of the clusters was based on characteristics that were readily and rapidly observable or inferable from available aerial photography. Such interpretation followed in the tradition of land use classification from aerial photography. In particular, the classification scheme and techniques applied in this study were initially based on the work of University of Washington-Remote Sensing Applications Laboratory, 1991.
The structural clusters differed significantly from previous land use classification work in regards to the object of interest. In land use classification, the land surface is the object of interest, a comprehensive whole that is subdivided based on use at a particular location. Therefore, a land use classification polygon encloses that land surface, and only that land surface, which is given to a particular use. In the cluster analysis, the objects of interest are structures. Each cluster polygon encloses those structures, and only those structures, which are of a given structural type. It does not imply anything about the land surface other than which structures are included. It was important to recognize this distinction and exclude spatial factors (e.g. area enclosed) during analysis.
Classification
Structural type characterization and the cluster classification scheme were based on factors that had potential significance in determining a building's seismic vulnerability. Following ATC-21, seismic vulnerability was related to factors that contributed to:
| Residential | Industrial/Warehousing | Agricultural | Unique Structure |
| High Rise | Transportation | Outdoor Facilities | Unclassified |
| Commercial/City Core | Utilities | Other Codes | |
| Office | Public/Community Facilities | Unidentified |
"Unidentified" refers to structures obscured in photography; adequate interpretation impossible. "Unclassified" refers to structures that experienced significant changes or were built during the period between the collection of the print and digital photography sets.
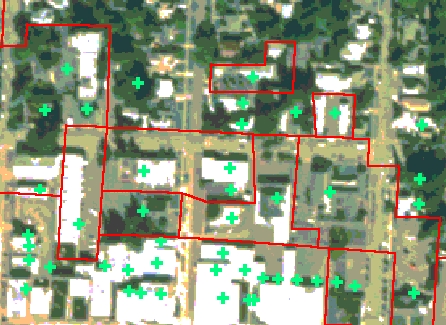
Following classification, the resultant polygons were used to overlay and attribute the structural point locations provided by the PSU ATC-21 data. The attribute tables from these data sets were then ready for analytical comparison of the cluster classifications and ATC-21 inventory data and structural classification. Figure 1 illustrates a typical cluster pattern (red lines denoting cluster boundaries) overlain on the orthophotography. The green crosses represent ATC-21 data point locations; their lack of registration to the actual building locations complicated cluster delineation.
Individual Structural Analysis
The second interpretative technique identified and interpreted each individual structure of interest (those with commercial, industrial, public, or multiple-family residential occupancies). The structures were classified according to thirty potentially observable characteristics. The individual structure analysis technique was designed to develop an inventory to fulfill two functions:
Concept Development
Similar to the clustering analysis, classification of the structures was based on characteristics that were readily and rapidly observable or inferable from available aerial photography. Insight into potentially observable characteristics was gained from University of Washington-Remote Sensing Applications Laboratory, 1991; Gauchat, Schodek, and Luft, 1984; and experience from the clustering analysis work. Characteristics were chosen based on their direct or indirect equivalence with ATC-21 factors (a proxy for factors which would prove to be of structural importance) and ease of interpretation.
Classification
Classification was again restricted to factors that could be interpreted from directly overhead or from a slight angle and included both quantitative and qualitative data. The specific classification factors were grouped into the following categories:
The investigators will use statistical analysis to determine which of the classification factors were most predictive of structural quality (as indicated by ATC-21 score). These results may be used to reduce the set of factors collected or to develop a simplified classification scheme based on recurring data patterns. An evaluation of the applicability of these data to HAZUS has begun. Additionally, initial research design has been performed for the sampling-driven analytical tasks and the investigators are considering expanding the project scope to refine the interpretative techniques based on the results to date.
Inventory and analysis data may be made available in either ARC/INFO export or ArcView shapefile formats. For additional information contact the project investigators.
National Institute of Building Sciences. HAZUS User's Manual. NIBS Document 5200. Washington, DC: Federal Emergency Management Agency, 1997.
Applied Technology Council. Rapid Visual Screening of Buildings for Potential Seismic Hazards: A Handbook. Earthquake Hazards Reduction Series 41. Washington, DC: Federal Emergency Management Agency, 1988.
University of Washington-Remote Sensing Applications Laboratory. Interim Report - Land Cover in Tahoma/Raven Heights, King County, Washington, 1990/1991. Seattle: University of Washington, 1991.
Gauchat, Urs P., Daniel L. Schodek, and Rene Luft. Patterns of Housing Type and Density: A Basis for Analyzing Earthquake Resistance. Cambridge, Massachusetts: Harvard University, 1984.