Enrich 0.2 documentation
| Authors: | Douglas M. Fowler, Carlos L. Araya, Wayne Gerards |
|---|---|
| Homepage: | http://depts.washington.edu/sfields/software/enrich/ |
| Organization: | University of Washington |
| Address: | Department of Genome Sciences, Box 355065, Seattle, WA, 98195 |
| Copyright: | Douglas M. Fowler and Carlos L. Araya, 2010-2011 |
| License: | FreeBSD |
| Last update: | September 15, 2011 |
| Contact: | Douglas M. Fowler (dfowler at uw dot edu) |
Overview
Enrich is an analysis pipeline for using high throughput sequencing data to assess protein sequence-function relationships. Enrich takes FASTQ files as input, translating and identifying unique protein sequences and calculating enrichment ratios between libraries for each sequence. Enrich can be run from the command line or in an interactive mode, and is capable of using paired-end read data. Each step of the pipeline can be run separately or the entire sequence of steps can be run consecutively. Enrich is designed to be run on a single desktop computer on an average data set in ~2 hours. Enrich can run in an Oracle Grid Engine (OGE) environment so that many analyses can be carried out in parallel. Enrich employs the DRMAA API to interface with OGE. DRMAA enables extension to other high-performance computing environments with minimal effort. For a description of Enrich input, function and output please see the following publications:
High-resolution mapping of protein sequence-function relationships. Fowler DM, Araya CL, Fleishman SJ, Kellogg EH, Stephany JJ, Baker D, Fields S. Nat Methods. 2010 Sep;7(9):741-6. Epub 2010 Aug 15.
and
Enrich: Software for Analysis of Protein Function by Enrichment and Depletion of Variants. Fowler DM, Araya CL, Gerards W, Fields S. Submitted (email D. Fowler for a copy)
Installation
Enrich retains core functionality when run without any dependencies in a pure Python environment. Thus, Enrich can be run by executing the enrich.py script located in the Enrich tarball without any taking any other steps.
For convenience, Enrich is can be installed using easy_install which is part of setuptools. Please obtain the current version of Enrich here. After downloading Enrich, install it by typing:
easy_install Enrich-|version|.tar.gz
If you do not have setuptools, running the ez_setup.py script in the source tarball will automatically download and install setuptools followed by Enrich.
Installation on a cluster
If you are using a cluster and do not have root access, easy_install may fail because it does not have write access to the default installation directories. You can overcome this limitation by using the -d easy_install option, which allows you to specify an installation directory to which you do have access. The install directory will need to be in your $PYTHONPATH, and you will also need to add it to your $PATH if you wish to use the enrich executable, which will be installed in the specified directory.
Dependencies
Enrich will identify and enumerate variants as well as calculate enrichment ratios without any dependencies. However, Enrich depends upon several common Python packages to perform optional tasks. Many of these dependencies are available as precompiled binaries, and it is recommended that these precompiled binaries be used whenever possible. Below, each the purpose of each dependency is explained along with recommended versions and brief guidance for installation. Installing the dependencies in the order listed is recommended.
DRMAA
| What it’s used for: | |
|---|---|
| DRMAA is required to interface with OGE | |
| What versions have been tested: | |
| DRMAA-0.4b3 | |
| How is it installed?: | |
| DRMAA can be installed using easy_install by typing easy_install drmaa==0.4b3 | |
More information is available here
Numpy and Scipy
| What it’s used for: | |
|---|---|
| Numpy and Scipy are used for generating visualizations and for calculating q-values for enrichment and depletion | |
| What versions have been tested: | |
| numpy-1.4.1, scipy-0.8.0 and 0.9.0 | |
| How is it installed?: | |
| Precompiled binaries are available for Numpy and Scipy for OS X, Windows and some flavors of Unix. These, as well as source code and instructions for installation are available here. | |
Biopython
| What it’s used for: | |
|---|---|
| Biopython is used for performing the optional Needleman-Wunsch alignment of read pairs | |
| What versions have been tested: | |
| biopython-1.5.2 and 1.5.5 | |
| How is it installed?: | |
| Biopython can be installed using easy_install by typing easy_install biopython==1.55b | |
More information is available here
Matplotlib
| What it’s used for: | |
|---|---|
| matplotlib is used to generate visualizations | |
| What versions have been tested: | |
| matplotlib-1.0.1 | |
| How is it installed?: | |
| Precompiled binaries are available for matplotlib for OS X and Windows and are available here. Detailed instructions for installation, including from source code, are available here. | |
Workflow
Enrich performs a series of tasks. Each of the tasks in the Enrich pipeline require as input the output of previous steps, and each step writes its output in the project directory.
- Filtration of raw FASTQ files using an index or barcode read to isolate reads of interest (fastq_filter)
- Fusion of read pairs to create a single finished sequence for each read pair (read_fuser)
- Alignment of each finished sequence (translated and untranslated) to a canonical sequence, with enumeration of mutations and quality filtration (read_aligner)
- Identification and counting of each unique variant (map_counts)
- Calculation of enrichment ratios between the unselected and selected libraries for each variant (map_ratios)
- Unlinking of variants bearing multiple mutations (map_unlink)
- Graphical output (enrich_plot)
Input data requirements
Enrich takes up to two pairs of FASTQ formatted files as input. Enrich has currently only been tested with FASTQ files generated from the Illumina platform. Each Enrich run requires an input, or unselected, set of reads and a selected set of reads. Each of these reads can come from single-end sequencing or they can be created from paired-end sequencing data. If paired-end sequencing was used, the input and selected reads will each have a forward and reverse read. These forward and reverse reads can overlap completely (e.g. the first base of the forward read is the last base of the reverse read) or they can be completely discontinuous (e.g. the last base of the forward read meets the last base of the reverse read).
Input files can have any name, but cannot contain a ‘.’ character other than the ‘.fq’ extension. Each entry in the FASTQ file must have a unique header (first line). Additionally, if the data is from an Illumina instrument, the chastity bit is commonly encoded in this line. Thus, the chaste configuration element should only be set to y if the input files contain properly formatted header lines (see read_aligner)
Enrich modes of operation
Enrich can be operated in either interactive or command line mode.
Interactive mode
Interactive mode is a menu-based option for running Enrich that requires minimal knowledge of the command line. Interactive mode guides the user through the pipeline. Interactive mode can be accessed simply by typing enrich. If Enrich is invoked from the command line with an invalid option, it will default into interactive mode.
Command line mode
Command line mode enables the user to run Enrich from the command line, and takes both options and arguments.
Valid options are as follows:
| --help | print the list of valid options |
| --mode MODE | indicates which operation Enrich should perform - valid options are initialize, configure, example, fastq_filter, read_fuse, read_align, map_counts, map_ratios, map_unlink, plot, and run_all |
| --config_file FILE | |
| required for some modes, indicates the exact path to the configuration file | |
Enrich also takes arguments in addition to the ones mentioned above, which are simply separated by spaces (if multiple) and modify the behavior of Enrich without having to edit the configuration file. Arguments can be omitted. Valid arguments are as follows:
| nowait: | If the configuration file specifies a cluster run (i.e. local = SGE), then the nowait argument prevents Enrich from waiting until job completion to exit. The nowait argument has no effect on read_fuser, because job completion is necessary before atomized output files can be recombined. |
|---|
Here is an example command line mode invocation, using the nowait argument:
enrich --mode MODE --config_file CONFIG_FILE nowait
The Enrich project directory
Enrich is designed to work on a collection of high throughput sequencing files organized into a project. Enrich will automatically create a new project directory in interactive mode, unless an existing project directory is specified. To create a new Enrich project directory or verify an existing one from the command line do the following:
enrich --mode initialize /path/to/new/project/directory/
Note
In general, Enrich must be given complete, not relative paths (e.g. /path/to/directory/ not ../../relative/path)
- An Enrich project directory will have the following structure:
- project_directory/input/data/raw/data/output/data/tmp/log/plots/
The input directory contains Enrich configuration files. The data/raw/ directory contains raw FASTQ that Enrich takes as input. The data/output/ directory contains finished Enrich output files, produced by the map_counts, map_ratios, and map_unlink modules. The data/tmp/ directory contains intermediate Enrich output files produced by fastq_filter, read_fuser, and read_aligner. The log/ directory contains logs for each Enrich module. The plots/ directory contains plots produced by the enrich_plot module.
Note
After initializing a new Enrich project directory, place your input files in project_directory/data/raw/. You can create new directories within the project directory (e.g. project_directory/py/ or project_directory/R/ if you have additional, project specific Python or R code). However, you may not move or rename the directories listed above. You can have an arbitrary number of project directories in any location you choose.
Enrich Configuration files
Enrich uses an XML-based configuration file for each run. Configuration files are stored in the project_directory/input/ directory, and a default configuration file enrich_default_config is provided. A project directory can have many configuration files specifying a variety of input files, processing modes and other options. Enrich has a guided configuration file generation capacity, which can be accessed from interactive mode or by doing the following from the command line:
enrich --mode configure
Warning
Configuration files can be edited manually. However, configuration elements should not be added or deleted, because each configuration file is checked against the default file to ensure that all elements are present. Additionally, the default configuration file cannot be moved or renamed, nor can its configuration elements be altered. However, you can change default values in the default configuration file to make generating new configuration files less laborious.
Below is a list of each element in the configuration file and its meaning. For detailed explanations, see the appropriate section describing the relevant pipeline element.
Configuration file elements
general information
| filename: | The name of the configuration file |
|---|---|
| path: | The path to the project directory. The path must terminate with a / |
| input_read1_filename: | |
| Name of the input library first read | |
| input_read2_filename: | |
| Name of the input library second read | |
| sel_read1_filename: | |
| Name of the selected library first read | |
| sel_read2_filename: | |
| Name of the selected library second read | |
| local: | Indicates whether the Enrich run will be local or in a cluster environment (L = local, SGE = Sun Grid Engine) |
| run_name: | The name of the run |
| wtDNA: | DNA sequence to which the fused read pair will be aligned |
| wtPRO: | Translation of wtDNA sequence, automatically generated |
fastq_filter
| run_filter: | If y, FASTQ files will be filtered to recover relevant sequences |
|---|---|
| index_file: | FASTQ file containing index reads |
| index_mismatch_threshold: | |
| The maximum number of mismatches between the canonical index sequence and a read index sequence permitted | |
| index_mode: | Indicates whether fastq_filter should use an index read or, alternately, should use the first 20 bases of the read itself for filtration (index = use an index read, N_include = use the read sequence and count ‘N’ bases toward the mismatch threshold, N_exclude = use the read sequence and do not count ‘N’ bases toward the mismatch threshold) |
| index_sequence: | If an index read is present, this is the expected index sequence |
read_fuser
| fuser_mode: | Indicates whether paired reads are present and, if so, whether they should both be used (B = both reads, R1 = read1, or R2 = read2) |
|---|---|
| input_read1_filename_fuser: | |
| An automatically generated input library first read filename for the read_fuser function | |
| input_read2_filename_fuser: | |
| An automatically generated input library second read filename for the read_fuser function | |
| sel_read1_filename_fuser: | |
| An automatically generated selected library first read filename for the read_fuser function | |
| sel_read2_filename_fuser: | |
| An automatically generated selected library second read filename for the read_fuser function | |
| read1_overlap_end: | |
| An integer indicating where the read overlap region ends, relative to the first read | |
| read1_overlap_start: | |
| An integer indicating where the read overlap region starts, relative to the first read | |
| read2_overlap_end: | |
| An integer indicating where the read overlap region ends, relative to the second read | |
| read2_overlap_start: | |
| An integer indicating where the read overlap region starts, relative to the second read | |
| include_nonoverlap_region: | |
| If y, the 5’ nonoverlapping regions from the first and second reads will be appended to the specified overlap region | |
| run_aligner: | If y, a Needleman-Wunsch alignment will be performed on each read pair if the number of mismatches exceeds that specified in paired_mismatch_threshold |
| paired_mismatch_threshold: | |
| The number of mismatches between read pairs required to trigger alignment | |
read_aligner
| input_filename_aligner: | |
|---|---|
| An automatically generated input library filename for the read_aligner function | |
| sel_filename_aligner: | |
| An automatically generated selected library filename for the read_aligner function | |
| unresolvable_max: | |
| The maximum number of unresolvable bases to permit | |
| maximum_mutation_run: | |
| The maximum number of consecutive DNA mutations to permit | |
| avg_quality: | The minimum average QPhred scaled quality score to permit |
| chaste: | If y, reads failing the Illumina chastity filter will be excluded (note: this information needs to be in a specific place in the FASTQ header) |
| Ncount_max: | The maximum number of bases called as ‘N’ to permit |
map_counts
| input_filename_map_counts: | |
|---|---|
| An automatically generated, comma-separated list of input library files for the map_counts function | |
| sel_filename_map_counts: | |
| An automatically generated, comma-separated list of selected library files for the map_counts function | |
map_ratios
| input_filename_map_ratios: | |
|---|---|
| An automatically generated, comma-separated list of input library files for the map_ratios function | |
| sel_filename_map_ratios: | |
| An automatically generated, comma-separated list of selected library files for the map_ratios function | |
map_unlink
| input_filename_map_unlink: | |
|---|---|
| An automatically generated, comma-separated list of input library files for the map_unlink function | |
| sel_filename_map_unlink: | |
| An automatically generated, comma-separated list of selected library files for the map_unlink function | |
| unlink_modes: | A comma-separated list of modes in which to run map_unlink. Currently supported modes are counts and wild_counts. |
enrich_plot
| input_filename_freqplot: | |
|---|---|
| An automatically generated, comma-separated list of input files for the freqplot function | |
| input_filename_ratioplot: | |
| An automatically generated, comma-separated list of input files for the ratioplot function | |
Technical description of pipeline elements
fastq_filter
The fastq_filter module filters a pair of FASTQ files to identify and selected reads with a particular sequence (or a particular index read sequence). The fastq_filter module exists to deal with multiplexed sequencing data sets, in which multiple libraries have been mixed and sequenced together. The fastq_filter module can run in one of three modes, identified by the index_mode element of the enrich run configuration file. If a separate index read is present, the index_mode element should have a value of index. For each read, fastq_filter examines the index sequence. If the index sequence matches the index_sequence configuration element with no more than the number of mismatches specified in the index_mismatch_threshold configuration element, the read is considered a match and written into the output file. If not, the read is discarded. N_include and N_exclude modes indicate that an index read is not present. These modes both compare the first 20 bases of each read to the supplied wtDNA configuration element and consider the read a match if it has no more than the number of mismatches specified in the index_mismatch_threshold configuration element. N_include mode counts ‘N’ bases as mismatches, whereas N_exclude mode does not. The fastq_filter module can be selected in interactive mode or can be invoked from the command line:
enrich --mode fastq_filter --config_file /path/to/the/config_file
The fastq_filter module produces output in project_directory/data/tmp/ and output files are named filename_index_mode_filtered
read_fuser
The read_fuser module performs several important tasks centered on forming a finished sequence for comparison to the wtDNA configuration element. If overlapping read pairs have been acquired, read_fuser stitches these together using the read1_overlap_start, read1_overlap_end, read2_overlap_start, read2_overlap_end, and include_nonoverlap_region configuration elements. Here is a schematic of how overlap start and end work:
R1_start>                     |R2_end                             R1_end|                    <R2_start
        ATGGAAGATTATACCAAAATAGAGAAAATTGGAGAAGG...TACCTATGGAGTTGTGTATAAGGGTAGACACAAAACTACAGGTCA
        ======================-------------------------------------------=====================
        nonoverlap region     |overlap region                           |nonoverlap region
              R1_overlap_start>                                         |R1_overlap_end
              R2_overlap_start>                                         |R2_overlap_end
Note
Counting is done from 0, rather than 1. Read2 is considered to be reverse-complemented for the purposes of calculating the overlap start and overlap end. Thus, in the example above, R2_overlap_start would be 0, whereas read1 start would be at position 22. If the include_nonoverlap_region configuration element were set to y, then the nonoverlap regions above would be appended to the overlapped sequence. Before a full-scale Enrich run is initiated, it is advisable to check that the overlap parameters are set correctly on a small subset of data.
For each forward and reverse read pair, read_fuser checks within the overlap region to make sure that the read pairs agree on the identity of each base. If they do not, then read_fuser examines the quality score of each base and picks the base with the higher score. If both reads have an identical quality score, the base is considered unresolvable and an ‘X’ is inserted in the finished sequence at the unresolvable position. The read_fuser module also calculates a compound quality score estimate at each position, equal to the product of the two quality scores at that position if the two reads agree on the identity of the position. If the reads do not agree, the higher quality score is used. Positions in nonoverlapped regions are assigned their single-read quality score.
In the event that only one read is present, the overlap start and end configuration elements can be used to specify the beginning and end of the region of interest. Finished sequences within that region are generated. If only a reverse read is specified, then each read will be reverse-complemented before production of a finished sequence.
If the run_aligner configuration element is set to y, then a Needleman-Wunsch alignment is performed for each read pair which disagrees at more positions than specified in the paired_mismatch_threshold configuration element. Generally, read pairs that contain a large number of mismatches represent deletions within the region of interest and the Needleman-Wunch alignment produces a gap.
Warning
Running the Needleman-Wunsch alignment algorithm substantially increases the time required for read_fuser to run. Gapped sequences are removed by virtue of their large number of paired read mismatches, so running the alignment algorithm is not usually necessary.
The read_fuser module can be selected in interactive mode or can be invoked from the command line:
enrich --mode read_fuse --config_file /path/to/the/config_file
The read_fuser module produces output in project_directory/data/tmp/ and project_directory/data/tmp/parts/ and output files are named filename_fuser_mode
read_aligner
The read_aligner module translates each finished sequence and then aligns both the DNA and protein sequences to the wtDNA and wtPRO configuration elements. For the sake of speed, no alignment algorithm is used. Instead a simple base-by-base comparison is made. The read_aligner module also filters the output sequences on a number of parameters. The unresolvable_max configuration element specifies the maximum number of unresolvable bases (see read_fuser) to permit, and should generally be set to 0. The maximum_mutation_run configuration element specifies the maximum number of consecutive DNA mutations to permit. In a lightly mutagenized library, reads with a large number (>3) of consecutive mutations are generally sequencing errors. The avg_quality configuration element specifies the minimum read-average QPhred quality score to permit, and is generally set to 20. The chaste configuration element specifies whether reads that have failed the Illumina quality chastity filter should be included, and is generally set to ‘n’. Enrich will look for chastity bits encoded with 1/0 or Y/N in the header line of each FASTQ entry, formatted as follows:
@<MachineName>:<Lane #>:<Tile #>:<X coordinate>:<Y coordinate>:<Chastity bit>#<Index Read>/<Read Number>
If your FASTQ header is not formatted similarly you should set chaste to n. If the chastity bit is encoded with a characters other than 1/0 or Y/N, it will be ignored. The Ncount_max configuration element specifies the maximum number of ‘N’ bases a read may contain, and is generally set to 0.
The read_aligner module can be selected in interactive mode or can be invoked from the command line:
enrich --mode read_align --config_file /path/to/the/config_file
The read_aligner module produces output in project_directory/data/tmp/ and output files are named either filename_DNA_qc for untranslated sequences or filename_PRO_qc for translated sequences.
map_counts
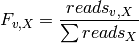
The map_counts module identifies unique variants in read_aligner output files and produces an output file that contains a list of those unique sequences as well as the number of times they appear normalized by the total number of counts in the input file (i.e. the frequency). The frequency for a given variant, v, in the library X ( ) is:
) is:
The map_counts module can be selected in interactive mode or can be invoked from the command line:
enrich --mode map_counts --config_file /path/to/the/config_file
The map_counts module produces output in project_directory/data/ and output files are named counts_filename (containing all sequences), counts_filename.m1 (containing only sequences with single mutations) and counts_filename.m2 (containing only sequences with double mutations)
map_ratios
The map_ratios module uses variant frequencies generated by map_counts to calculate enrichment ratios for each variant that occurs in both the unselected and selected map_counts output files. The enrichment ratio for a given variant, v, in the selected library X ( ) is:
) is:
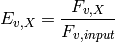
where  is the frequency of the variant v (see map_counts).
The map_ratios module also uses a two-sided Possion exact test using a python port of the R poisson.test function to calculate a p-value for the significance of enrichment or depletion for each variant and then performs multiple testing correction using a python port of the R module qvalue function to produce a q-value. Due to differences in the scipy smoothing spline function, the python port uses the bootstrap method for choosing the tuning paramater in the estimation of pi0.
The map_ratios module can be selected in interactive mode or can be invoked from the command line:
enrich --mode map_ratios --config_file /path/to/the/config_file
The map_ratios module produces output in project_directory/data/ and output files are named ratios_filename
Warning
This module depends on Scipy to calculate cumulative densities from the Poisson distribution. If Scipy cannot be imported, p-values will be reported as NaN
map_unlink
The map_unlink module uses unique variant counts generated by map_counts to calculate unlinked mutation frequencies for all possible single mutants from all variants. Variants with multiple mutations are unlinked; the variant frequency is added to each of the single mutants comprising the multiply mutated variant. The map_unlink module can be invoked in multiple modes. Currently supported modes are counts and wild_counts. The difference between counts and wild_counts is that for counts, only positions that differ from wild type (i.e. mutations) are ennumerated, whereas for wild_counts, all positions for each variant are included in the calculation regardless of the identity of the amino acid. In other words, in counts mode the map_unlink calculation at each position yields the frequency of mutant amino acids only whereas the wild_counts mode yields the frequency of all amino acids including wild type. Thus, the unlinked frequency at the ith position bearing the jth amino acid in library X ( ) is:
) is:
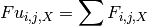
for non-wild type i,j combinations in counts mode and for all i,j combinations in wild_counts mode.
The map_unlink module can be selected in interactive mode or can be invoked from the command line:
enrich --mode map_unlink --config_file /path/to/the/config_file
The map_unlink module produces output in project_directory/data/ and output files are named mode_filename where mode is the mode in which map_unlink was run.
enrich_plot
The enrich_plot module depends on matplotlib to produce a number of visualizations. The visualization tools included with Enrich are intended as a starting point for further analyses, and it is expected that each user will likely want to generate project-specific visualizations. Enrich_plot generates the following visualizations:
Visual estimation of library diversity
This plot shows the mutational frequency at each position for each possible amino acid substitution within a given library, and is generated from the map_unlink file for that library. This plot is named unlink_counts_library_diversity.pdf.
Position-averaged mutation enrichment
This plot shows the average enrichment ratio at each position. The unselected and selected map_unlink files are used to calculate an enrichment ratio for all possible single mutants. These ratios are then averaged by position. A ratio of 1 indicates that mutations at that position neither enriched nor depleted during selection, while values > 1 indicate enrichment and values < 1 indicate depletion. This plot is named unlink_counts_selected_library_unlink_counts_unselected_library_position_enrichment.pdf
All-residue enrichment ratio scan
These plots shows the enrichment ratio for all possible single mutations organized either by position or by amino acid. The unselected and selected map_unlink files are used to calculate an enrichment ratio for each mutation. These ratios are log2 transformed, so values < 0 indicate depletion whereas values > 0 indicate enrichment. Measured values are indicated by blue dots. Missing data are indicated by grey boxes and position-amino acid combinations that correspond to the wild type sequence are denoted by red boxes. These plots are named unlink_counts_selected_library_unlink_counts_unselected_library_all_residue_by_Pos.pdf if organized by position or unlink_counts_selected_library_unlink_counts_unselected_library_all_residue_by_AA.pdf if organized by amino acid.
Enrich output files
Each segment of the Enrich pipeline produces human-readable tab delimited text output files. Each file contains a descriptive header. All output files are retained because it is expected that each user will likely have a number of project-specific questions they would like to answer. Output from the earlier parts of the pipeline, which are less likely to be of interest, are kept in project_directory/data/output/tmp/ whereas finished map_counts, map_ratios and map_unlink files are kept in project_directory/data/output/. Plots generated by Enrich are kept in project_directory/plots/. For detailed information about the location and naming of pipeline output files, see the relevant pipeline element description.
Enrich run logs
If the local configuration element is set to SGE, each pipeline_element generates a log file. The log files are found in project_directory/log/ and contain, for each instance of the pipeline element in question, the time it began running, the parameters it was passed and any relevant error messages. Log files are not deleted, regenerated, compressed or managed in any way. Thus, it is conceivable a very large project that runs many, many times could generate unwieldy log files.
Enrich Example
Enrich comes with a small example data set and accompanying configuration files for the purpose of testing Enrich installs. To create an example project directory from the command line, type:
enrich --mode example /path/to/desired/example/directory
This project directory contains test data as well as two configuration files: example_local_config and example_SGE_config. If Enrich is properly installed, the entire pipeline can be tested using these configuration files and the --run_all command line mode option.