Viemeister & Wakefield (1991): Results
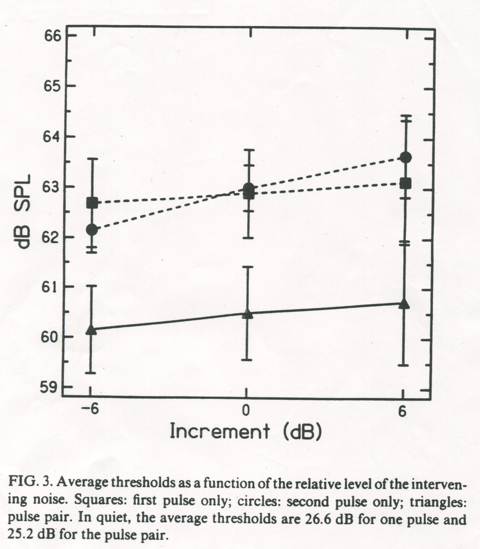
| This graph shows the results
of the experiment. The dashed lines show the thresholds when just one of the
tone (1st or 2nd) is presented; the solid curve shows thresholds when the
tones are presented in sequence. On the x-axis is the level of the noise between
the tones in the three conditions. Thresholds were better when there were two
tones instead of one, and the level of the noise doesn’t make much
difference. This result supports the multiple looks theory and argues against
the multiple integrators theory, |