 |
|
|
Fall 2016 Re-analyzing dust events from the Taklamakan and Gobi deserts in East AsiaBy Russell Deitrick 
Dust storms associated with the Taklamakan and Gobi deserts in East Asia have gradually decreased in frequency over the last 50 years. Wang et al. (2008) looked at visibility data recorded by 4 weather stations around each desert and found that there is a correlation between the dust events and the global temperature increase--in other words, dust storms seem to have become less common as the planet has warmed (see Figure 1). Indeed, as polar temperatures increase more rapidly than tropical temperature (a phenomenon called "polar amplification"), we would expect that east-flowing winds over Asia would weaken, and consequently dust events would become less common. 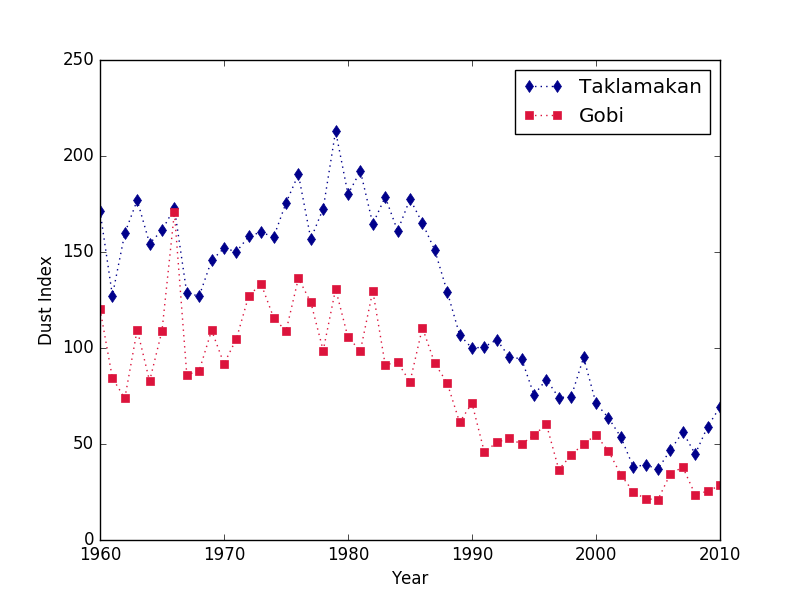 Figure 1: Dust index (a measurement of the frequency of dust storms and low visibility conditions) for each desert, since 1960. Both have declined significantly over this time span. Reproduced from Wang et al. (2008) In spring of 2015, I teamed up with Professor Cecilia Bitz in UW's Atmospheric Sciences department to look at this problem in more detail. We hoped to confirm the results of the Wang et al. paper and isolate the atmospheric properties which might be controlling the dust storm occurrence. In addition to wind speeds, other factors might include soil moisture, temperature, and abundance of arctic sea ice, all of which are likely to be related. We did a brief re-analysis of the dust data and looked for correlations with surface temperature, soil moisture, wind speeds, and arctic sea ice. We can confirm the prior results that the decrease in dust frequency does correlate with rising temperatures in Siberia, and thus with global temperature increase (see Figure 2). However, if any of these quantities are directly connected to the dust storm occurrence, we would expect correlations to persist once the global warming trend is removed, and unfortunately, we don't see any statistically significant correlations in that case. 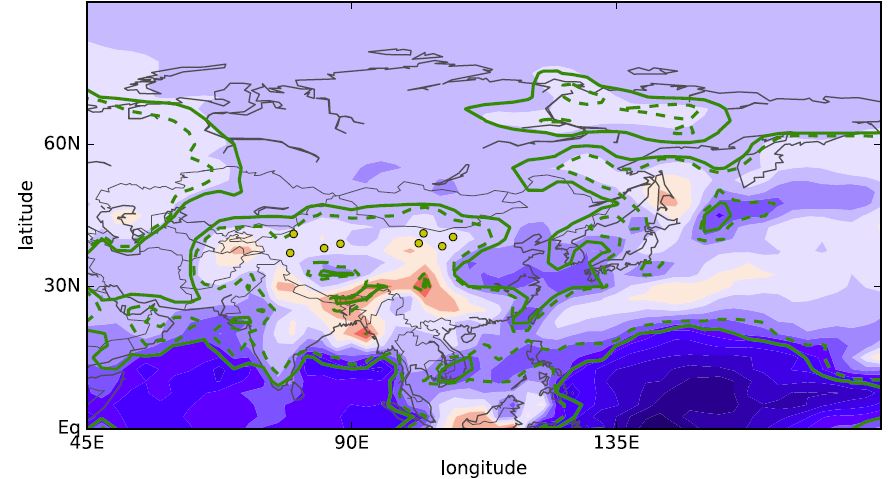 Figure 2: A map of the correlation between temperature and dust index (dust frequency), centered over Asia. Green curves indicate statistical significance. The weather stations in each desert are marked with yellow dots. Like Wang et al. (2008), we find a that the dust frequency is anti-correlated with the temperatures in Siberia (large blue region bounded by green curves)--as temperatures there rise, the dust storms become less common. Unfortunately, once long-term global trends are removed, we do not see any correlation between these quantities It may be that the data we have is just too limited to form any clear conclusions--most of the data sets begin in the 1950s, and most are not considered reliable prior to 1978. At the very least, these results highlight the importance of detrending and the need for a longer time baseline in all climate data. About the author: Russell Deitrick is a fourth-year Dual-Title Astronomy and Astrobiology PhD student at the University of Washington and a member of the NASA Astrobiology Institute's Virtual Planetary Laboratory, which is headquartered at the University of Washington. |
|
