Using analyses of images and spectra of selected galaxies, the students will
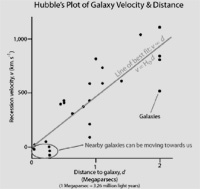
In the 1920's, Edwin P. Hubble discovered a relationship that is now known as Hubble's Law. It states that the recessional velocity of a galaxy is proportional to its distance from us:
ν = Hod [Eqn. (1)]
where v is the galaxy's velocity (in km/sec), d is the distance to the galaxy (in megaparsecs; 1 Mpc = 1 million parsecs), and Ho is the proportionality constant, called "The Hubble Constant." Hubble's Law states that a galaxy moving away from us twice as fast as another galaxy is twice as far away as that galaxy (or, three times faster is three times farther away than another galaxy, etc.). The Hubble constant is a hotly contested quantity in astrophysics. In order to precisely determine the value of Ho, we must determine the distances to and velocities of many galaxies, preferably those extremely far away so that we get beyond the Milky Way's gravitational interaction with "nearby" galaxies.
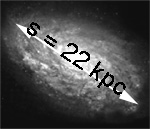
A trickier task is to determine a galaxy's distance, since we must rely on more indirect methods. One may assume, for instance, that all galaxies of the same type are the same physical size, no matter where in the Universe they are. This is known as "the standard ruler" assumption. To use this assumption, however, we have to know the actual size of the "ruler" and to do that, we need the distances to the galaxies that form our standard ruler. So, since we are working with spiral galaxies, we choose nearby galaxies such as Andromeda, Triangulum, Messier 81, and others to which we have found an accurate distance measure using variable stars or other reliable distance indicator. We find that, on average, the actual size of these standard ruler galaxies is 22 kiloparsecs (22 kpc or 22,000 parsecs or ~72,000 light years).
Theoretically, then, to determine the distance to a galaxy one would need to measure only its angular size and use the small angle formula: a = s / d, where a is the measured angular size (in radians!), s is the galaxy's true size (diameter, 22 kpc in our work here), and d is the distance to the galaxy.
a = s/d or d = s/a [Eqn. (3)]
There is another caveat, however. Each telescope and detector scales the images of celestial objects differently. While the actual angular size of a galaxy does not change, that galaxy might take up 30,000 pixels squared on one detector while on another one (having larger sized pixels) it takes up 5400 pixels squared. Since we may not know anything about the detector ahead of time, we need to figure out how much of the celestial sphere, in radians, is represented by each pixel. We can do this if one of our galaxies has an independent measurement of its angular size. That is the case for NGC 2903, the galaxy that is the closest one in our sample.
Data for NGC 2903 (http://www.messier.obspm.fr/xtra/ngc/n2903.html accessed 9 Feb. 2009):
Right Ascension 9 : 32.2 (h:m);
Declination +21 : 30 (deg:m)
Distance 20,500 (kly);
Visual Brightness 8.9 (mag);
Apparent Dimension 12.6 x 6.6 (arc min)
Taking the apparent dimension along the long axis of 12.6 arc min, and knowing there are approximately 0.00029 radians per arc min, we find that the scale for this telescope and detector is:
12.6 arc min x 0.00029 rads per arc min ÷ 395 pixels = 9.3 x 10⁻⁶ radians per pixel.
Given the distance of 20,500,000 ly or ~6.3 megaparsecs, and using the small angle formula, this gives an actual size for the galaxy of about 23 kpc, close enough to the 22 kpc we've assumed so far.
It is up to you to determine criteria for what defines the edge of the galaxy. Just be consistent from galaxy to galaxy! This may be a source of a systematic error in your lab.
The velocity of a galaxy is measured using the Doppler effect. The radiation coming from a moving object is shifted in wavelength:
![]() [Eqn. (2)]
[Eqn. (2)]
where
λtrue is the true wavelength (equation is sometimes written as![]() or rest wavelength) of the radiation,
λmeasured is the wavelength as measured at the telescope, making
or rest wavelength) of the radiation,
λmeasured is the wavelength as measured at the telescope, making ![]() the fractional
value that the velocity of the galaxy is of the speed of light.
the fractional
value that the velocity of the galaxy is of the speed of light.
In this case, wavelengths are measured in Ångstroms (Å), an outdated unit equal to 1 ten-billionth of a meter (10-10 m). The speed of light has a constant value of ~300,000 km/sec. The quantity on the left side of equation (2) above is usually called the redshift, and is denoted by the letter z.
We can determine the velocity of a galaxy from its spectrum by measuring the wavelength shift of an absorption or emission line whose wavelength is known and solve for the velocity, v. (If you are unsure about where to click on the spectrum, please review these detailed instructions.)
|
You may choose to work alone or with a partner on the data gathering part of the exercise.
When you click on the galaxy's spectrum link, you will see the full optical spectrum of the galaxy at the top of the spectrum page. Below it are enlarged portions of the same spectrum, in the vicinity of some common spectral features. The small vertical bars near the lower left corners of these spectra indicate the true (rest) wavelengths of the lines. Do not click on these vertical bars as they are not the redshifted wavelengths!
REMEMBER TO SAVE YOUR SPREADSHEET OFTEN!
If using the Hubble's Law EXCEL spreadsheet, follow these directions:
REMEMBER TO SAVE YOUR SPREADSHEET OFTEN! When finished, print your Excel or Google spreadsheet. Please format your spreadsheet so that the information reproduces on only 1 or 2 sheets of paper. |
| If using the Google spreadsheet, you may have to download and save it as an Excel spreadsheet or ask your instructor Dr. Larson to email a copy to you. We couldn't get the permission to include the entire class without entering 250 email addresses. |
If using the method whereby everything is done by hand and calculator, follow the directions linked here.
If the universe has been expanding at a constant speed since its beginning, the Universe's age would simply be 1/Ho.
| EXAMPLE: Your Hubble constant is 75 km/sec/Mpc,
then:
1/75 = 0.0133 = 1.33 x 10⁻² |
|---|
1. Please show sample calculations for one of your selected galaxies that displays the full logic for determining the distance to the galaxy, the redshifts for each of the 3 spectral lines, the average redshift, and the recessional velocity. If using the Excel or Google spreadsheet, make sure the values agree!
2. What are your values for the Hubble constant and the age of the Universe? Quantitatively (use ratios) compare your maximum age for the Universe to the age of the Sun (5 billion years), and to the age of the oldest stars in the Milky Way (approximately 12.5 billion years). Comment on your findings.
3. What happens to the calculated age of the Universe if the Hubble constant were to be larger than what you found here? How about for a smaller Hubble constant? (That is, would the age of the Universe increase or decrease if your constant were 85 km/sec/Mpc instead of 75 km/sec/Mpc? How about if your constant were 65 km/sec/Mpc instead of 75 km/sec/Mpc?)
4. Why does the best-fit line to your data need to go through the origin of your graph? Where is this "origin" located in the Universe?
5. The long-standing view of the universe before Edwin Hubble was that everything was standing still. Discuss how your analysis either supports or refutes this claim.
6. Which assumption that we made in this analysis do you think carries the most uncertainty? Do you think any error resulting from this uncertainty is enough to change your answer to question #3? Explain.
Theoretically, your plot should be a straight line, but it probably isn't. Let's consider a few of the possible sources of error.
7. The formula you used to determine the distances to these galaxies was distance = actual size of the galaxy divided by measured angular size: d = s / a. Is the distance calculated proportional to or inversely proportional to the actual size we assumed for the galaxies? How would an over-estimate or an under-estimate of the assumed actual diameter of a galaxy affect your estimate of the distance to it?
8. Is the distance calculated proportional to or inversely proportional to the angular size we measured for the galaxies? How would an over-estimate or an under-estimate of the measured angular diameter of a galaxy affect your estimate of the distance to it?
9. Pertaining to the previous question, what would be the effect on your value for the Hubble constant of your consistently under-measuring or over-measuring the angular diameter of the galaxies?
| Possible processes for answering question 8: You could combine two equations here, either mathematically or logically, and answer. Mathematically: d = s / a and v = Ho x d. Substitute “s / a” for d in the Hubble law, solve for Ho, and explain the result. Mentally: If you consistently under-measured the angular diameter, will the galaxies having a given recessional velocity be calculated to be nearer or farther? If you consistently over-measured the angular diameter, will the galaxies having a given recessional velocity be calculated to be nearer or farther? Relate how both of these scenarios would individually affect the Hubble's constant. |
10. Summarize what is meant by “Hubble's Law” and how the relationship was discovered. Include in your discussion here an explanation of the impact that the observations made by Edwin Hubble and by astronomers using the Hubble Space Telescope had on our view of the Universe. What is the currently accepted value for the Hubble constant? How does your value compare? Include any closing comments if you'd like. This is a writing exercise, so please express yourself clearly and concisely. Include a bibliography.
Congratulations. You have now earned your first cosmology badge! ![]()