|
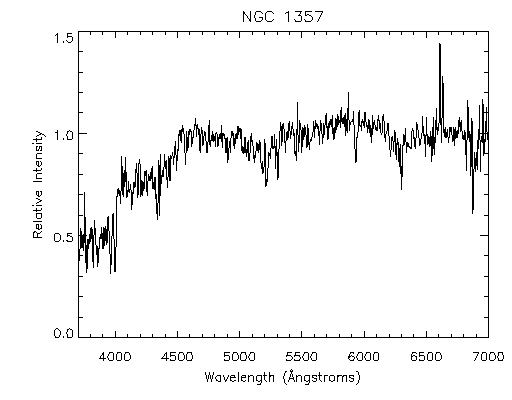 |

NGC 1357 Right Ascension = 3:33.2, Declination = -13:40 (2000.0)
- Start by measuring the positions of the calcium H and K absorption lines. To do this, click on the deepest part of each line. Enter the wavelength values into your data table.
- Next, locate the Hα emission line and click at its highest peak. Record that wavelength value in your data table.
- Finally, calculate and compare the red shift (Z) for the 3 lines. Are they comparable? (For example: 0.0032 and 0.0045 are comparable; but, 0.0451 and 0.0023 are not. Check your measurements with your instructor.)