Frame 1 --- coastal area at time t = 300.00000
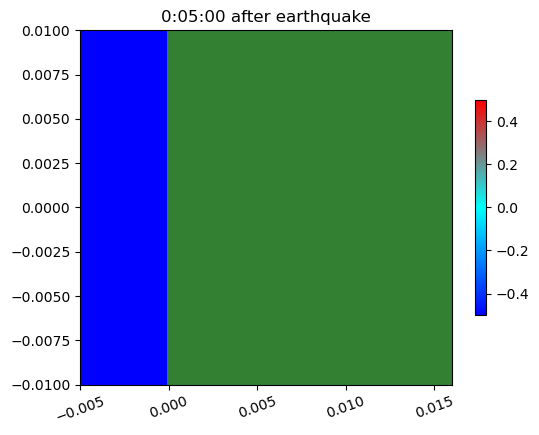
Image source: /Users/rjl/clawpack_src/clawpack_master/geoclaw/examples/tsunami/eta_init_force_dry/_plots_1/frame0001fig11.png
Other figures at this time: Computational domain coastal area All Figures
Other frames: 0 1 2 3 4 5 All Frames