These plots are based on the NCAR historical climatology data set of ca. 2800 met stations with long-term station pressure records. For each station we know the lat, long, elv, and mean station pressure. So these data can be used to test various global approximations for converting elevation to atmospheric pressure in the calculators.
OK, start with the ICAO standard atmosphere. This plot compares the 'true' production rate scaling factor (for spallation), calculated according to Lal/Stone with the measured station pressure, with the scaling factor calculated by using the station elevation and the standard atmosphere to determine the station pressure. Black dots are stations where the standard atmosphere derived production rate is within 5% of the 'true' production rate. Red circles show where using the standard atmosphere overestimates the production rate by more than 5%, blue circles where it underestimates the production rate by more than 5%. We are ignoring anything south of 60 S.
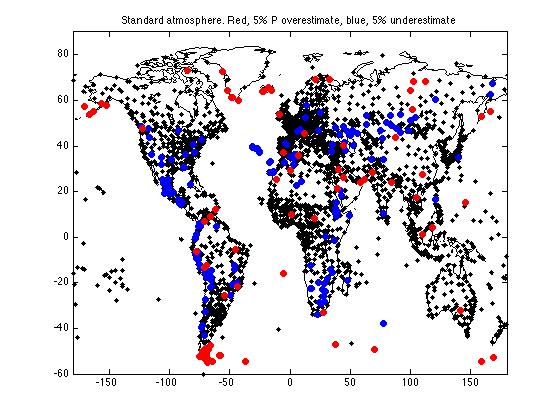
Also, the residuals are skewed toward an underestimate -- they have mean -0.9 % and stdev 3.4 %. See below.
Now, use the long-term mean sea level pressure derived from the NCEP reanalyses as input to the standard atmosphere equation, but don't change the temperature or the lapse rate. This is what is in the present online calculators.
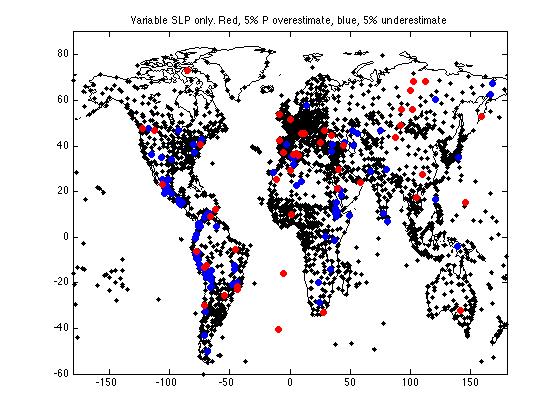
This does better. Residuals are now 0.2 +/- 2.7 %.
Now, vary the sea level temperature as well by using the 1000 mbar temperature from the NCEP reanalysis as input.
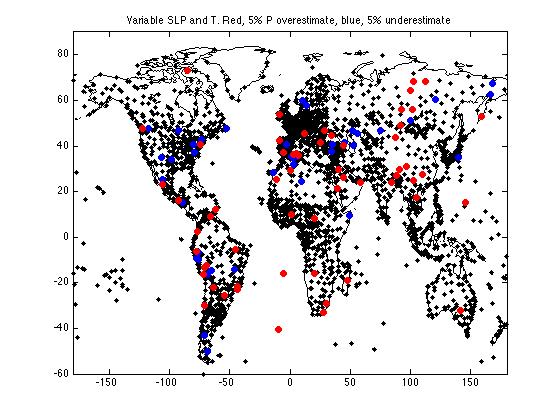
Even better. This centers the residuals, removes a strong bias at high elevation, and reduces the standard deviation of the residuals to 2.3 %. So sea level temperature is important. Given that many of the station pressure records have interannual variability of a couple of mb, which is a couple of percent in the production rate, I am not sure you can do much better than this with a global approximation. So obviously this should be put into the online calculators.
This shows the same thing, with all the stations plotted by elevation vs. the deviation of the predicted production rate from the 'true' production rate. Red dots, standard atmosphere, green, varying SLP only, red, varying temp as well.
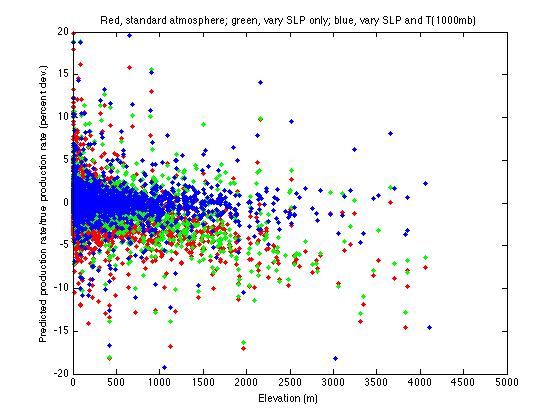
One more possible trick would be to vary the lapse rate as a function of the temperature, which is physically what ought to happen. This would further act to lower pressures at higher elevations, but less so. It doesn't have a perceptible effect.
Also, the NCEP reanalyses also report pressure level elevations at standard pressure levels, so it would also be possible to get the P(z) relationship from this. Haven't tried this yet.