Health-Care Associated Infection Surveillance Part 2
In the previous Surveillance module, you learned about the first phase of surveillance: planning. In this module you will learn about the next few steps, namely data collection, analysis and interpretation.
Learning Objectives
By the end of this module, you will be able to:
- describe the health care-associated infection (HAI) data collection process;
- identify sources of HAI surveillance data;
- explain different types of surveillance methodology for data collection;
- collect appropriate numerator and denominator data;
- explain the methods for assessing the quality of surveillance data;
- describe how surveillance data should be analysed;
- explain HAI risk stratification; and
- interpret HAI infection rates.
Learning Activities Estimated time:
-
Newsha’s Story Part 2 (5 min)
A month has passed since little Nima died. Luckily Puya made it and has been discharged from the hospital. In the meantime, Newsha has developed a surveillance protocol, trained a few nurses in the neonatal ward and has started thinking about a few indicators to monitor. She managed to convince the doctors of the neonatal intensive care unit (ICU) and they are actively helping the nurses in collecting the data. However, she failed to convince the famous Professor Dastaviz, head of the neonatal ICU. According to the academic, he runs a perfect ward and an infection is just impossible on his watch.
Nelya and other colleagues have a meeting with Newsha to go through the monthly numbers. They registered 6 cases of infections in the neonatal ICU. Five of them were babies a few days old who were born in the hospital and were healthy when discharged, but then developed a high fever and were brought back to the hospital. These 5 all had the same microorganism: methicillin-resistant Staphylococcus aureus (MRSA). Given that they were home for 1—3 days after birth in the hospital, a debate ensues on how to classify them: health care-associated or community-associated? That’s when Nelya had an intuition: these babies were born in the ward run by Professor Dastaviz! What if there was a connection?
Hence, they agree on the best way to analyse the data to understand if the source of the infection was at the hospital and which ward it could be. They use risk-adjusted rates, compare them with other wards and with similar wards across the district (luckily, they chose a standardized approach) and it becomes clear that it is indeed possible that the infections were acquired in Professor Dastaviz’s ward!
-
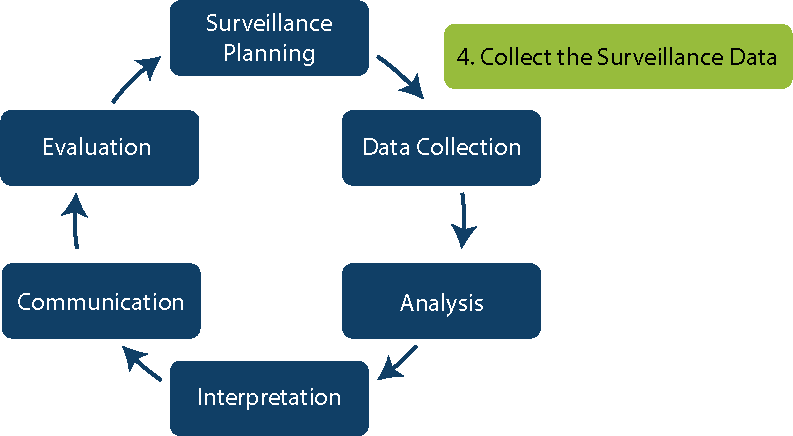
Step 4: Data Collection (5 min)
Now that you have learned about how to plan your surveillance activities (steps 1—3), we will turn to the next step: data collection.
The infection prevention and control (IPC) team or focal person should work with the IPC committee, clinicians, microbiology laboratory staff and data managers to select and review sources of data. When planning to collect data, make sure the following activities will be addressed:
- developing a surveillance protocol
- creating or adapting practical data collection forms (which will be discussed later)
- identifying a data collection system
- training surveyors
- emphasizing data quality (to ensure that no one forgets to report cases).
-
How to Measure Surveillance Outcomes (5 min)
To measure surveillance outcomes, it is important to know the numerator and denominator, which will help you estimate the risk of HAI in your facility or the rate for the indicators you have chosen to measure. You can then use this information to analyse HAI in real time (providing a snapshot of your current situation), to measure the success of interventions by comparing data before and after the intervention, and for benchmarking.
The numerator (N) is the number of patients who develop infections or the number of infections detected (overall infections or a specific type). In other words, it is the “event” being measured. The denominator (D) is the number of patients at risk or the number of procedures in the follow-up period (for example, the total admissions or the number of patients who had surgery and completed follow up). Knowing these numbers allows us to calculate the risk (N/D).
Collecting Numerator Data
In HAI surveillance, the three main numerators that we collect are
- the number of patients with at least one HAI;
- the number of HAI identified through active surveillance (e.g., central line associated bloodstream infections [CLABSI], catheter-associated urinary tract infections [CAUTI], ventilator-associated pneumonia (VAP), surgical site infections [SSI]); and
- the number of HAI identified by laboratory results alone (e.g., Clostridium difficile infection (CDI), MRSA, vancomycin-resistant enterococci bloodstream infections).
As discussed in the previous section, IPC monitoring can be combined with HAI surveillance and complement it. Thus, numerators can also be care practices, processes or structure indicators (e.g., number of hand hygiene actions performed, number of single-bed rooms available for isolation).
The more information you collect, the better it will be for the accuracy of the HAI diagnosis and analysis, and thus it will increase the quality of data. But remember, it is a balance between the right amount of information and too much information; too much information can be resource intensive and may not be used.
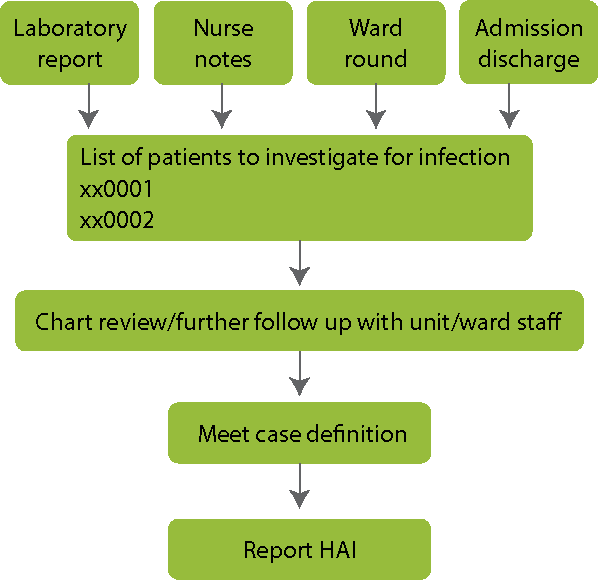
Thorough collection of complex data will provide a more complete picture of HAI. As shown in the diagram below, start with data sources, such as laboratory reports and nurse notes, to identify which patients to investigate. Then conduct a chart review or further follow up with staff. Narrow down the list of suspected cases by applying the case definition. Finally, report all cases with HAI.
Collecting Denominator Data
The denominator is the count of patients at risk of acquiring a HAI, or the count of procedures at risk (for instance, surgical procedures when calculating SSI rates). To calculate the denominator, total the daily counts at the end of the surveillance period.
For HAI associated with specific devices (e.g., indwelling urinary catheters, central venous catheters), collect daily total numbers of patients admitted and total number of device-days (also called device-associated HAI).
For HAI related to surgical procedures, collect data for the total number of patients who underwent surgery and completed follow up and the number of surgical procedures in the surveillance period. Every operation is different, and some patients have a higher risk of post-operative complications than others. Patients should be separated in different risk groups for comparison (i.e., risk stratification) by using information such as type/duration of procedure, wound class, and American Society of Anesthesiologists (ASA) scores (e.g., National Nosocomial Infections Surveillance System [NNIS] risk index).
-
Protocols & Forms (5 min)
WHO, the United States Centers for Disease Control and Prevention National Healthcare Safety Network (CDC NHSN) and the European Centre for Disease Prevention and Control (ECDC) have surveillance protocols and forms that you can adapt to your local setting. There are also open access, free electronic surveillance data collection systems. For example, ECDC HelicsWin.Net is an electronic HAI surveillance collection system, open access and a standalone application. It provides specific modules for each type of surveillance system, including SSI, CDI, ICUs, point prevalence surveys (PPS) and antimicrobial use. HelicsWin.Net also provides real-time feedback at the facility on a national and potentially international level. Similarly, the CDC NHSN HAI surveillance protocol includes specific collection forms for each surveillance type. WHO provides collection forms for SSI perioperative and post-operative data that have been tested and validated.
See the resources page to download the surveillance forms. Many of these have instructions on how to fill in the forms.
-
Data Quality (5 min)
When we talk about data quality, we refer to the degree to which the data represent reality. When we talk about poor data quality, we mean that the data do not reflect the real world. Many factors can contribute to poor data quality, including missing or incomplete data, failure to use standard definitions, poor lab/microbiological support or validation of test results, and untrained data collectors.
Incomplete or delayed reporting could be due to:
- surgeons not realizing that they have to report SSI; or
- ICU staff being fully occupied with urgent patient care needs and not completing surveillance forms in a timely fashion.
If the status of HAI is unknown, then exclude the patient from both numerator and denominator in rate calculations. If the number of missing patients at risk who are excluded is greater than 20% of the total, then validity may be biased and should be reported: for example, “23% percent of patients at risk were excluded from rate due to missing observations”.
To ensure data quality, hospitals should keep track of the most frequently missing types of data and enhance efforts to ensure completeness. Hospitals can also conduct audits to ensure all data items are collected and that the dataset is complete. Lastly, data quality can be ensured by assessing timeliness of case documentation by calculating the time from onset of infections to the time when they are entered into the surveillance dataset.
Valid or accurate data are considered correct; that is, the data measure what they are intended to measure. Accurate data minimize errors, such as mistakes caused by the instrument or test used for the measurement, misrecording results, or mis-entering the results into an electronic system — to the point of being negligible. -
Case Study (5 min)
A tertiary hospital in your country has a neonatal and paediatric ICU. Surveillance data from the year before identified the following areas of risk:
- CLABSI: 87% of primary bloodstream infections (BSI) are associated with central line catheters.
- VAP: 34% of all cases of pneumonia are associated with the presence of ventilators.
- CAUTI: in the ICU, 97% of urinary tract infections are associated with the presence of catheters.
- Antimicrobial use is high, as well as antimicrobial resistance.
- The number of SSI in the paediatric ICU is high.
-
Methodology of Data Collection (10 min)
Having a standardized method for collecting data is important. Each method has pros and cons, but whatever the surveillance team chooses, consistency is crucial for comparability in time and between places. When selecting the type(s) of HAI to survey and method of surveillance for your facility, take the following factors into consideration:
- frequency of HAI and/or medical risks to patients (e.g., higher need for invasive devices, surgical/oncology patients);
- costs of HAI (e.g., treatment, length of stay, mortality, severity);
- preventability and association between process and outcomes;
- type of health care facility (acute care facilities usually provide critical care, so surveillance can be targeted to critical care wards; surveillance can be extended to hospital wards using invasive devices);
- status of hospital microbiology laboratory (the minimum requirement is that the laboratory can identify the pathogen and conduct susceptibility testing and quality control); and
- priorities established by the health care team and the organizational goals.
Click or tap on each tab to learn more about the methodology and its pros and cons.
Incidence vs Prevalence Surveillance
Incidence is the number of people in a population who develop a disease over a specified period of time.
Calculation:
New events population during time periodExample:
Number of new patients with CAUTI all patients at risk for CAUTI (with urinary catheter)Incidence surveillance can be done prospectively or retrospectively. However, collecting information retrospectively makes it harder to assess data quality, since it is difficult to know the number of cases and how they are reported. Though collecting prospective incidence is more reliable, it is much more resource intensive. It involves daily review of medical records and visits to patient wards and/or care units to assess patients at risk of HAI. Case finding by an IPC professional increases HAI detection. Prospective incidence surveillance is the best way to establish trends of HAI incidence over time and to study specific types of infection which require follow-up with patients at risk (e.g., SSI).
Prevalence is the proportion of people in a population who have a disease at one point in time.
Calculation:
New and existing events population at a point in timeExample:
Number of patients with CAUTI all patients with urinary catheters on June 30In prevalence surveillance, surveys are conducted on a single day or week. While this type of surveillance provides data only at the time it was conducted, it can be repeated at regular intervals to show change. It can be used to target areas or services where infection rates are known or suspected to be high, and it may be quicker and less expensive than incidence surveillance. However, prevalence surveillance can underestimate the true status of infection. It is not appropriate to use in hospitals where patient records do not include detailed information on demographics, or clinical, laboratory and radiological results.
Passive vs Active Surveillance
In passive surveillance, data are generated from routine patient records or reported from laboratories and health care providers without intervention by the surveillance team. It is less demanding than active surveillance and may be the only feasible method in settings lacking expertise and resources.
In active surveillance, trained personnel (e.g., the IPC team) actively search for new infections. They look for evidence to meet standardized diagnostic criteria of HAI by using a variety of data sources. It is generally used for brief periods of time (e.g., outbreaks).
The table below lists the advantages and disadvantages of active and passive surveillance.
Active Surveillance Passive Surveillance More complete reporting X More timely and accurate information X More representative data X Better data quality X Less resource intensive X Underreporting more common X Simpler and less work X Inexpensive X Less time consuming X Prospective vs Retrospective Surveillance
In prospective data collection, data collectors go on ward rounds, interview clinicians and monitor current patient records.
In retrospective data collection, past medical records (post-discharge) are reviewed.
The table below lists the advantages and disadvantages of prospective and retrospective surveillance.
Prospective Surveillance Retrospective Surveillance Quickly detects clusters/outbreaks X Good for high-risk patients X Less time consuming X Less resource intensive X Difficult to obtain missing data* X *Especially after patients have been discharged Hospital-Wide vs Targeted Surveillance
With hospital-wide surveillance, data are collected on all infections, sites and units to establish comprehensive baseline rates.
Targeted surveillance is a more focused and feasible alternative to hospital-wide surveillance. It focuses on patients at risk of infections with known control measures to reduce risk of infection and can help you determine a valid denominator. Unfortunately, it can miss clusters or outbreaks in other patients. If reporting requirements are too labour-intensive, surveillance can limit other HAI prevention activities.
The table below lists the advantages and disadvantages of hospital-wide and targeted surveillance.
Hospital-Wide Surveillance Targeted Surveillance Quickly detects clusters/outbreaks X Provide baseline rates X Help determine valid denominator X Less resource intensive X Provides too much data X Objectives more well defined X Laboratory vs Patient-Based Surveillance
Relying on laboratory-based case findings will mean that your surveillance is based only on positive lab findings, without reviewing clinical findings or results of other diagnostic or therapeutic tests. Some events, such as pneumonia, will be grossly underestimated using only laboratory-based surveillance.
Patient-based surveillance, on the other hand, includes clinical data and monitors patients for events, risk factors, and procedures and practices related to patient care. It requires visits to patient care areas, review of patient charts and records, and discussions with caregivers.
Risk-Adjusted vs Crude Rates
A crude rate is the rate (the number of cases divided by the total population) of observed events (that is, cases) in a population over a given time period. Crude rates are not useful for making comparisons between groups or examining changes over time because the total population structure may change.
A risk-adjusted rate is the rate that is standardized to a population, which is defined as the control population. Standard populations, often referred to as standard millions, are the age distributions used as weights to create age-adjusted statistics. When using the same standard population, risk-adjusted rates allow comparisons between different populations because they take into account the differences in population structure.
Some hospitals or units are more likely to report higher infection rates than others due to factors beyond their control. For example, a hospital performing many surgeries might report more SSI than one where few procedures are performed. Patient factors also contribute to infections including prior health history, age, complications, smoking and obesity. Risk-adjusted models are developed based on the ward or unit, the procedure and various patient factors in an attempt to correct for risk and improve data validity. However, adjustment does not entirely eliminate differences between facilities that result from different risks.
Data that are collected after a specific date (so only new data).Data that have already been gathered before the current date, such as past patient records. -
Knowledge Check (5 min)
In the graph below, each horizontal line represents a patient that has had a HAI. The length of the line is the duration of that HAI.
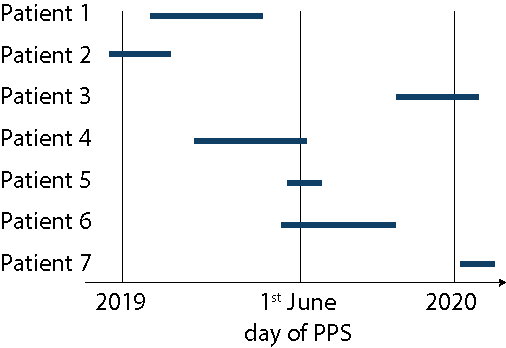
In the graph below, each horizontal line represents a patient that has had a HAI. The length of the line is the duration of that HAI.
-
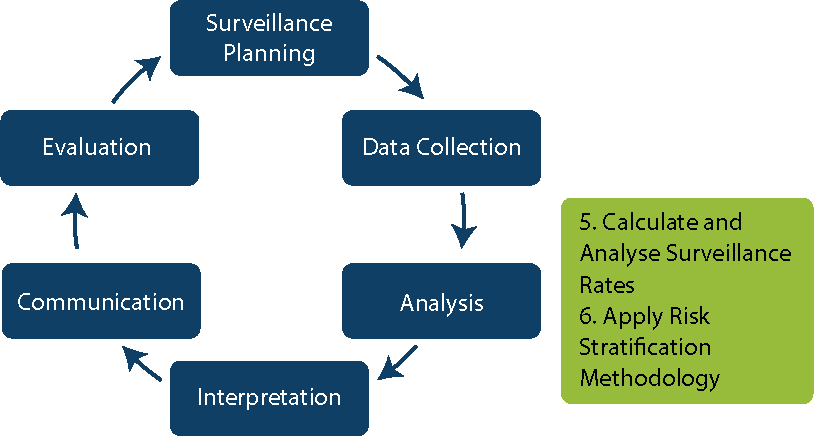
Step 5: Data Analysis (5 min)
Let us move on to analysing data. Though you will not learn how to analyse data in this module, it is important to have some basic understanding of what happens during this step.
Who should manage and analyse HAI surveillance data? The best person would be an IPC team member with:
- a basic epidemiology background (particularly in surveillance methods);
- experience with data entry and management;
- expertise in appropriate statistical analysis and risk adjustment methods; and
- proficiency in using computer technology to collect, enter, store, manage and analyse data.
Calculating Rates
If you have conducted active prospective surveillance, you will be calculating incidence rates:
Number of new infections acquired over a period of time number of patient days over a specified period of time
Disease frequency population at risk over time period (e.g., patient-days)If you have conducted prevalence surveys, you will be calculating prevalence proportions:
Disease frequency population at risk at one time (e.g., number of patients admitted on day of survey)Device-related infection-specific rates:
number of infections (e.g., CLABSI, CAUTI, VAP) total number of device daysIt is important to ensure the accuracy of rate calculations. Preprogramed HAI rate calculations in a computerized system (such as HelicsWin.Net) or spreadsheet can prevent miscalculations and save time, but the results should be double checked. For example, one person on the IPC team could analyse the data. Another team member could review and, if necessary, recalculate the rates and indicate the need for additional training or practice on proper rate calculations.
-
Step 6: Risk Stratification Methodology (5 min)
In step 6, you will apply risk stratification methodology.
Risk indices are used to combine several risk factors for a particular infection that reflect a certain “risk of infection”. They use validated risk indices for predicting risk of infection. There has been limited progress achieved in developing practical risk indices that correlate with risk of HAI. One example is the NNIS risk index developed by the CDC NHSN for classifying patients into different risk groups for SSI. It includes three indicators:
- surgical wound class (contaminated, dirty or infected=1 point; clean or clean-contaminated=0 points);
- ASA score (3,4 or 5 = 1 point; 1 or 2 = 0 points); and
- duration of operation (operation longer than 1 hour = 1 point; shorter than 1 hour = 0 points).
Unfortunately, some studies questioned the actual usefulness of this method. In addition, the collection of data to enable the calculation of this risk index may be considered unfeasible in settings with limited resources. A simpler option is to stratify patients according to elective and emergency surgery, which can provide some risk consideration for SSI.
-
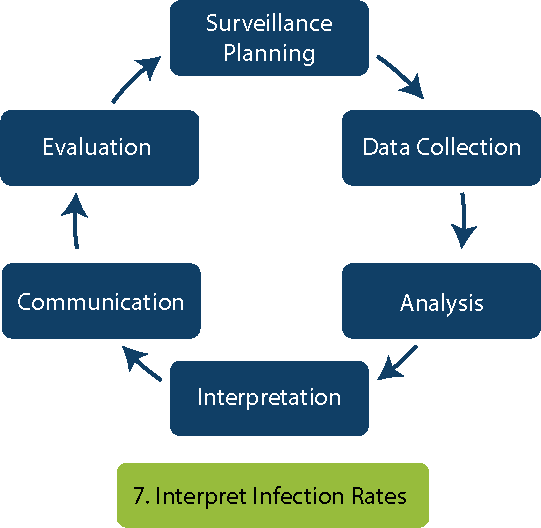
Step 7: Interpretation (5 min)
After analysing the data, you will need to interpret it.
HAI rates may be compared to previous HAI data based on time periods (month, quarter, or year — excluding months with outbreaks), or compared between different wards or facilities. You can also compare HAI proportions from the last prevalence survey. For an effective and accurate comparison, use the same case finding methods and definitions. Data interpretation should aim to identify areas where improvement is needed to lower the risk of HAI.
Let us practice interpreting the graph below.
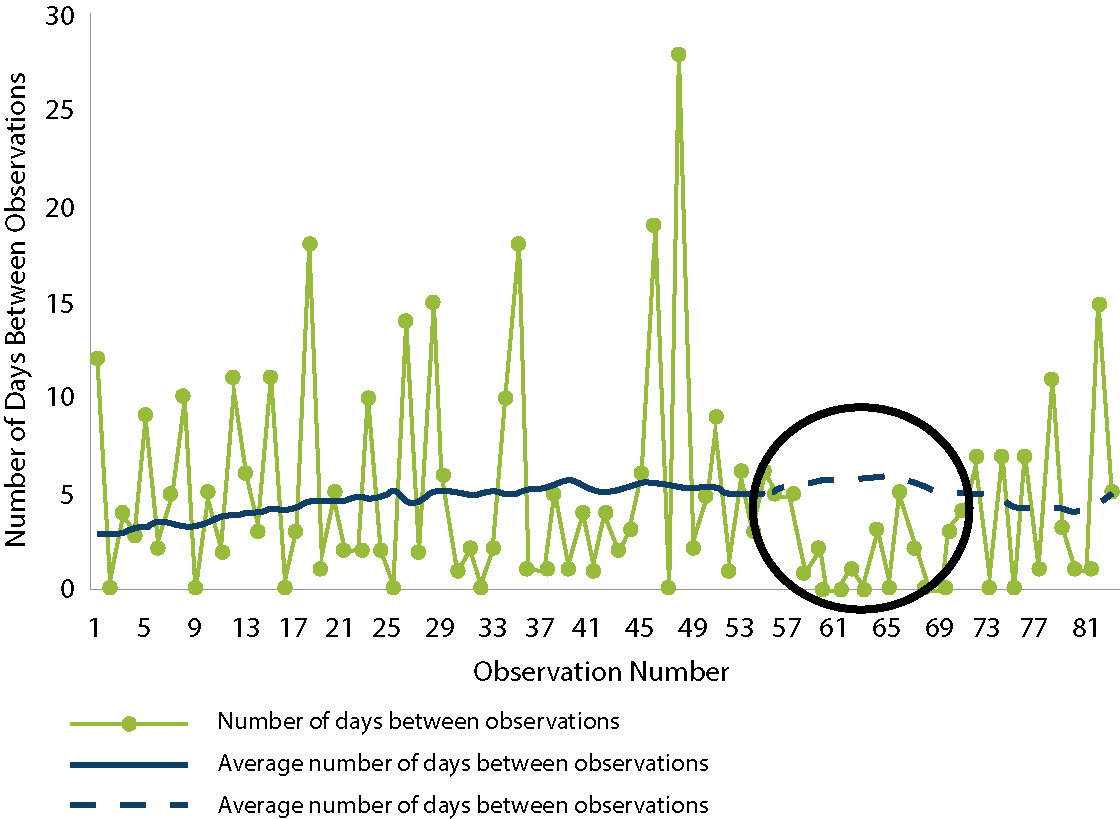
The first step is to look at the x- and y- axes and determine what they measure. In this graph, the x-axis shows the observation number, and the y-axis shows the number of days between observations.
Next, determine what the lines in the graph represent. According to the legend, the green line with a dot is the number of days between observations. Each dot corresponds to a HAI. The higher the dot, the more days that have passed since the previous HAI. The average number of days (which are the blue lines) are based on historical data.
In the circle, the number of days between observations 57—69 is below the average (the dotted line), which indicates more than 8 successive observations of HAI are very close to each other. This is a red flag for possible outbreaks.
Interpreting HAI surveillance data requires not only technical expertise, but also critical thinking. An IPC team member’s daily activities provide a good idea of the types of infections to be expected, so IPC members can assess whether the rate of infection seems reasonable based on their experience. An unusually high rate should be reported and an outbreak investigation should begin (if indicated). If you note major changes from baseline HAI rates, it is essential that you conduct an investigation. For some microorganisms, a single case can trigger a response (e.g., Ebola or carbapenem-resistant Enterobacteriaceae in a nonendemic context).
It is important to use caution when interpreting changes in HAI rates. Infection rates may vary from previous data due to:
- seasonal variations: (such as acute respiratory infections);
- weekly variations (such as low rates over weekends and high rates at the beginning of the week);
- changes in surveillance methodology or case definitions; or
- random chance.
A test of significance can be used to identify if the infection rate is truly higher or lower than the previous rate (e.g., p<0.05 or 95% confidence interval does not include 1, meaning it is statistically significant). -
Comparing Rates (5 min)
Part of interpreting HAI surveillance data is being able to make comparisons of rates. One of the ways to do this is by benchmarking, which is the process of comparing oneself to others that are performing similar activities for the purpose of improving performance. In HAI surveillance, comparisons should be made only after ensuring that the following conditions are met:
- case finding methods have similar sensitivities and specificities
- the same case definitions are applied
- the same methods are used to calculate rates of infection and to adjust for risk factors.
Having the same approach to the entire surveillance cycle is essential for benchmarking.
Patients served by different health care settings have different risk factors for HAI. Extrinsic risk factors are environment-related, and intrinsic risk factors are patient-related (e.g., underlying disease condition and advanced age). Without adjusting for these factors, comparisons within the same health care facility or among wards or units may be invalid. Having the same surveillance system is not enough: some wards/hospitals might have more patients at risk.
Let us look at an example. A tertiary care hospital has substantially higher HAI rates than a community hospital. This could be due to:
- a higher degree of susceptibility to HAI in the acutely ill population the tertiary hospital serves;
- a higher number of health care workers;
- frequently having students in direct contact with patients at a tertiary care hospital; and/or
- undertaking more invasive procedures at a tertiary care hospital.
You may need to adjust rates by procedure or by patient care unit/ward.
Sensitivity refers to the ability of a test to identify true cases. In other words, it is a measure of how well the test detects people with a disease as having the disease.Specificity refers to the ability of a test to exclude people who do not have the disease or health condition. That is, specificity measures how well the test excludes the people who are not cases. -
MRSA (10 min)
Read the scenario below and answer the questions.
Dr. Ribeiro approaches you in the cafeteria. He mentions that he has seen an increase in patients with MRSA BSI in the medical surgical ICU ward and wants your help to initiate an intervention. You ask him to send you the data he has collected.
He emails you this table:
Month 7 8 9 10 11 12 No. of patients with MRSA BSI 1 1 2 1 3 3 No. of patients admitted to ward 49 48 50 49 41 42 % infected patients 2.2 2.1 4.0 2.2 7.3 7.1 Here is a graph of the data:
Medical-surgical ICU patients with health care-associated MRSA BSI
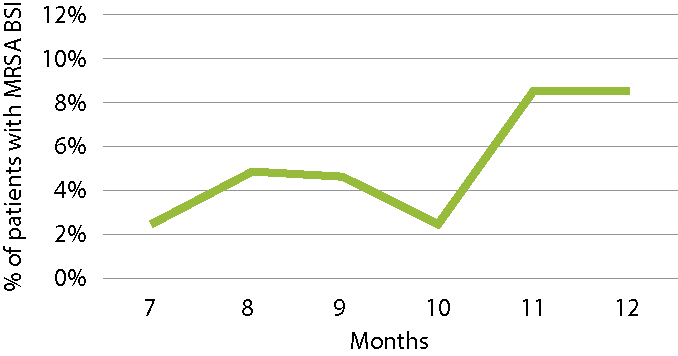
However, this is not sufficient for deducing that there has been a significant increase in MRSA BSI in month 11. MRSA BSI incidence density rates need to be calculated to adjust for the population at risk.
The incidence density rate equation is:
Number of MRSA BSI patients patient days in the ICUThere are 721 patient days in months 7–10 and 743 patient days in months 11–12.
After six months of the intervention, you should calculate the MRSA BSI incidence rates and compare the preintervention period to the postintervention period to assess the intervention’s impact.
-
Summary (5 min)
In this module you learnt about the process of HAI data collection and possible sources where these data could come from or may already have been collected. We covered using numerators and denominators to help you estimate the risk of HAI in your facility. It is crucial to ensure data quality so that you have an accurate picture of which patient has which HAI, as this will help you design effective interventions.
You also learnt about the advantages and disadvantages of different methodologies of data collection:
- incidence vs prevalence
- passive vs active
- prospective vs retrospective
- hospital-wide vs targeted
- laboratory vs patient-based
- adjusted vs crude.
After data is collected, it must be analysed by calculating rates and then interpreted. Data interpretation should aim to identify areas where improvement is needed to lower the risk of HAI.
-
References
Suetens C, Latour K, Kärki T, Richizzi E, Kinross P, Moro ML, et al. Prevalence of healthcare-associated infections, estimated incidence and composite antimicrobial resistance index in acute care hospitals and long-term care facilities: results from two European point prevalence surveys, 2016 to 2017. Euro Surveill. 2018 Nov 15;23(46). doi: 10.2807/1560-7917.ES.2018.23.46.1800516. PubMed PMID: 30458912; PubMed Central PMID: PMC6247459. Erratum in: Euro Surveill. 2018 Nov 22;23(47). doi: 10.2807/1560-17917.ES.2018.23.47.181122e1. PubMed PMID: 30482262; PubMed Central PMID: PMC30482262.