Session 16: Quality Improvement
This session will provide strategies for mapping out key processes in your organization and how to improve the performance of those processes.
Learning Objectives
By the end of this session, you will be able to:
- Define quality improvement.
- Discuss the MoHCC/HEALTHQUAL approach to QI.
Learning Activities
-
Introduction (10 min)
Take a moment to think: What do we mean when we say improvement? What are some of the ways you’ve tried to make improvements in the workplace?
Some improvements that you may have seen range from small things like starting and ending meetings on time to improving the reach of recruitment notification for new hires to reducing client wait times at the clinic.
In this section, we will explore why speeding up a process doesn’t always give a better result and discuss the concepts and strategies for mapping out key processes in your organization and how to improve the performance of those processes.
-
Quality in Health Care (10 min)
Quality is the degree to which a health or social service meets or exceeds established professional standards and client expectations.
It is proper performance (according to standards) of interventions known to be safe, that are affordable to the society in question, and have the ability to produce an impact on mortality, morbidity, disability, and malnutrition. It is the degree to which health services for individuals and populations increase the likelihood of desired health outcomes and are consistent with current professional knowledge.
Quality Improvement is an interdisciplinary process designed to raise the standards of the delivery of preventive, diagnostic, therapeutic and rehabilitative measures in order to restore and improve health outcomes of individuals and populations.
It is the application of appropriate methods to close the gap between current and expected levels of quality and performance as defined by standards. Quality improvement affords the site the techniques to be able to answer the following questions about the service at their site:
- Are clients receiving the care they need?
- Is the care delivered consistent with national guidelines?
- Is care appropriate when given?
- Does the care provided have the desired effect on the health of the clients?
Dimensions of quality
There are many dimensions of quality. Tap on each one below to learn more.
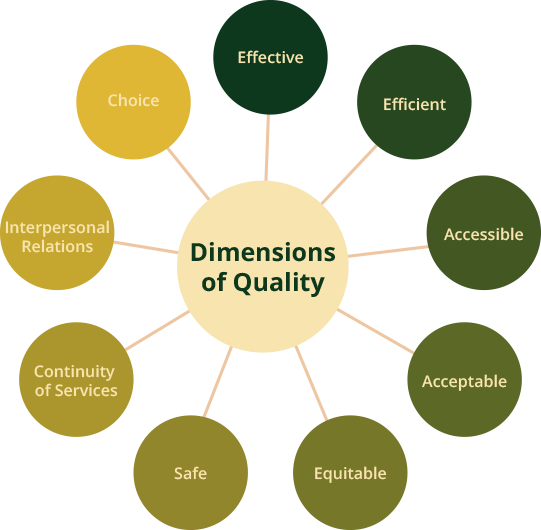
Effective
adheres to an evidence base and results in improved health outcomes for individuals and communities, based on need
Efficient
delivering health care in a manner that maximizes resource use and avoids waste
Accessible
delivering health care that is timely, geographically reasonable, and provided in a setting where skills and resources are appropriate to medical need
Acceptable
delivering health care that takes into account the preferences and aspirations of individual service users and the cultures of their communities
Equitable
delivering health care that does not vary in quality by personal characteristics, such as gender, race, ethnicity, geographical location, or socioeconomic status
Safe
delivering health care that minimizes risks and harm to service users
Continuity of services
consistent care, appropriate delivery of care at site level, appropriate and timely referral, and communication between providers
Interpersonal relations
trust, respect, confidentiality, courtesy, responsiveness, empathy, effective listening, and communication between providers and clients
Choice
as appropriate and feasible, client choice of provider, insurance plan, or treatment
-
MOHCC/HEALTHQUAL Approach to Quality Management (5 min)
MoHCC is committed to quality improvement at all clinical care facilities. These principles include:
- Client focus: Services should be designed to meet the needs and the expectations of the clients/community.
- Focus on systems and processes: Providers must understand the service system and its key service processes in order to improve them.
- Testing changes: Changes are tested to determine whether they yield the required improvement (PDSA cycles).
- Emphasising the use of data: Data are used to analyse processes, identify problems, and to determine whether the changes have resulted in improvement (PM).
- Teamwork: Improvement is achieved through the team approach to problem solving and quality improvement.
One of the exciting things about quality improvement is that it addresses issues within the system rather than individuals or other resources. Quality improvement tends to focus on improving system efficiency and eliminating waste rather than adding inputs or resources into the system.
What is a system?
A system is an interdependent group of items, people, or processes working together towards a common purpose. Tap on each step in the system to learn more.
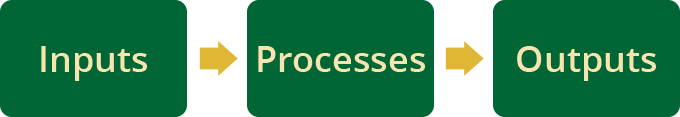
Inputs
The resources necessary to carry out a process.
Processes
A series of steps that come together to transform inputs and outputs.
Outputs
The services or products resulting from the inputs and processes.
It is important to know that interdependence between the components of a system creates a need for communication and cooperation. The greater the interdependence, the greater the need for the parts to work together. The quality of the “output” or “outcome” is not based on the work of individual processes, but how those processes link together. The performance of a system is best understood when seen as a whole (as opposed to individual processes).
If system within a clinic is achieving poor results, it is because the system is currently designed to achieve poor results. For this facility to achieve better results, a better system needs to be set up that is designed for improved results. The example from Nyamupinga Clinic below will illustrate this.
-
Improving Follow-Up of TB Suspects (10 min)
Let’s go through an example of an HIV clinic in which patients were not being followed up properly for suspected TB.
The WHO recommends screening all patients with HIV for TB and recommends following up TB suspects. The TB prevention committee at Nyamupinga Clinic noted that while the facility had a log for tracking TB suspects in which sputum smear results were recorded, the information in this log was not regularly being used to track patients. The committee chair decided to discuss this with the staff of the HIV clinic at a quality improvement/TB prevention meeting. The committee reviewed the log, and two providers realized that they had not had follow-up visits with several patients recorded in the log as TB suspects three months earlier. The committee also observed that only half of patients had any follow-up information recorded in the log.
They recognized this to be a problem, but felt they needed more information to really understand what was going on so that they might think about ways to improve it.
So, what kinds of data would be good for them to collect? What kind of information would help them understand the problem?
What might be good data?
Take a few moments and think about what might be good data to collect to understand the problem at this clinic. What would you want to know if you were a part of this clinic’ improvement team, trying to help make this situation better?
What do you think? Would you want more data at this point? What additional information might you want to have, in order to start making improvements to the situation?
-
7 Steps in Quality Improvement (5 min)
One of the main approaches for QI used in health care settings is using the Model for Improvement. The basic process involves identifying and defining a problem that your team would like to make an improvement to and set up or build on a team to work on the improvement. You write an aim statement and select measures for how you will track your progress towards your aim. Then, you brainstorm ideas for changes you could make that might result in improvement and test those ideas with small tests or PDSAs, tracking your progress as you go. Tap on each step in the graphic to read more.
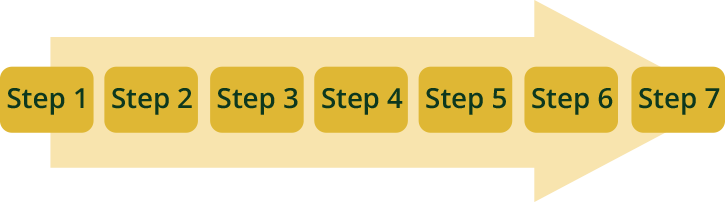
Step 1
Identify and define the problem you want to address.
Step 2
Build a quality improvement team (4-8 people who have a role in the area being improved).
Step 3
Write an aim statement.
Step 4
Choose measurement method(s)—and document your process and outcomes.
Step 5
Brainstorm improvement strategies to test.
Step 6
Test your ideas.
Step 7
Evaluate the strategy and plan for additional study or further action needed.
-
Writing Aim Statements (10 min)
Here is an example aim statement:
“By the end of January of next year (in six months), we will increase the proportion of patients with two-week follow-up information documented in the log from 50% to 95%.”
You can see that this statement was specific with regard to the time frame of the improvement activities, the measure of improvement that they were going to be looking at, and their goal of increasing from 50% to 95% of patients having two-week follow-up documented in the log.
When writing your own aim statements, think about what you are trying to accomplish and make sure it is specific, measurable, actionable, realistic, and time-bound. Below is a formula for writing your own aim statement. By __________(date), we will improve _________ from ________(baseline) to _________(new level).
Let’s practice writing aim statements. In the boxes below, turn each statement into a better aim statement, making it specific, measurable, actionable, realistic, and time-bound and using the formula above. Then tap the compare answer button to read an expert’s answer.
-
The Model for Improvement and the PDSA Cycle (5 min)
The Model for Improvement begins with three simple questions, which gives us information critical to establishing the focusing QI projects and which we can re-visit periodically to ensure we are on track and working toward our intended aims. These three questions are
- What are we trying to achieve? (linked to the aim statement)
- How will we know that the change is an improvement? (measurement)
- What changes can we implement that will result in improvement?
The PDSA cycle is the action portion of the model for improvement. Tap on each part of the cycle to learn more.
Institute for Healthcare Improvement, 2001.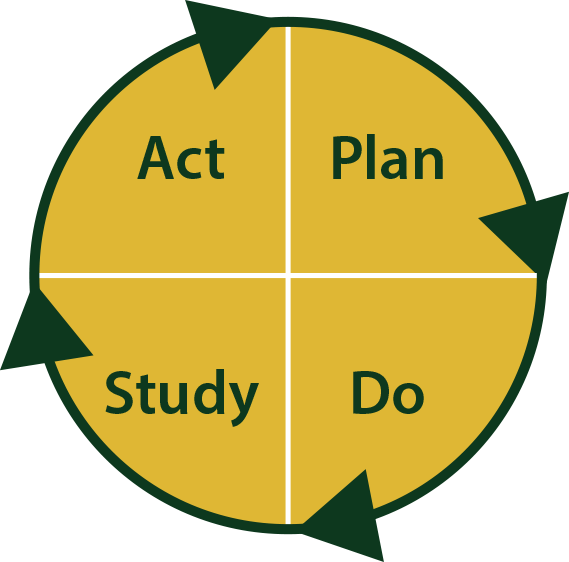
Plan
Decide what change you will make, who will do it, and when it will be done. Formulate a hypothesis about what you think will happen when you try the change. What do you expect will happen?
Identify data that you can collect (either quantitative or qualitative) that will allow you to evaluate the result of the test. Note that we earlier talked about a measurement strategy – how you will know that a change has happened, such as with our TB example. In this case, the data you will be collecting will be much smaller in scope – it could be something like, “Did the outreach workers manage to find patients on the day that they tried the test?”
Do
Carry out the plan. Document the problems you encountered and any unexpected observations. Begin analyzing the data.
Study
Complete the analysis of the data. Make sure that you leave time for reflection about your test. Use the data and the experience of those carrying out the test to discuss what happened. Did you get the results you expected? If not, why not?
Act
Given what you learned during the test, what will your next test be? Will you make refinements to the change? Abandon it? Keep the change and try it on a larger scale? Often, there are several PDSA cycles, trying something and learning from the test, and then trying it again. If the change has resulted in definite improvement, this step also means system-wide adoption of the change.
-
Performance Measurement (5 min)
Testing and learning from our successes and failures is important. Tap on the graphic below to see how multiple PDSA cycles can lead from a small idea to a fully implemented change. This example shows testing the idea of creating a new format for the TB suspects log.
Ramp Concept: Langley et al. 1996. The Improvement Guide: A Practical Approach to Enhancing Organizational Performance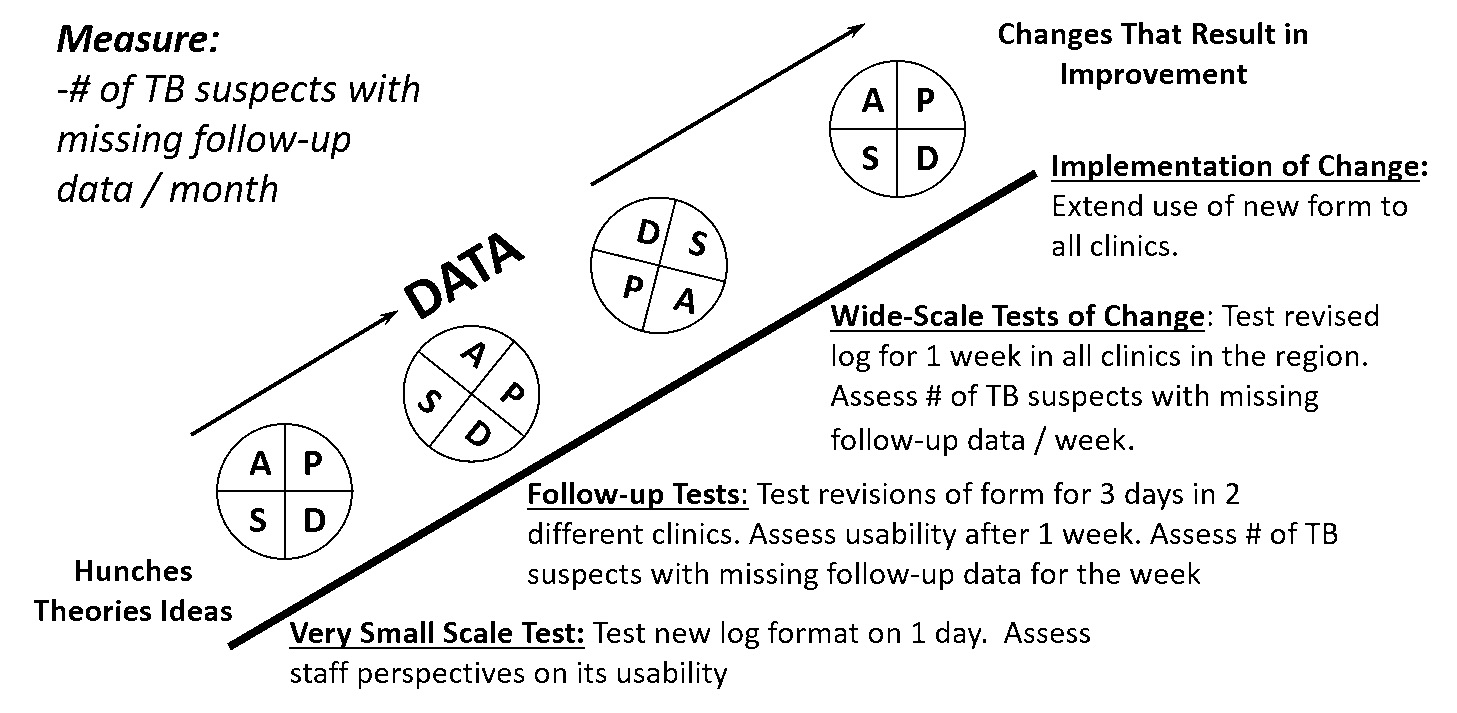
Why measure?
Measurement gives us power. And, it enables us to see if we are improving and separates what you think is happening from what is really happening. Remember, you can’t improve what you are not measuring. Performance measurement establishes a baseline and shows progress over time and helps to avoid implementing ineffective solutions.
Benefits of measuring include:
- Identifies strengths and weaknesses in health care services
- Identifies gaps in standards of care
- Improves documentation systems
- Builds data interpretation skills
- Can lead to development of efficient data systems
- Guides prioritisation of QI activities
What are we measuring?
It is always important to think about measuring the appropriate care versus the quantity of care. For example, did a patient visiting the clinic, post, or hospital receive the care that they were supposed to receive?
Define your eligible population, which is different than taking what exists. For example, what is the likelihood that any patient visiting a facility will receive this care? A more rigorous statistical methodology may be needed to draw this conclusion.
-
Improving Follow-Up of TB Suspects (5 min)
Let’s conclude by taking a look at the measurements shown in a run chart of the HIV clinic’s improvement project over time.
Remember the aim statement? “By the end of January of next year (in six months), we will increase the proportion of patients with two-week follow-up information documented in the log from 50% to 95%.”
The TB committee began measuring their change in June, at a baseline of around 50%, and first tried the weekly log review by the medical director. Then they tried having the log information summarized by the nurse, then revised the log form, and finally involved a community health volunteer to determine patients’ follow-up status.
One way to document tests of change is to use a run chart – with annotations right on the chart (see graphic below). Or you can annotate at the bottom of the chart, showing the change strategy that was tried, lined up with the date on the X axis. You can see from this run chart that although the team did not reach the 95% rate that they had set in their aim statement, they had seen improvement.
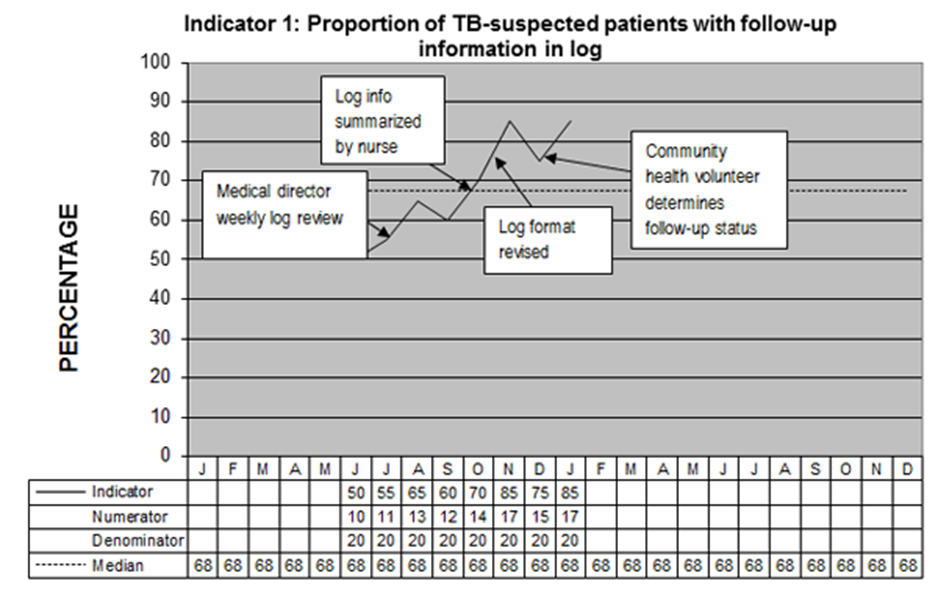
Based on the TB Prevention Toolkit.
-
Knowledge Check (5 min)
-
Key Points (5 min)
- Quality improvement activities look to address issues to ensure that clients are receiving the appropriate care that they need delivered in line with national guidelines.
- MoHCC is committed to quality improvement at all clinical care facilities.