Answer key, practice problems 2000--week 3

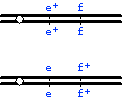
1. (a) The homologs should look like one of the following:

or

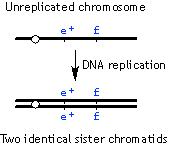
If you are confused, remember that the two sister chromatids arise by DNA replication, and must therefore be identical copies. Unless there has been recombination between two separate homologs, the alleles on the two sisters of a pair have to be the same, e.g.:

(b)

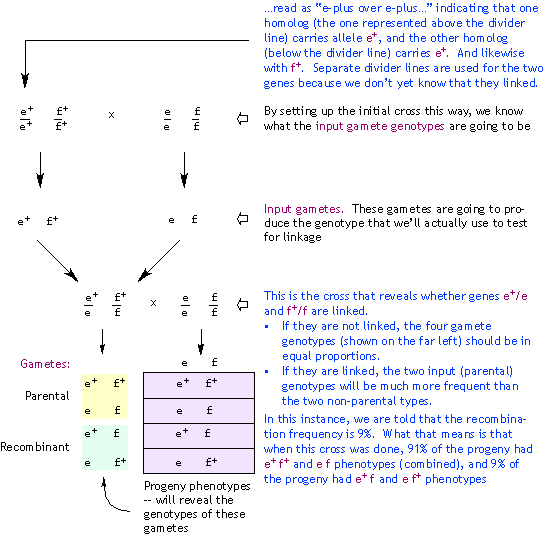
(c) This sentence tells us that 9% of the products of meiosis are recombinant between these two genes? What does that mean in the practical sense? It means that if a fully heterozygous strain is crossed with a fully homozygous recessive strain, 9% of the progeny show evidence of a non-parental combination of alleles. ONE EXAMPLE (other crosses are possible also) of a series of crosses that could be done to reach this conclusion is shown:

As an exercise, draw the whole series of crosses, but begin with genotype e+/e+ f/f in place of e+/e+ f+/f+ (the very first genotype shown in the top left of the diagram). What else would you alter to allow youto look for recombination?

(d) Gene e to gene g map distance is 5 cM (because there's 5% recombination between them), the g-f distance is 4 cM, and the e-f distance is 9 cM. Therefore, gene g must lie between e and f; the map is:
e----------5 cM----------g---------4 cM-------f
|------------------------|--------------------|

2. (a) For X-linked traits, the expectation is that males will be hemizygous -- i.e.,they only have one copy of the gene. In every instance here, both parents have two copies each -- so the genes can't be on the X chromosome.

(b) If the cross is between a complete heterozygote and a complete homozygous recessive, and two of the progeny types are much more abundant than the other two, there must be linkage of the genes being examined in the cross. The more abundant phenotypes indicate the allele arrangement on the homologs of the heterozygous parent, while the less abundant phenotypes are the recombinant ones). If the 4 progeny phenotypes are equally abundant (1:1:1:1 ratio), the loci are assorting independently, so we don't have enough information to identify the parental genotpes.
(i) Among the progeny, se+ h+ and se h are much more abundant than the other two phenotypes. Therefore, the allele arrangement must be se+ h+/se h (i.e., se+ and h+ on one homolog, se and h on the other)
(ii) Cannot tell
(iii) b+ rd/b rd+
(iv) corr+ b+/corr b
(v) corr+ rd/corr rd+

3.

Remember that map distance = percent recombinant meiotic products = percent recombinant progeny.

To get the map distance, we need to know what fraction of the gametes from the heterozygous parent are recombinant. From (2) above, we already know the parental types for each cross except cross (ii); the other two in each case must be the recombinant. Then, for each cross, we can simply calculate what percent of all progeny are recombinant, and that would be the map distance between the two genes.

Cross Recombinant progeny phenotypes Total # of recombinants Total # of progeny % recombination (= map distance)
i se+ h & se h+ 5 + 4 = 9 821 (9/821)*100=1.1
ii <can't tell>     (50--assorting independently)
iii b+ rd+ & b rd 12 + 15 = 27 862 (27/862)*100=3.1
iv corr+ b & corr b+ 44 + 51 = 95 835 (95/835)*100=11.4
v corr+ rd+ & corr rd 70 + 80 = 150 1009 (150/1009)*100=14.9

Thus, the se locus and the h locus are linked, and b, rd, and corr loci are linked. se assorts independently of b. Because h is tightly linked to se, h will probably assort independently of se also. Putting all the data together, se and h form a linkage group, as do b, rd, and corr. It is not possible to tell from the data whether se and h are truly unlinked from b, rd, and corr (i.e., located on separate chromosomes), or whether the two groups of genes are 50 or more map units apart on the same chromosome. The completed maps (not to scale!) are:

se----1.1 cM ---h
|---------------|
 
 
rd-----3.1 cM-----b--------- -11.4 cM------------corr
|-----------------|-------------------------------|

The two intervals in the bottom map don't quite add up to the 14.9 cM seen from the rd-corr cross; in this instance, because the data don't allow any other order of genes, we must conclude that simplest explanation for the slight discrepancy is just experimental error.

(Note that there is not a separate map for the '+' alleles; a map drawn this way shows the loci, not the alleles--so 'rd' in this map refers to the position of the rd locus on the chromosome relative to the other loci.)

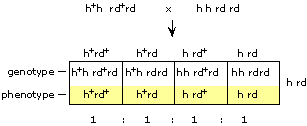
4.  (a)  The first cross (h h x rd rd) will give fully heterozygous flies h+ h rd+ rd. We have already seen that se assorts independently of b. Because se is linked to h and b is closely linked to rd, we can expect that h and rd loci will also assort independently of each other. Therefore, the cross (h+ h rd+ rd x h h rd rd) is just a heterozygote x homozygous recessive cross with independent assortment giving 1:1:1:1 phenotype ratio:

Therefore, if there are 1000 progeny, we expect 250 of each phenotype.

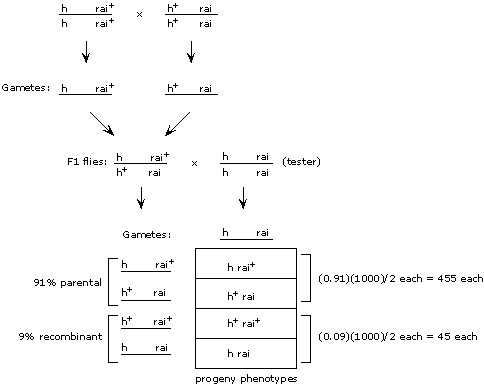
(b) As with (a), the F1 flies will be heterozygous at both loci (h+ h rai+ rai)--but here, the genes are linked, with a map distance of 9 cM between them. We know the allele arrangement in the F1 flies--h and rai+ on one homolog, h+ and rai on the other. (How do we know this? Because we know that the parents were h rai+/h rai+ and h+ rai/h+ rai. Because the F1 flies received one homolog from one parent and one homolog from the other, they must each have received one homolog with h and rai+ and one homolog with h+ and rai, as diagrammed below.) The two loci are 9 cM apart, so 9% of the progeny (=0.09 x 1000 = 90) will be recombinant--i.e., h+ rai+ and h rai. These two phenotypes together make up the 90 flies, so there will be 45 flies of each recombinant phenotype. The remaining flies are expeced to be equal number of the parental types--i.e., 455 flies h+ rai and 455 flies h rai+.

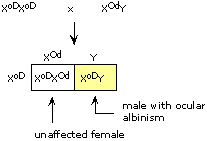
5. (a) The parents are XoDXoD and XOdY. The cross is outlined below; the children are expected to be unaffected females and ocular albinism males in 1:1 ratio.

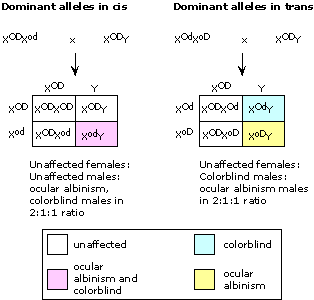
(b) Here, we know that the woman is heterozygous for both traits--but we don't know whether the dominant alleles are in cis (i.e., the dominant O allele and the dominant D allele on the same homolog) or in trans (on different homologs). The man in the cross has the dominant alleles for both loci, so his daughters will all be phenotypically normal. The sons' phenotypes, however, will depend on which X chromosome they inherit from the woman, and on whether she has the dominant alleles in cis or in trans:

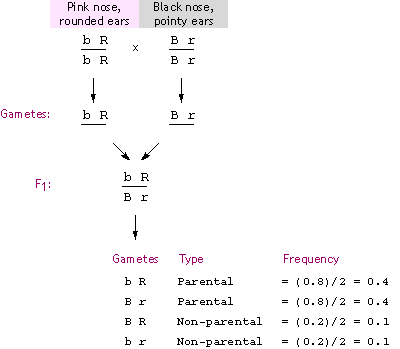
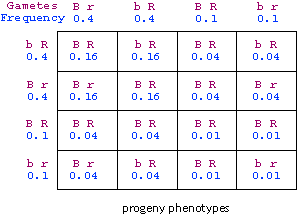
6. This problem is pretty straightforward until the Punnett squares step. Generally, a good procedure to follow is to read the whole question and then start writing down the information that the question gives you. Here, we are given the genotypes of the parents and we are told that the genes are linked and 20 cM apart. To be able to draw the Punnett squares for the F2 generation, we'll need to know the gamete types and frequencies from the F1. As shown below, writing out the parental cross and the resulting F1 leads us to the gametes produced by the F1:

The next part is to set up the Punnett squares. Remember that when we set up Punnett squares for genes showing independent assortment, we assume that the four gamete types are in equal proportions, i.e., frequency = 0.25 each. Here, we know that the frequencies are not equal -- so we can simply include the frequencies in the Punnett squares, and multiply gamete frequencies to get the frequency of the product. For example -- when we say that the frequency of gamete genotype B r is 0.4, we mean that if we randomly picked one gamete from the pool of gametes, the probability that it is B r = 0.4. Likewise, the probability of picking a gamete of genotype b r = 0.1. Thus the probability of picking both (i.e.,, the probability that a gamete of genotype B r will meet a gamete of genotype b r and form a zygote) = (0.4)(0.1) = 0.04. And so on. The Punnett square below shows the phenotypes of the progeny of the cross.

So the overall frequencies for the progeny phenotypes are:

B R: 0.51

B r: 0.24

b R: 0.24

b r: 0.01

(When doing problems such as this one, it's always a good idea to doule-check and make sure that the frequencies add up to the expected number -- in this case the phenotype frequencies should add up to 1.0.)

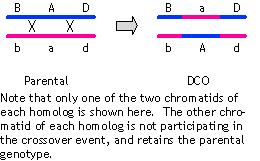
7. The parental types are ABD and abd. There are two ways we can reach this conclusion. First, we know that the initial cross was fully homozygous dominant x fully homozygous recessive, so the heterozygote must have all dominant alleles on one homolog and all recessive alleles on the other homolog. Second, the most abundant phenotypes are ABD and abd, so they must be the parental types.

The least abundant types, the double crossover over products, are Abd and aBD. For the parental genotype to give this genotype after a double crossover, the A/a locus has to be in the middle.

Therefore, a single crossover in the B-A interval gives Bad and bAD; a crossover in the A-D interval gives BAd and baD.

Now we can calculate the percent recombinant types for each interval:

# of crossovers in B-A interval = SCO (in B-A) + DCO = (120 + 131) + (13 + 21) = 285
Percent recombination in B-A interval = (285/1022)*100 = 27.9
 
# of crossovers in A-D interval = SCO (in A-D) + DCO = (72 + 66) + (13 + 21) = 172
Percent recombination in A-D interval = (172/1022)*100 = 16.8
 
Map of the region:
 
B--------27.9 cM------A------16.8 cM-----D
|---------------------|------------------|
 
Predicted # of crossover products = (0.285)(0.168)(1022) = 48
Observed # of crossover products = 13 + 21 = 34
Coefficient of coincidence = 34/48 = 0.71
[Interference = (1 - 0.71) = 0.29.]

8. The only candidates are chromosomes 4, 5, and 8 (these are the three that are present in all cell lines that express the SP1 protein). Of these, #s 4 and 5 can be eliminated because they are present in cell lines D or E, which do not express the protein. Therefore, the chromosome that has the SP1 gene is #8.

9. (a)

Since this cross is fully heterozygote x homozygous recessive, we expect all phenotype classes to be equally probable (abundant) assuming independent assortment:

Phenotype Observed Expected
g d 114 100
G D 112 100
G d 88 100
g D 86 100
Total 400 400

(b)
Phenotype Observed Expected (O-E)2/E
g d 114 100 142 /100 = 1.96
G D 112 100 122 /100 = 1.44
G d 88 100 122 /100 = 1.44
g D 86 100 142 /100 = 1.96
Chi-squared value = 6.8

There are four phenotypes, so df = 3.

P value corresponding to these chi-squared and df values:

0.1 > P > 0.05

Assuming that our P-value cutoff is 0.05, the data are consistent with the hypothesis of independent assortment -- there's between 5 and 10% probability of seeing this much deviation just due to chance. However, the results are close to being borderline.

(c) If we were to be more stringent, we would raise the P-value cutoff -- e.g., if we raised the cutoff to 0.1, we'd say in this experiment that the deviation from expected values is too great to be chance error.

(d) In order to test the goodness of fit, we need a clear prediction to test the data against. If we assume independent assortment, we have that prediction -- we know that all progeny classes should be equally abundant. If we assume linkage, then we can't predict how many progeny in each class there will be, unless we are assuming a particular map distance. That's because the genes could be linked at any distance up to 50 cM, and the expected progeny numbers will vary depending on the map distance.

10. (a) Symbols are assigned as follows -- T and t = thick and thin skins, respectively; F and f = tart and sweet fruit flavor; and S and s = large and small seeds. What you know about the parents (the two plants you have obtained) so far is that one is T_ F_ S_ and the other is T_ F_ ss (this one being the small-seeded plant).

To learn more about the parents, look at the progeny in the cross between the parents. Assuming that the traits are assorting independently, you can examine each trait separately in the progeny. Let's look at the skin phenotype first. Both parents show the dominant phenotype, so they must each be TT or Tt. Since there are tt (thin-skinned) progeny, you can tell right away that neither parent was TT (because if even one parent had been TT, all of the progeny would have inherited the dominant allele T from this parent, and you wouldn't get any thin-skinned progeny). Therefore, both parents must be Tt . This conclusion sets up a prediction: the Tt x Tt cross should give a 3:1 ratio of thick skinned:thin-skinned progeny (remember, because we are assuming independent assortment, we can look at one trait at a time and treat it as a monohybrid cross). We do, in fact, see this ratio in the progeny --

Thick-skinned: 290 + 309 = 599
Thin-skinned: 106 + 95 = 201

giving a ratio of 599:201 or almost exactly 3:1.

Flavor: Both parent have the dominant (tart) phenotype, as do all of the progeny. Therefore, all you can say about the parents is that one of them must be FF and the other is either FF or Ff.

Seed size: One parent shows the recessive phenotype and must be ss . The other could be either SS or Ss. However, if it were SS, the progeny should be all large-seeded, and that is not the case. Therefore, the large-seeded parent must be heterozygous (Ss). The prediction from the Ss x ss cross is that the progeny should be 1:1 large- and small-seeded, which is confirmed by looking at the numbers--

Large-seeded: 290 + 106 = 396
Small-seeded: 309 + 95 = 404

which is close to a 1:1 ratio.

Therefore, the genotypes of the parents are Tt [F_] Ss and Tt [F_] ss with the proviso that one or both parents are FF.

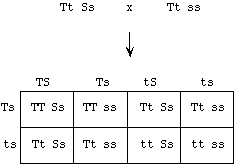
(b) Because we cannot assign the flavor genotypes, we can ignore the flavor alleles and look at just the skin and seed phenotypes as a dihybrid cross:

There are 800 progeny (total), and as seen from the table above, the expected phenotype proportions are:

3/8 TS
3/8 Ts
1/8 tS
1/8 ts

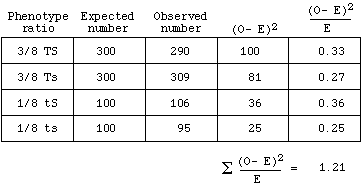
As seen from the expected and observed progeny below, there is some deviation from the predicted values:

Since there are 4 progeny classes, the number of degrees of freedom (df) = 4-1 =3. From the Chi-square table, the p value for Chi-square = 1.21 and df =3 is between 0.9 and 0.5, or 0.5 < p < 0.9 . That is, the probability of getting the observed deviation just due to chance is between 0.5 and 0.9.

(c) If the bin does contain heterozygotes, and if you pick just one fruit, the chance of picking a homozygote = the chance of not picking a heterozygote = 1/2. If you pick two fruit, the chance of not picking a heterozygote = (1/2)(1/2) = 1/4. If you pick three fruit, the chance of not picking a heterozygote = 1/8. And so on. What we need to figure out is, how many fruit do we have to sample to bring the chance of not picking a heterozygote down to 0.05 (i.e., 95% probability of picking at least one heterozygote if the bin does contain heterozygotes). In other words, we need to do n trials such that (1/2)n = 0.05. Solving for n, we get

n = 4.32. Since we can't really sample 4.32 fruit, we can round up and say that if we sample 5 fruit from the bin, there's < 5% chance of missing a heterozygote if the bin does contain heterozygotes.