Today's young generation live in an era of data. From smartphones to social media, from daily activities to world events, data is woven into everyday lives. Previously often associated with adult professionals, the ability to make sense of the world through data, including practices such as reading data, working with data, analyzing data, and arguing with data, has now become an increasingly important ability for young people in K-12 education.
While many tools exist to facilitate data processing for those without programming skills (e.g., Microsoft Excel), the ability to write computer programs is still at the center of these practices around data. Consider the process of analyzing a large dataset: it often involves writing a program to filter and reshape the data, which then feeds into another program that generates a visualization. Programming with data also offers a wider array of possibilities—for example, creating new forms of data visualization that pre-programed tools cannot provide.
Recent discussions of democratizing data science call for everyone, including young people, to learn programming skills that support asking and answering questions with data. Through our new IDC'23 paper, we share our attempt to bring the power of programming with data to young people.
Dataland: A block-based data programming system for young people
We designed Dataland, a new visual block-based data programming system embedded in a series of story contexts for novice people to read, analyze, and visualize data. Its core part, the visual block-based data programming editor, is available as a demo at https://learning-with-data.github.io/.
Below is a screenshot of the interface of the Dataland code editor.
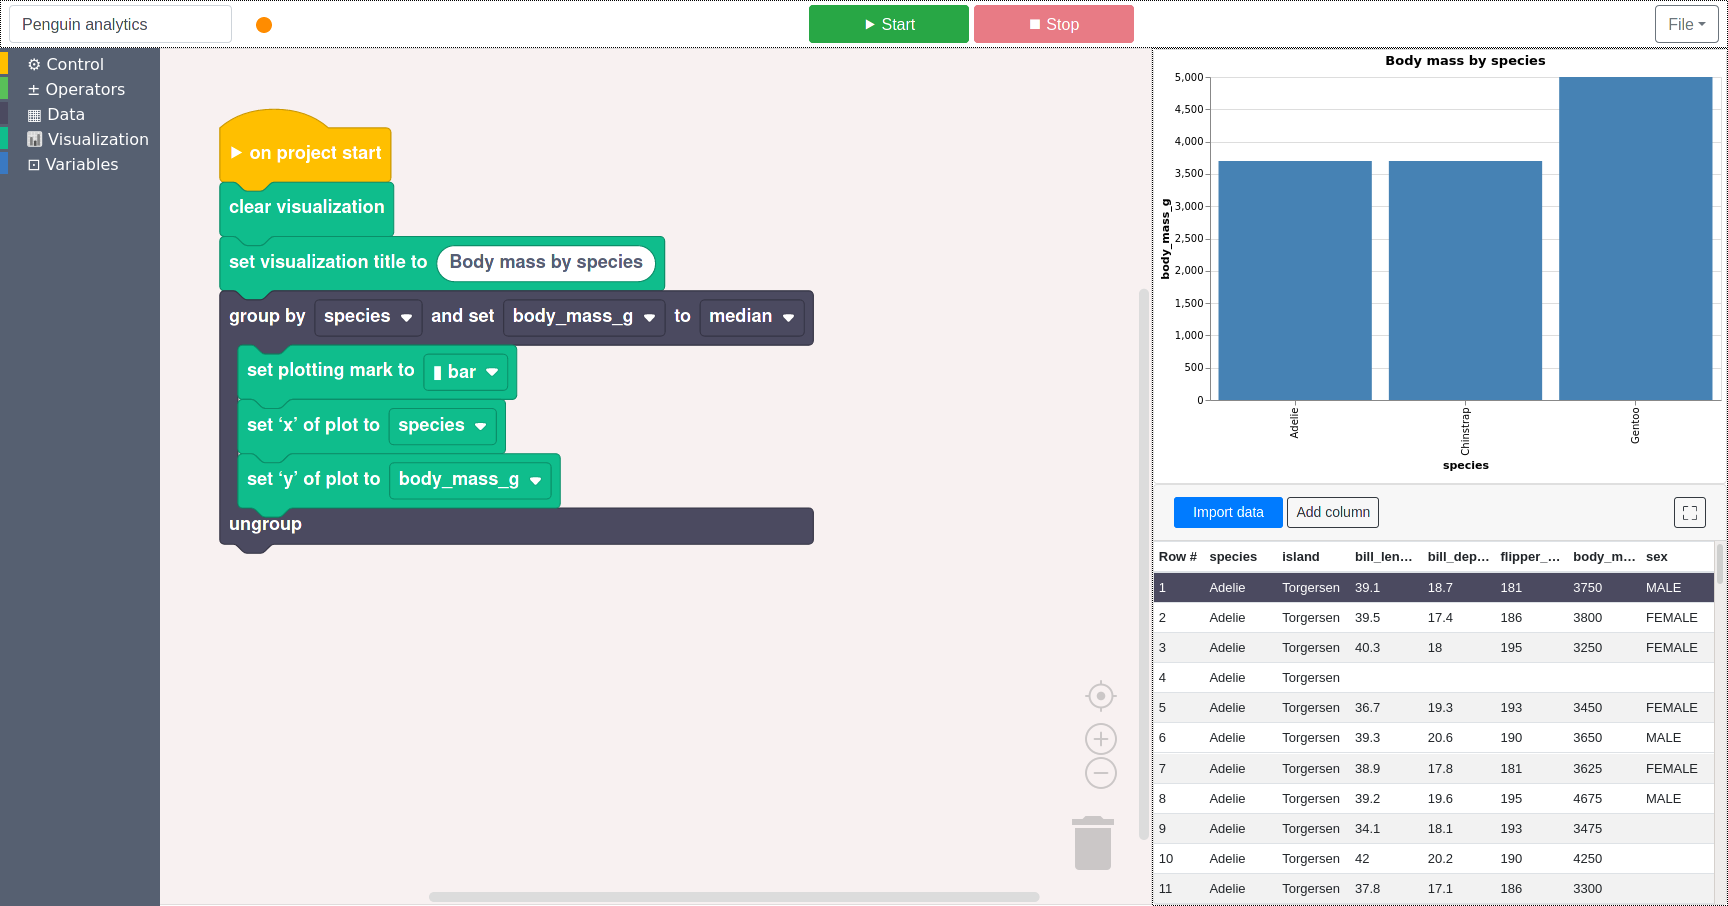
The Dataland code editor user interface
In dataland, users can code with data by selecting, dragging-and-dropping, and stacking a variety of programming blocks. Users can view data in a table as part of the system. They can access, operate, and edit the data via their code. Users can run their program to create a variety of visualizations created by their code and the dataset.
The following video shows a short demo of making a scatter plot with Dataland.
We adopted much of the design of basic programming blocks (e.g., mathematical operations, conditions, loop) from the design of the Scratch programming blocks and added new blocks that are specific for data analysis. This includes blocks that conduct common data operations, such as accessing and selecting data through drop down menus, and blocks that allow users to visualize, filter and aggregate data. Below are some examples of our blocks:
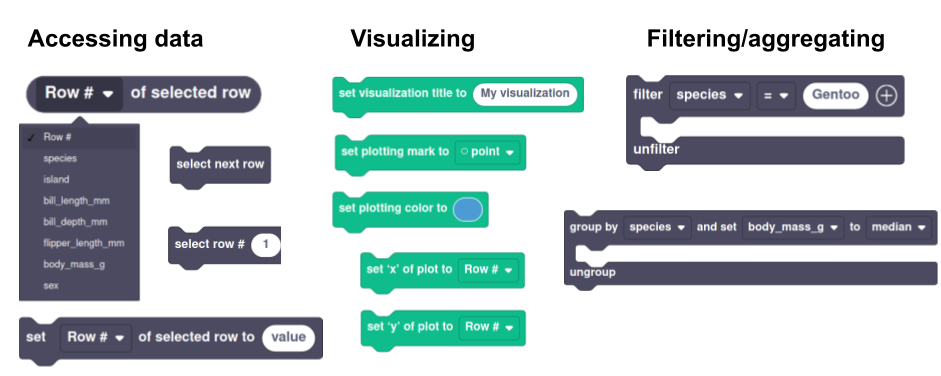
Some of the programming blocks (primitives) in Dataland
For our research, we presented Dataland in the context of a “storyline,”' which is a web-based interface that tells a data story, drawing from ideas that are common in computational notebooks such as Jupyter. Throughout the storyline are several code editors instances where users can work on block-based programming projects. We presented a total of 3 storylines. The first two storylines were based on the Palmer penguins dataset, and the third were set in the city of Seattle where the research activities took place.
Dataland workshops
As a part of our research, we conducted 7 research workshops in Seattle with middle and highschool-aged students. In these workshops, students used Dataland to engage in data analysis as part of an interactive storyline. Navigating through the storylines, they played the role of an investigator to conduct a series of data analyses in order to help the story's protagonist locate a missing family member. We studied students' practices of working with data in this system and iterated on the design of the system and the story contexts.
A Framework for Computational Data Literacy
Building on the foundational framework of Computational Thinking by Brennan and Resnick (2012), our research presents a new perspective on youth computational data literacy. The framework outlines a range of concepts, practices, and perspectives that young people can develop through programming with data using Dataland. In particular, we focus on how novices learn new concepts related to programming and data, how they display practices of working with data similar to professional data scientists, and how they develop critical perspectives of working with data.
Below is an illustration of our framework.
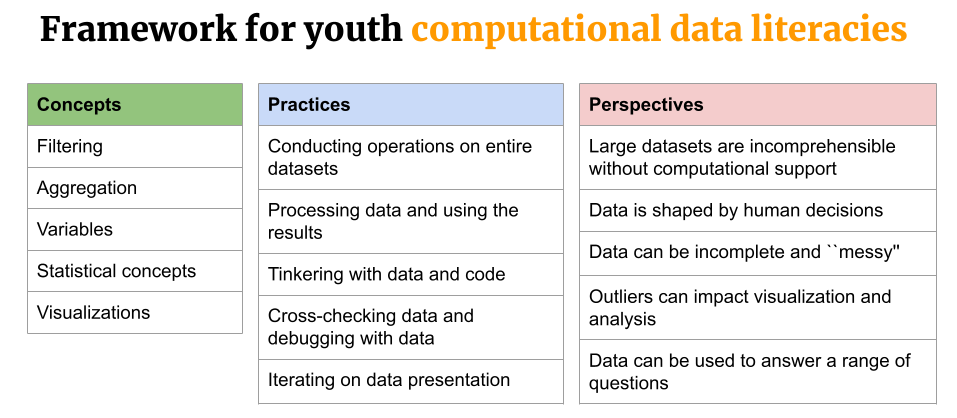
Illustration of our computational data literacies framework
The detailed explanation of each element in the framework, and how Dataland facilitates the learning of it, can be found in our paper.
We offer this framework as a starting point for scholars and practitioners interested in computational data literacy, with the hope that new tools and pedagogical approaches will develop the framework even further.
The paper and this blog post are collaborative work between Ruijia “Regina” Cheng, Aayushi Dangol, Frannie Ello, Lingyu Wang, and Sayamindu Dasgupta. The paper is now available (open access) as a part of the Proceedings of the ACM Interaction Design and Children Conference (IDC 2023).
We will present the paper during the IDC conference on June 21st at 9am US Central Time. Regina, Aayushi, and Sayamindu are happy to answer questions over email or in-person at the conference.
This work was supported by UNC Chapel Hill, the University of Washington, and the US National Science Foundation. Any opinions, findings, and conclusions or recommendations expressed in this material are those of the author(s) and do not necessarily reflect the views of the National Science Foundation.