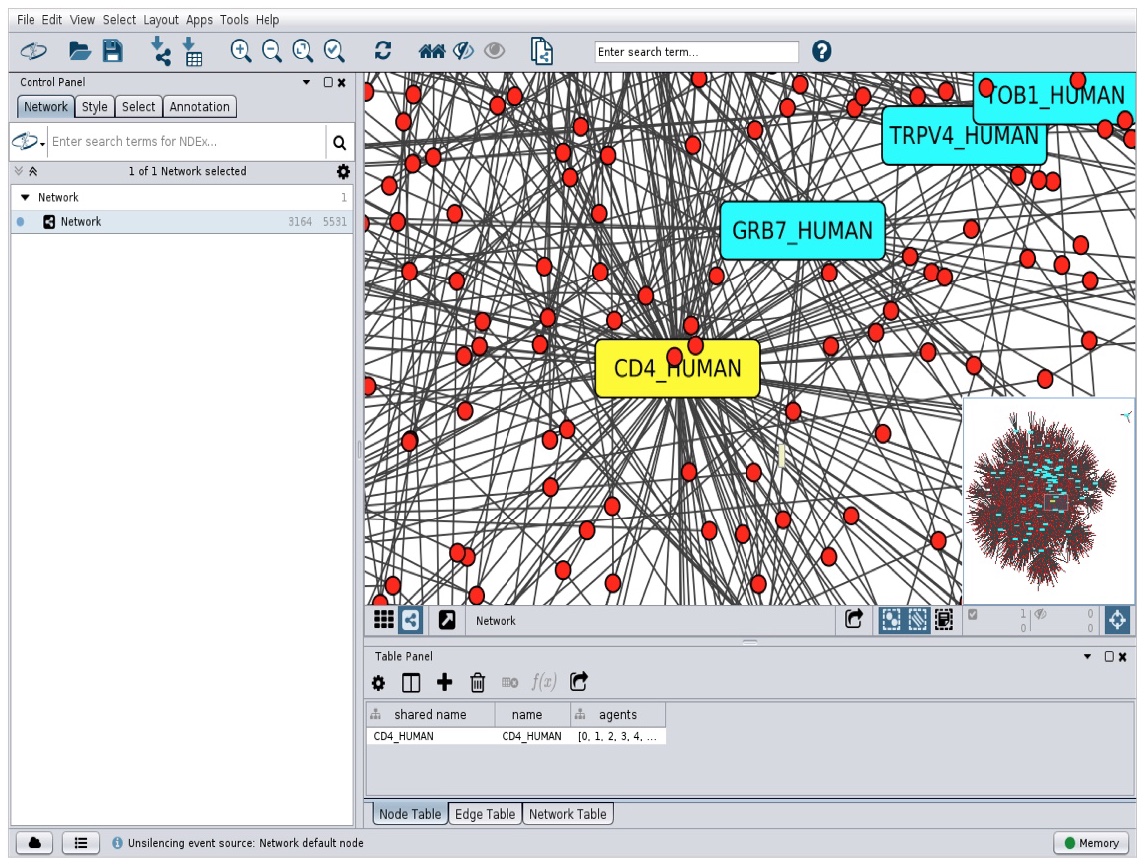
The MASS library uses Cytoscape as a GUI tool for interactive graph construction, editing, and visualization. The two main reasons are: Cytoscape’s popularity among scientific users and its well-defined plug-ins. Integrating MASS with Cytoscape requires two key interactions between the two systems through Cytoscape plug-ins:
Import-network plug-in: pulling an in-memory graph from
MASS and re-building it inside of Cytoscape into a native CyNetwork with
a combination of CyNode and CyEdge entities.Export-network plug-in: serializing the currently
selected Cytoscape CyNetwork into the MASS Graph- Places for sending to
MASS.To facilitate communication between Cytoscape and MASS, a user must run CytoscapeListener in her/his MASS main program as shown in the listing below on line 6. Then, Cytoscape plug-ins establish a TCP socket to communicate with MASS. Since a user interacts with Cytoscape on her/his graph visualization, Cytoscape invokes both import- and export-network plug-ins. They respectively send the following commands to MASS, followed by a transfer of a lightweight graph representation with only essential information such as the vertex IDs and their neighbors:
getGraph: initiates retrieving the in-memory graph from
MASS that sends the serialized message to Cytoscape.setGraph: sends the current CyNetwork to MASS that
rebuilds the corresponding GraphPlaces object inside of it.These two commands are interpreted by CytoscapeListener automatically and are applied to a given graph in parallel of the main program. With its command interpretation in background, a user can repeatedly observe the progress of graph computation (line 7 below).
import MASS.*;


public class GraphVisualization {
  public void main(String[] args) {
    MASS.init( );
    GraphPlaces graph = new GraphPlaces(1, "EmptyGraph");

    MASSListener listener = new CytoscapeListener(graph);
    ...; // Graph computation

    listener.finish();
    MASS.finish();
  }
}
As shown below, in a snapshot of Cytoscape’s GUI, by selecting the
Import Network menu option, Cytoscape’s import-network
plug-in kicks off the ImportNetworkTask module that sends a getGraph
request to MASS CytoscapeListener to retrieve its in-memory graph. The
plug-in then de-serializes the MASS response into a Cytoscape
representation of the graph: a CyNetwork. To achieve a simple and
consistent visualization of a graph, a few minor styles were applied to
the Cytoscape nodes created (vertices with neighbors in blue rectangles,
those with no neighbors in red circles, and a userclicked vertex in a
yellow rectangle).
Cytoscale Graph Creation