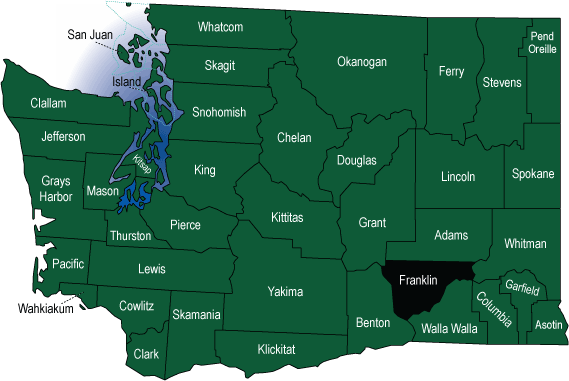
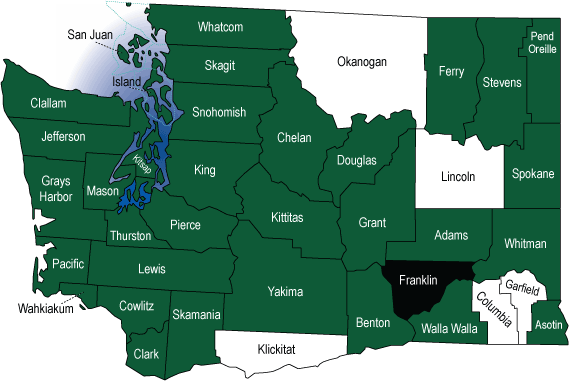
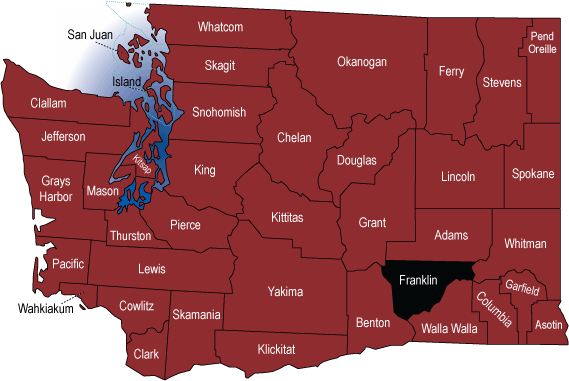
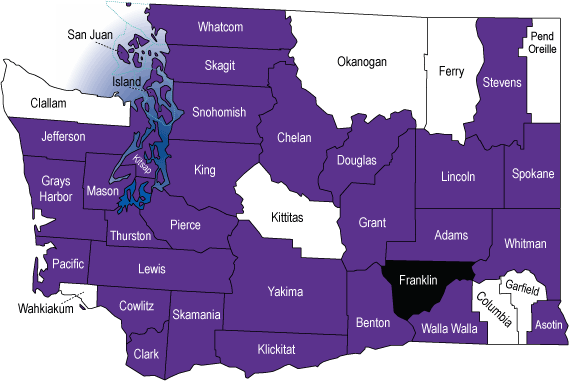
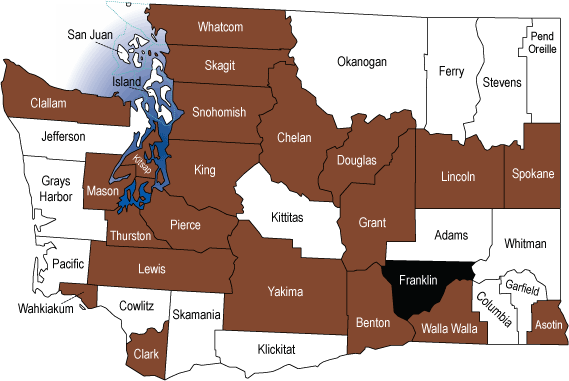
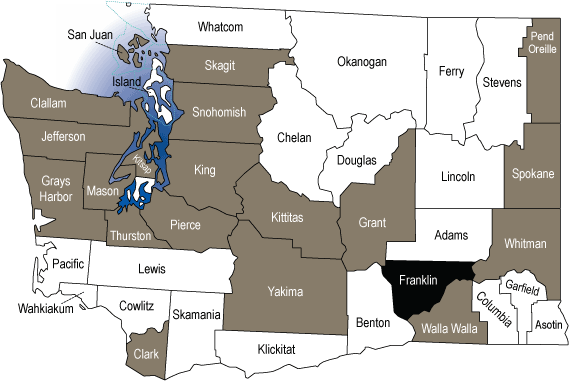
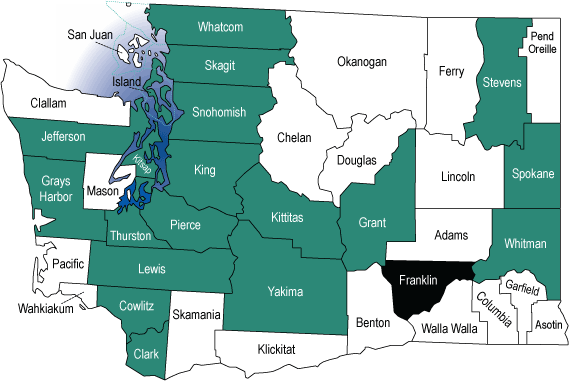
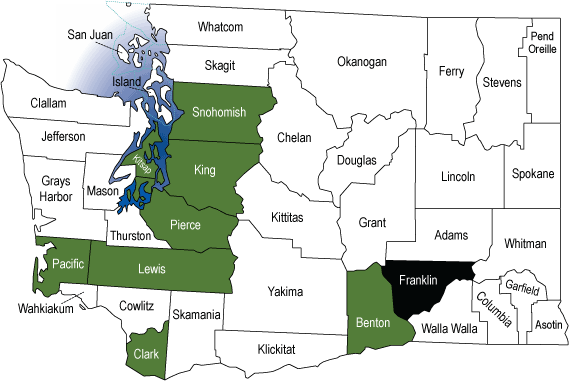
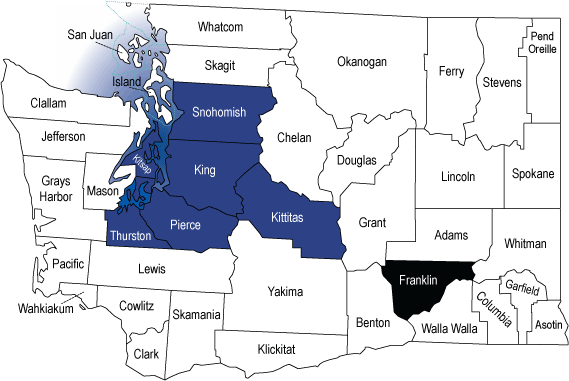
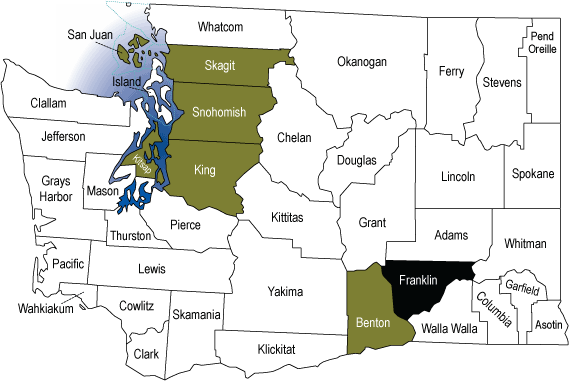
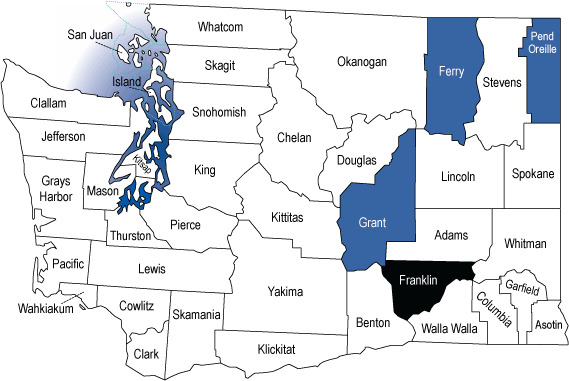
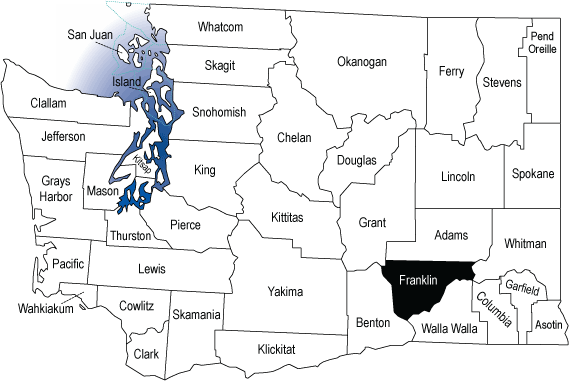
The 2007 High School County Maps reflect data submitted by high schools on the 2007 MELL Survey. It's important to note that some counties had a higher percentage of schools reporting than did others, as shown in the table below. (One county, Franklin, did not have any MELL Surveys submitted in 2007.) Therefore, it's possible that there are high schools in some of these counties teaching languages, but that information was not available for this report.
In the 2008-9 MELL Survey of High Schools we hope to reach 100% of public high schools in the state reporting. At that point, the County Maps will be a more complete and accurate picture of languages taught across the state.
County |
# of High Schools in County* |
# of High Schools Submitted MELL Survey |
% of High Schools Submitted MELL Survey |
Adams |
4 |
2 |
50% |
Asotin |
4 |
3 |
75% |
Benton |
13 |
6 |
46% |
Chelan |
12 |
8 |
67% |
Clallam |
12 |
8 |
67% |
Clark |
32 |
19 |
59% |
Columbia |
1 |
1 |
100% |
Cowlitz |
9 |
5 |
56% |
Douglas |
6 |
3 |
50% |
Ferry |
6 |
2 |
33% |
Franklin |
6 |
0 |
0% |
Garfield |
1 |
1 |
100% |
Grant |
16 |
11 |
69% |
Grays Harbor |
15 |
8 |
53% |
Island |
7 |
4 |
57% |
Jefferson |
5 |
3 |
60% |
King |
132 |
77 |
58% |
Kitsap |
28 |
15 |
54% |
Kittitas |
6 |
3 |
50% |
Klickitat |
8 |
5 |
63% |
Lewis |
15 |
9 |
60% |
Lincoln |
7 |
7 |
100% |
Mason |
6 |
3 |
50% |
Okanogan |
13 |
5 |
38% |
Pacific |
9 |
5 |
56% |
Pend Oreille |
3 |
2 |
67% |
Pierce |
54 |
26 |
48% |
San Juan |
6 |
4 |
67% |
Skagit |
18 |
9 |
50% |
Skamania |
1 |
1 |
100% |
Snohomish |
56 |
30 |
54% |
Spokane |
45 |
27 |
60% |
Stevens |
14 |
5 |
36% |
Thurston |
20 |
12 |
60% |
Wahkiakum |
1 |
1 |
100% |
Walla Walla |
8 |
6 |
75% |
Whatcom |
16 |
9 |
56% |
Whitman |
10 |
6 |
60% |
Yakima |
25 |
19 |
76% |
Total |
650 |
370 |
57% |
*Note: # of High Schools in County
counts all schools that encompassed grades 9-12 or some subset
based on the OSPI 2005-6 Demographics File. This includes a number of
alternative programs and schools that only go up to grade 9, 10, or 11.