Forests and Snow Storage in the PNW
Conceptual Model
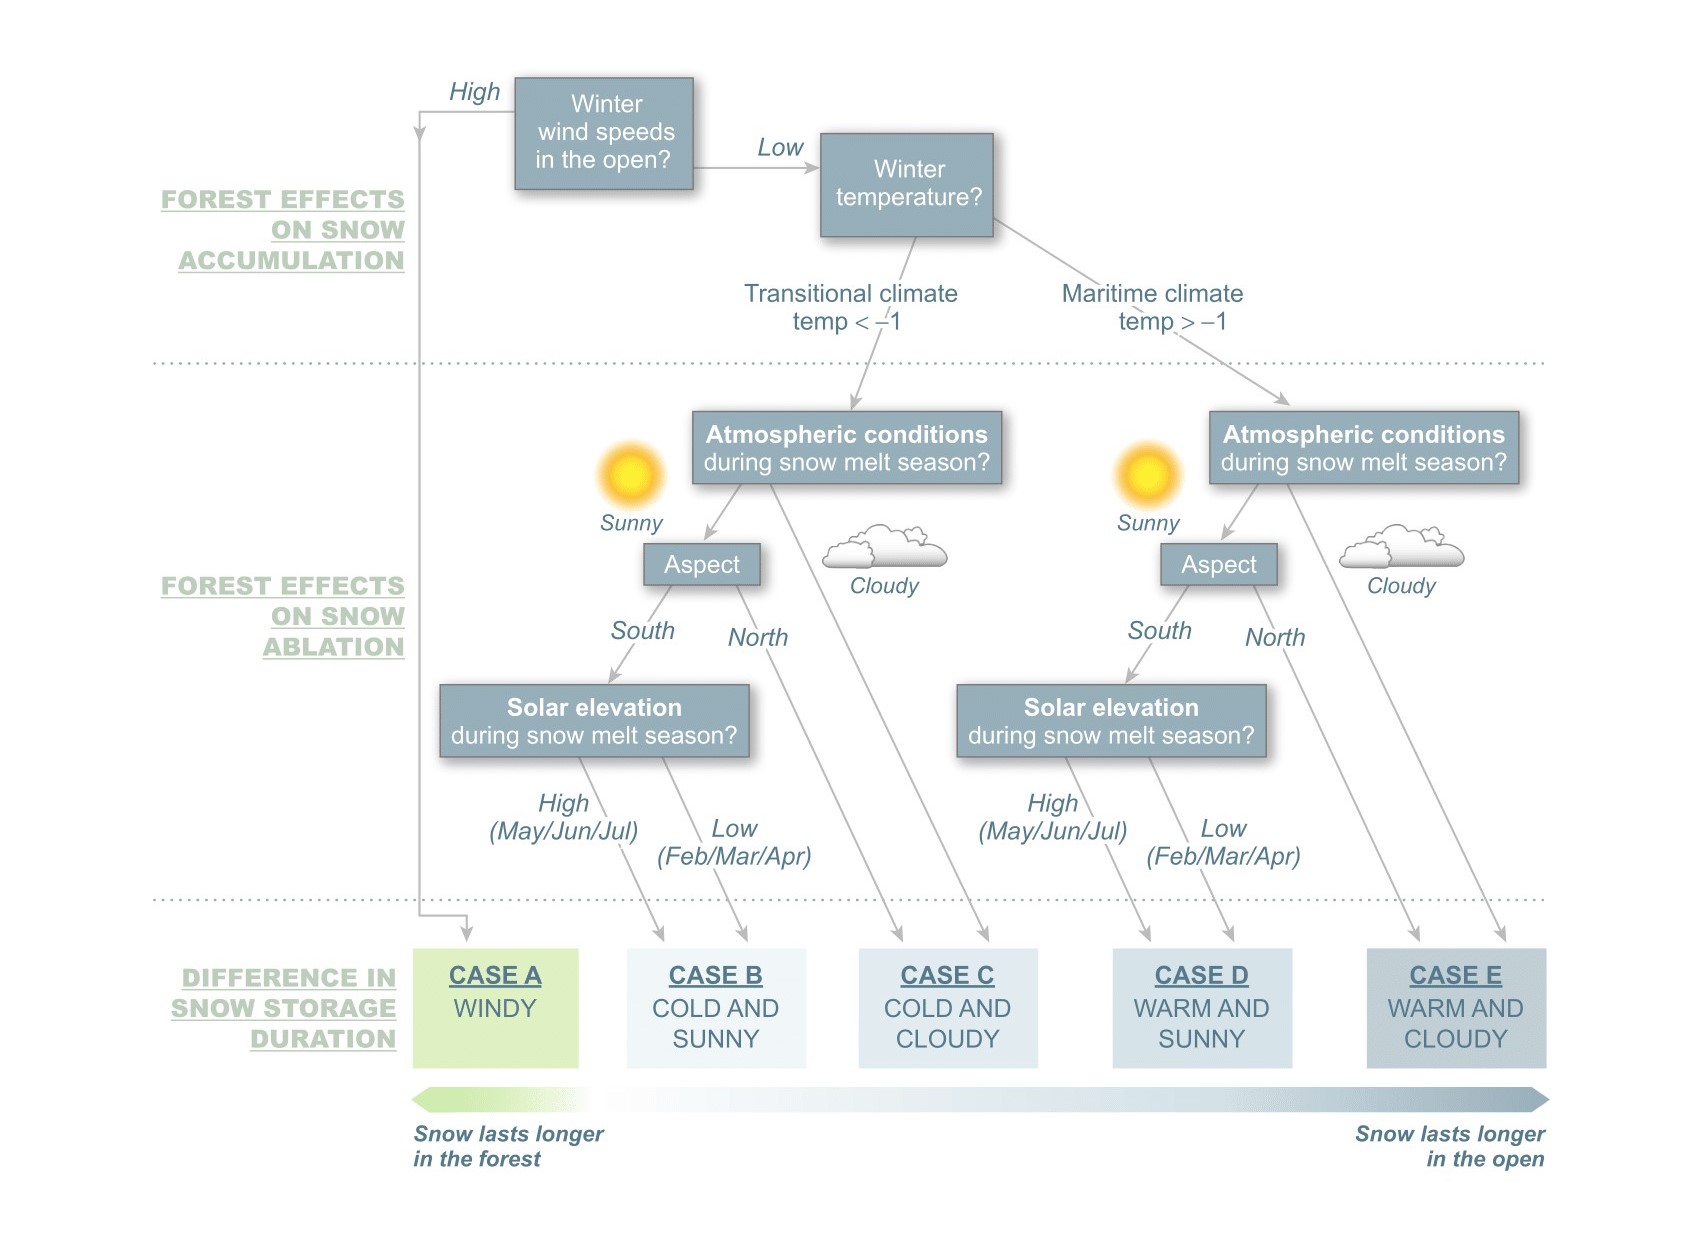
Based on observations of the magnitude and duration of snow storage at paired open and forested sites in Washington, Oregon, and Idaho, we found that the difference in snow disappearance timing ranges from synchronous to snow lasting up to 13 weeks longer in the open at 12 out of 14 sites. The exception was observed at sites exposed to high wind speeds, where snow lasts up to 5 weeks longer in the forest than in the open. In a paper currently under review at Hydrological Processes, we present extensive analysis of these data and attribute the differences in snow disappearance timing primarily to the forest effects on snow accumulation rather than ablation.
From these analyses, we have developed a decision tree framework for stepping through the key controlling factors that determine how forests modify snow processes. You can access the webinar describing the framework here. Note that we are currently preparing a publication to describe the model and supporting data in detail.
The beta-version decision tree starts with wind as the first driver, then considers magnitude of interception (as a function of winter temperature), and the importance of forest effects on shading. We are in the process of refining this model; please note that this is a beta version:
Data to support the assessments of local conditions that are suggested in the framework are provided below.
Maps
All maps are based on publicly available data and may be used freely for any non-commercial purpose but are offered without warranty. The spatial data are provided for use as image files
and as Google Earth overlays. The scale bars are given in the image files, since we have yet to find a way to associate the values for the gridded data with the Google Earth overlays.
When using in print or digital publication, please cite the data source (given below each map), as well as the paper we are currenly preparing to describe the conceptual model:
Dickerson-Lange, S.E., et al. (2016, in preparation), A conceptual model of forest effects on snow storage for estimating combined effects of forest change and climate change across
the Pacific Northwest, USA
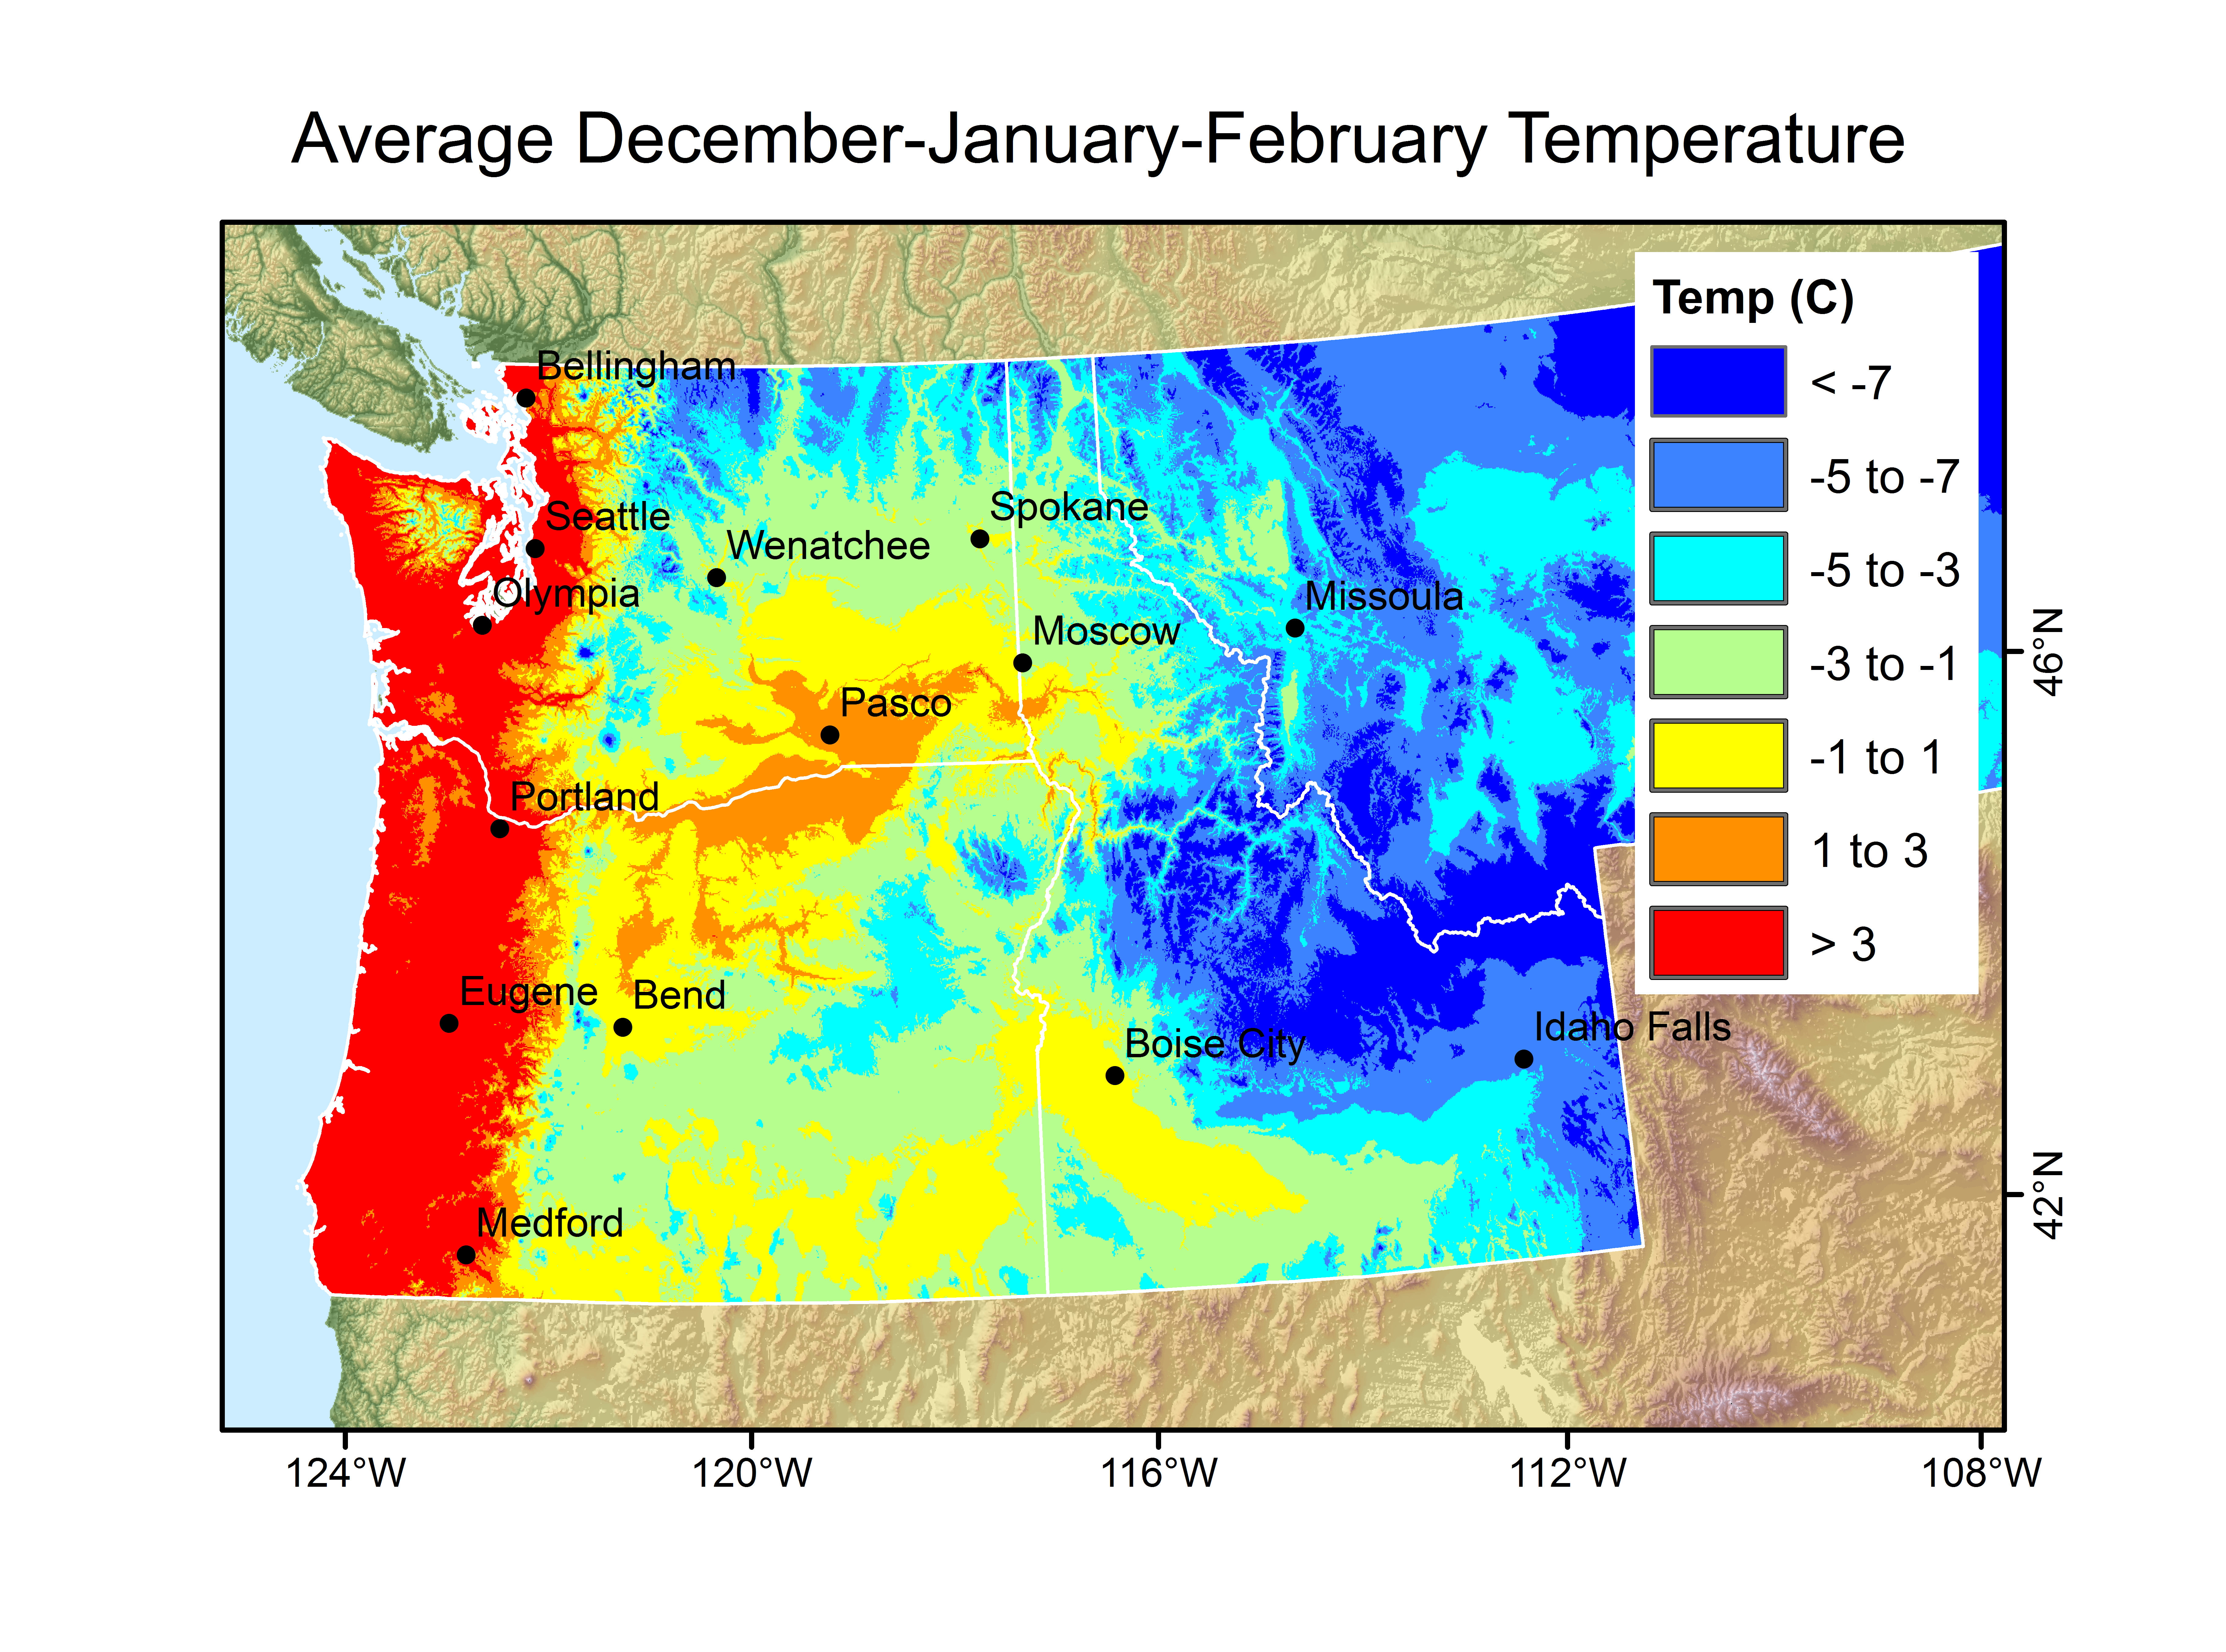
Mean Winter Temperature
Previous work has demonstrated that canopy snow interception efficiency and storage capacity are larger where and when temperature is higher. Thus, we use winter temperature as a tool to
estimate the relative magnitude of snow storage difference between forest and open due to canopy interception and subsequent loss (mostly melt). The map shows mean December-January-February
temperature from 800 m gridded climate normals over the period 1981-2010.
Data from the PRISM Climate Group, Oregon State University. Available from: http://prism.oregonstate.edu
 Mean winter temperature google earth overlay
Cloudiness
To characterize average spring cloudiness, we used daily 1/16° gridded historical data developed by Livneh et al., [2013], and utilized daily maximum and minimum air temperature from 1981-2010 to compute an atmospheric transmittance coefficient based on the diurnal temperature range, following the equation developed by Bristow and Campbell [1984]. Since the transmission of solar radiation through the atmosphere is a function of water vapor, we utilize the coefficient from this empirical model, which was developed and tested in the Pacific Northwest, as a proxy for cloud cover. High atmospheric trasmittance values indicate clear sky conditions (red), and low values indicate cloudy conditions (blue). We aggregated the daily values to monthly mean values, and then computed the seasonal means for different combinations of months.
- Bristow, K. L., and G. S. Campbell (1984), On the relationship between incoming solar radiation and daily maximum and minimum temperature, Agric. For. Meteorol., 31(2), 159–166, doi:10.1016/0168-1923(84)90017-0.
- Livneh, B., E. a. Rosenberg, C. Lin, B. Nijssen, V. Mishra, K. M. Andreadis, E. P. Maurer, and D. P. Lettenmaier (2013), A long-term hydrologically based dataset of land surface fluxes and states for the conterminous United States: Update and extensions, J. Clim., 26(23), 9384–9392, doi:10.1175/JCLI-D-12-00508.1.
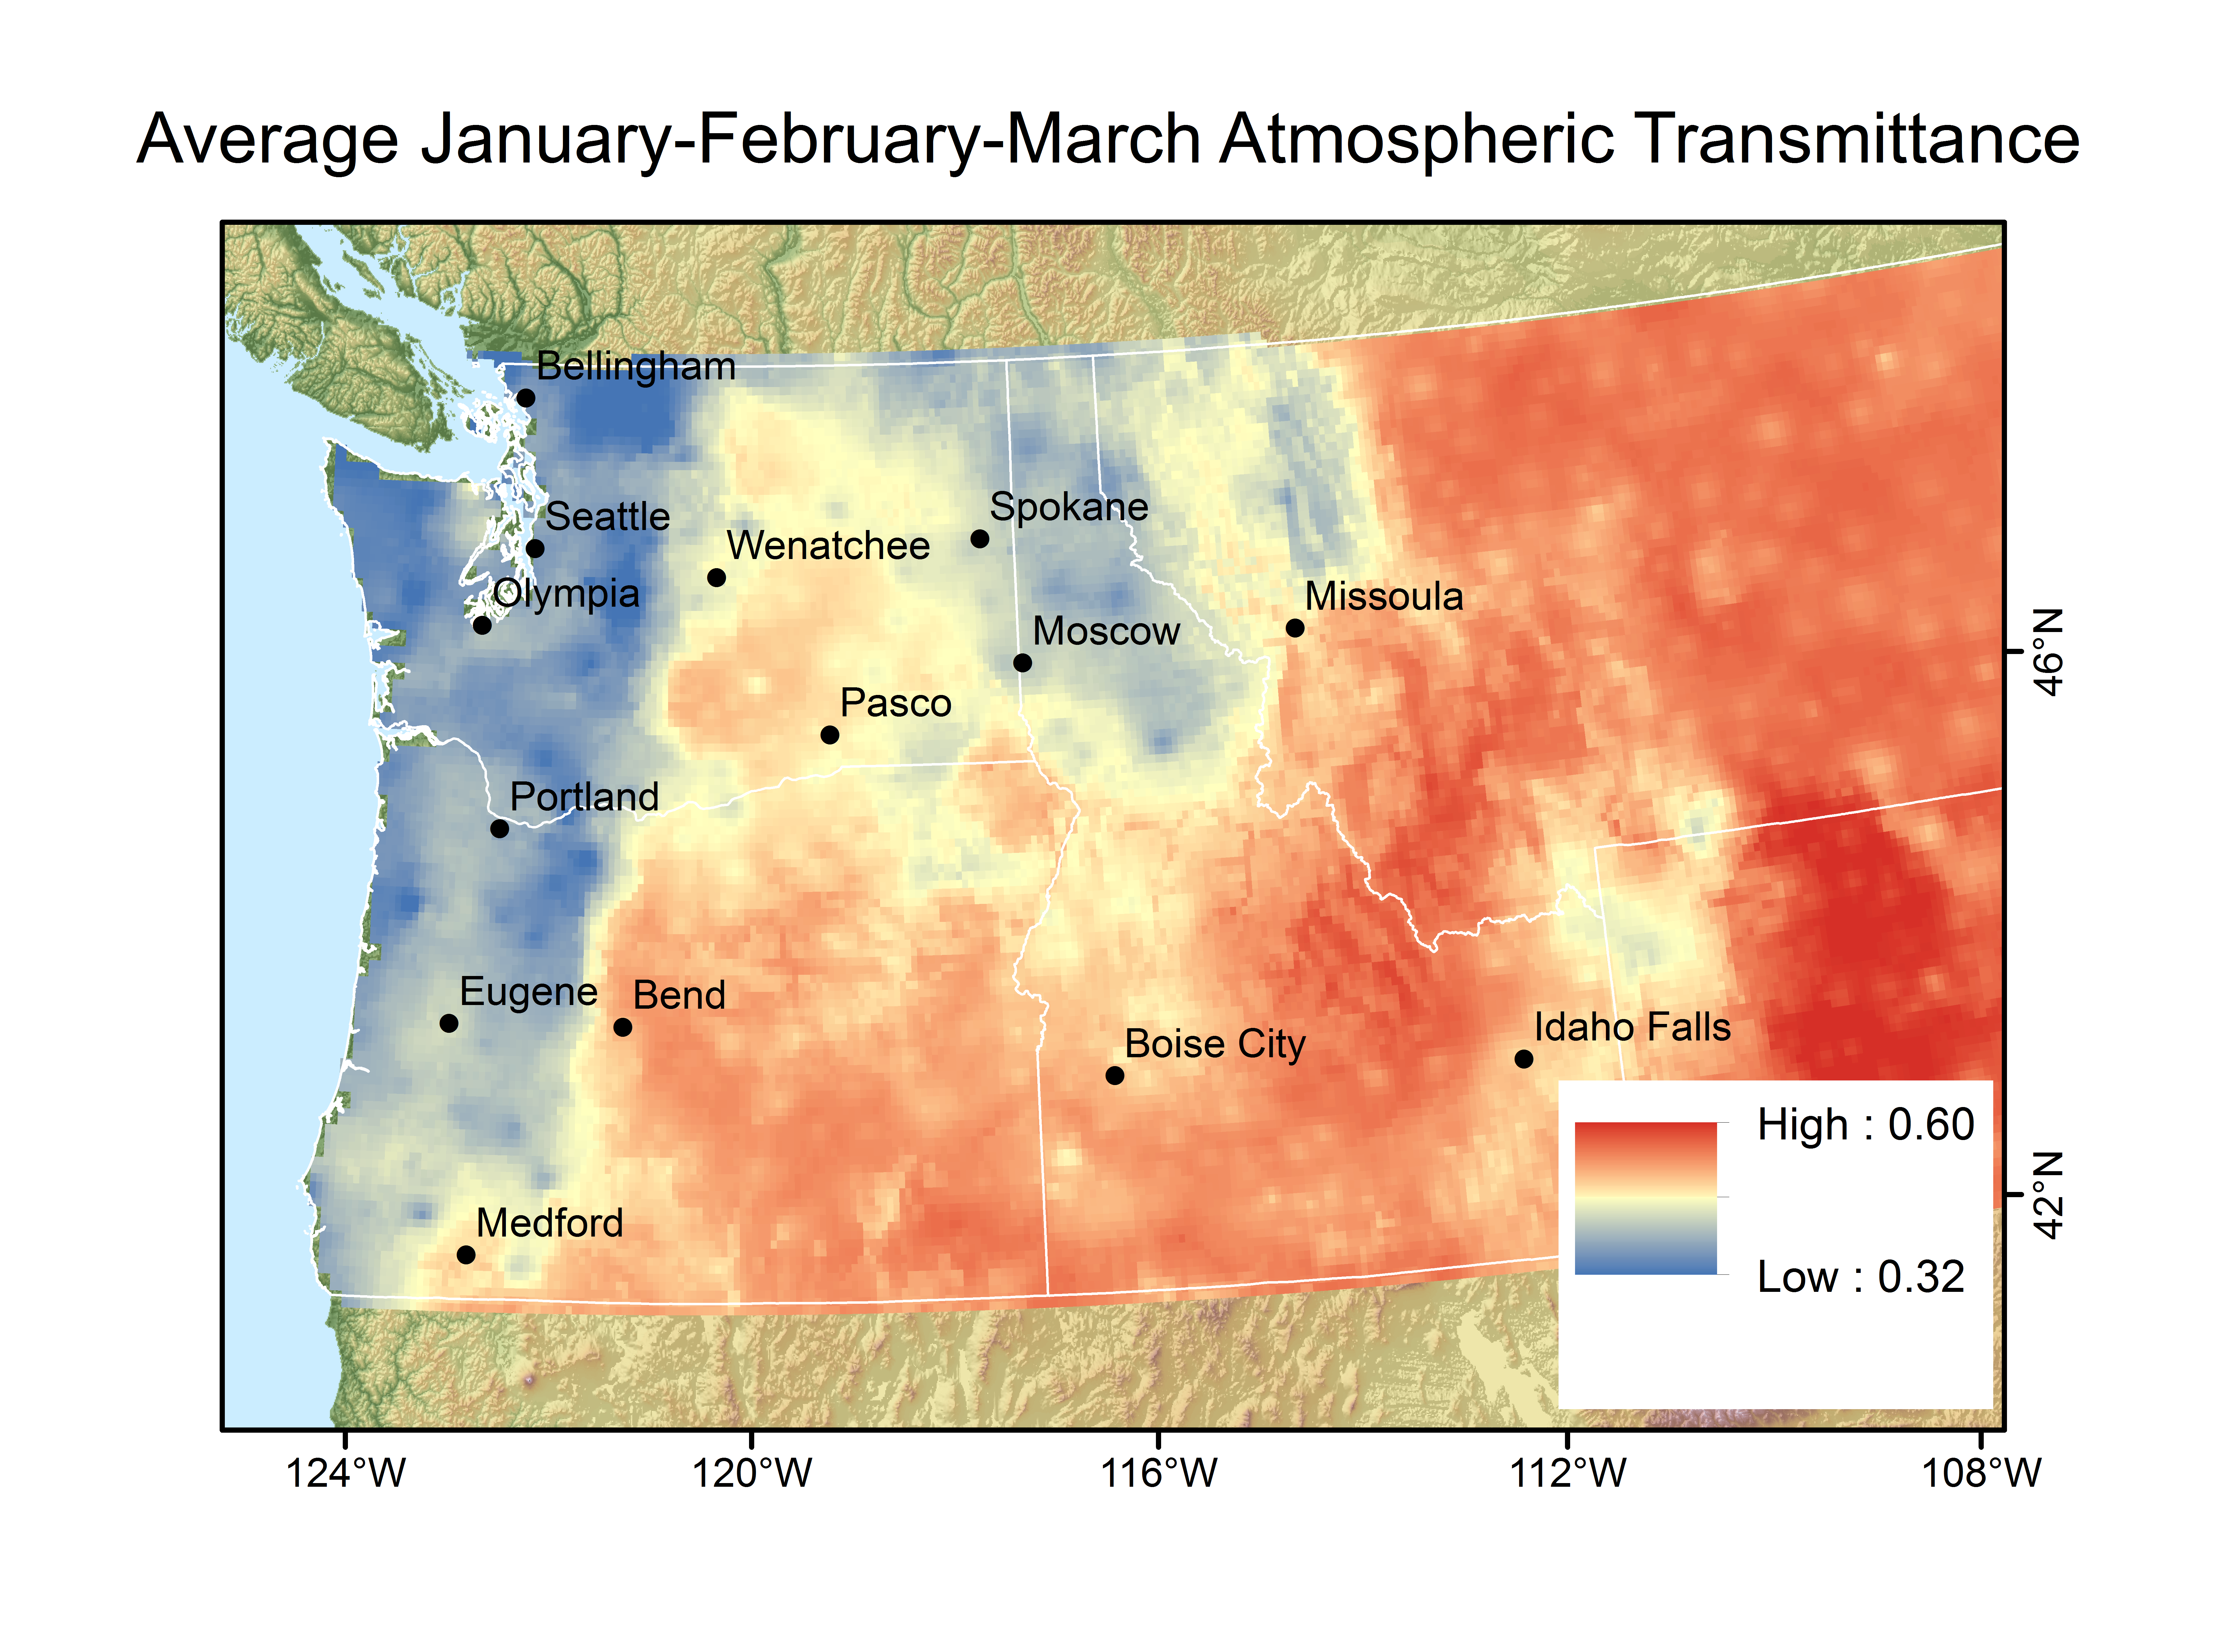 January-February-March cloudiness google earth overlay
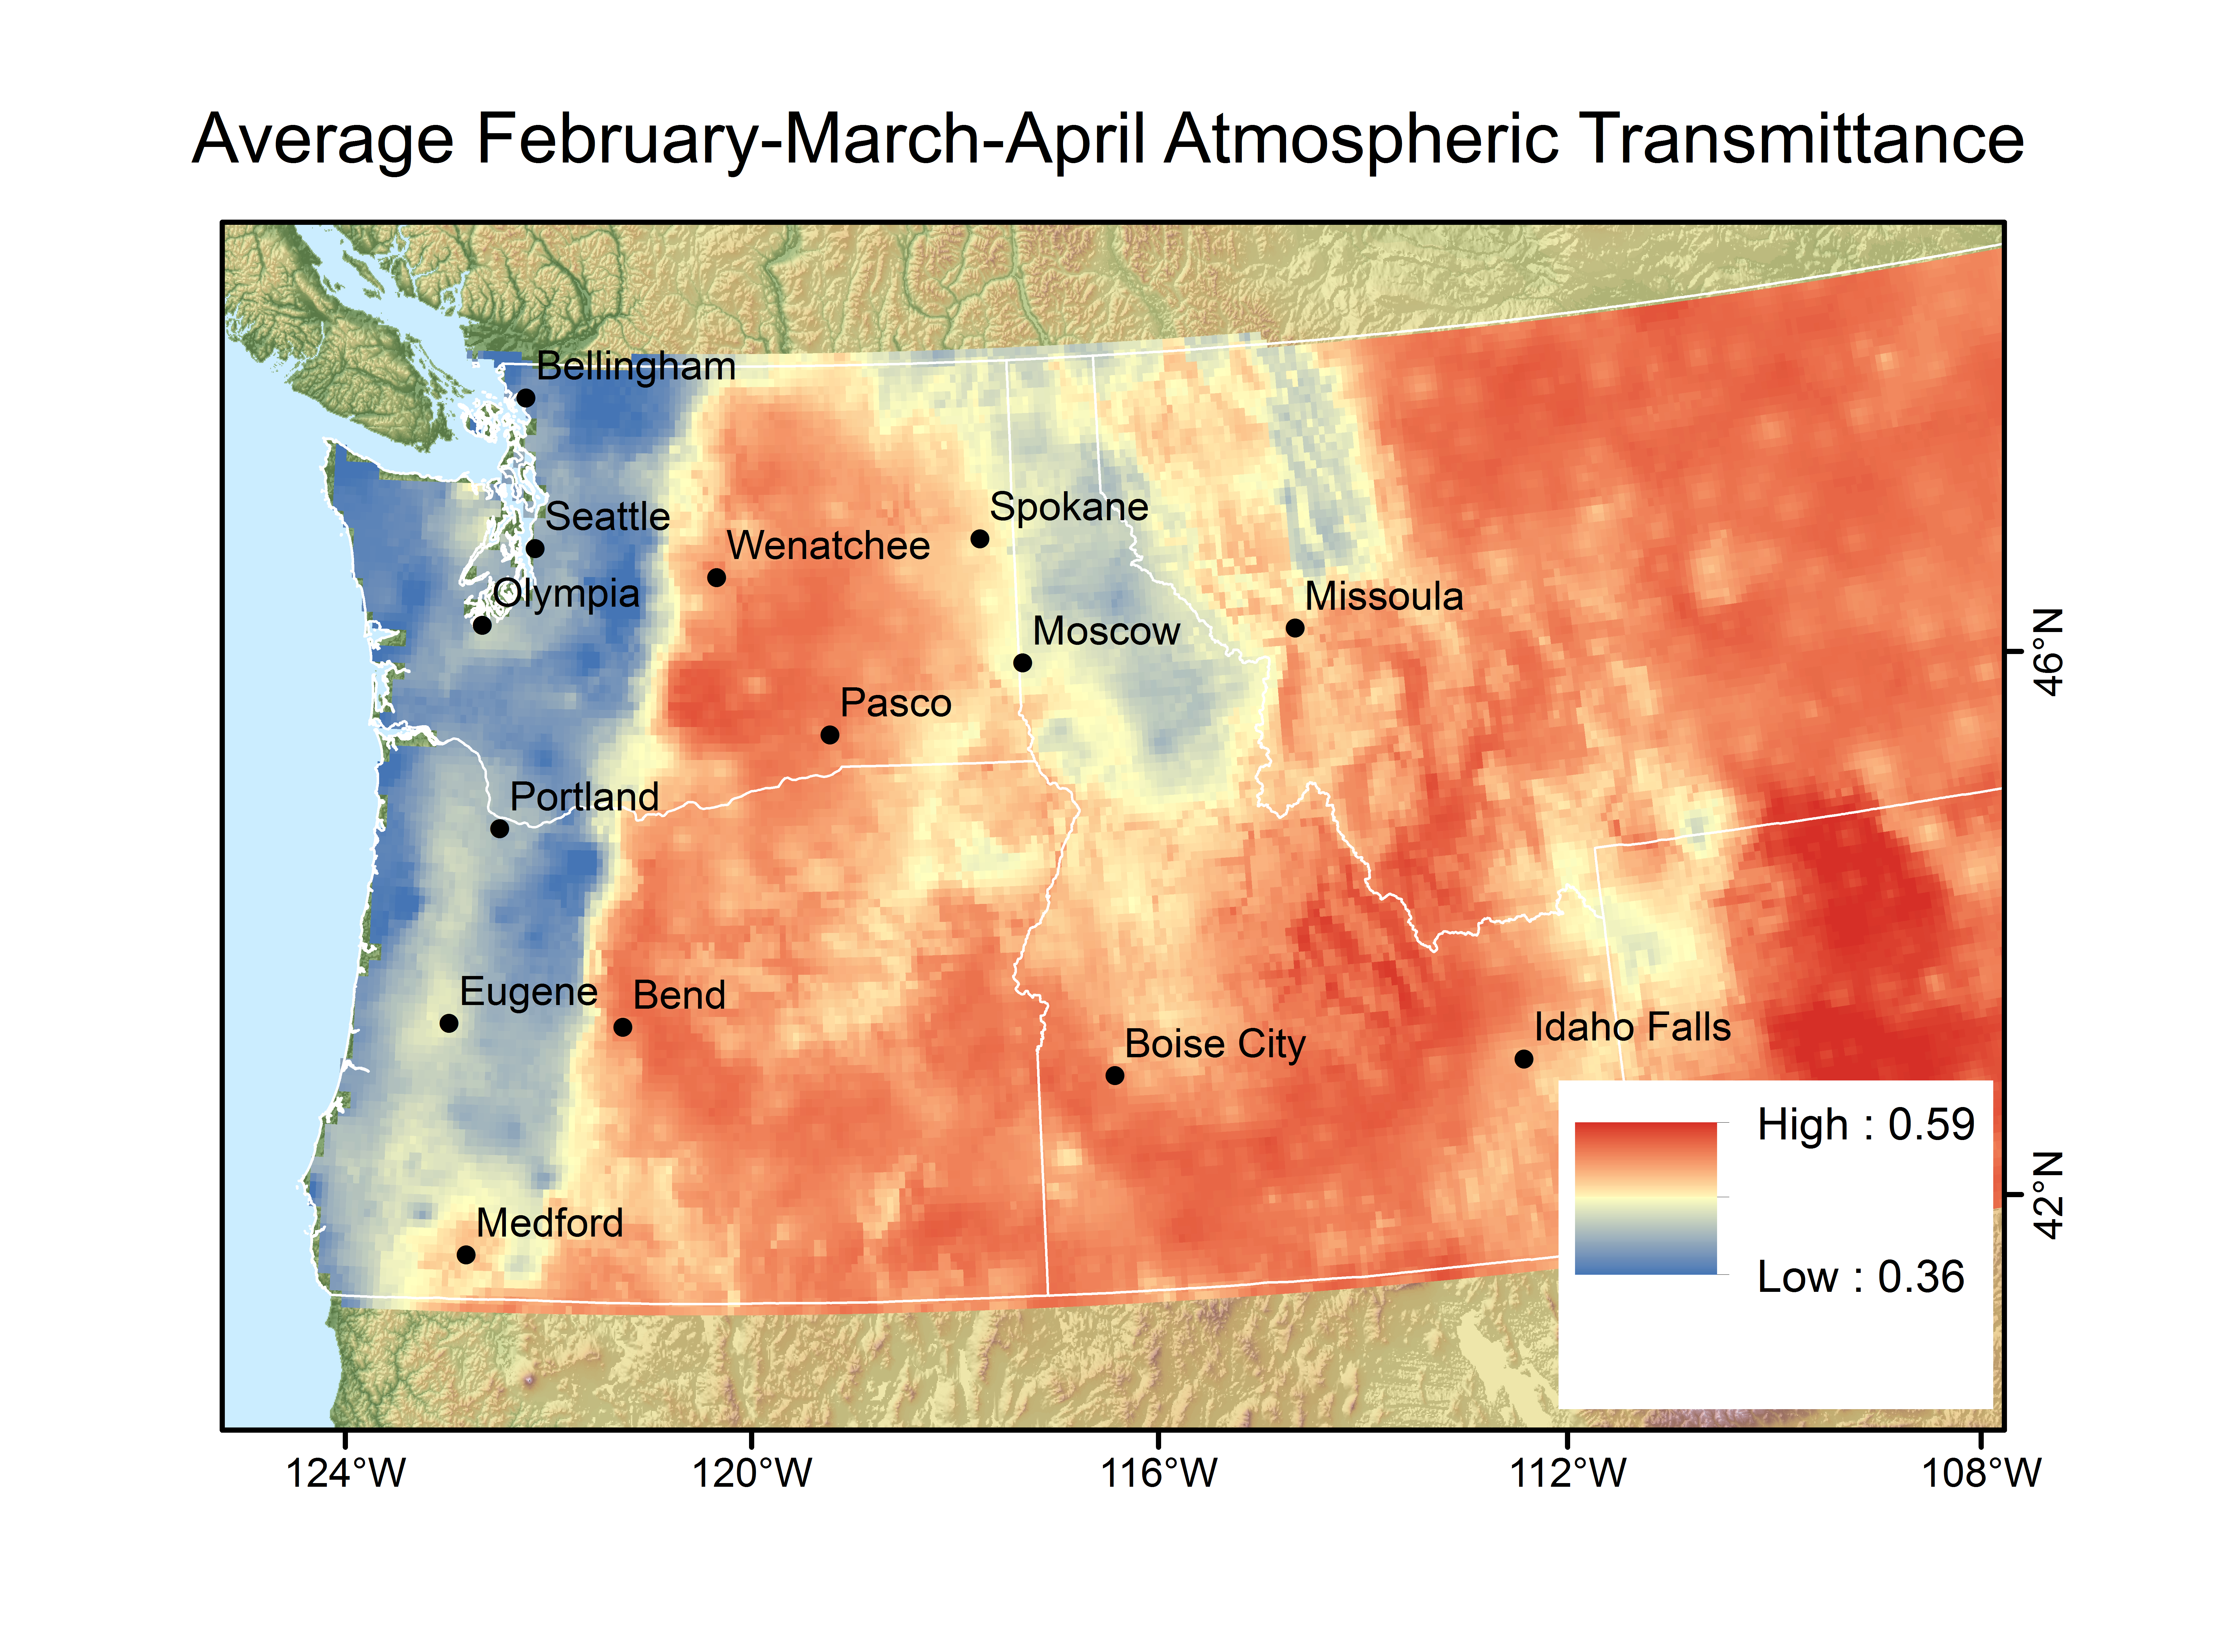 February-March-April cloudiness google earth overlay
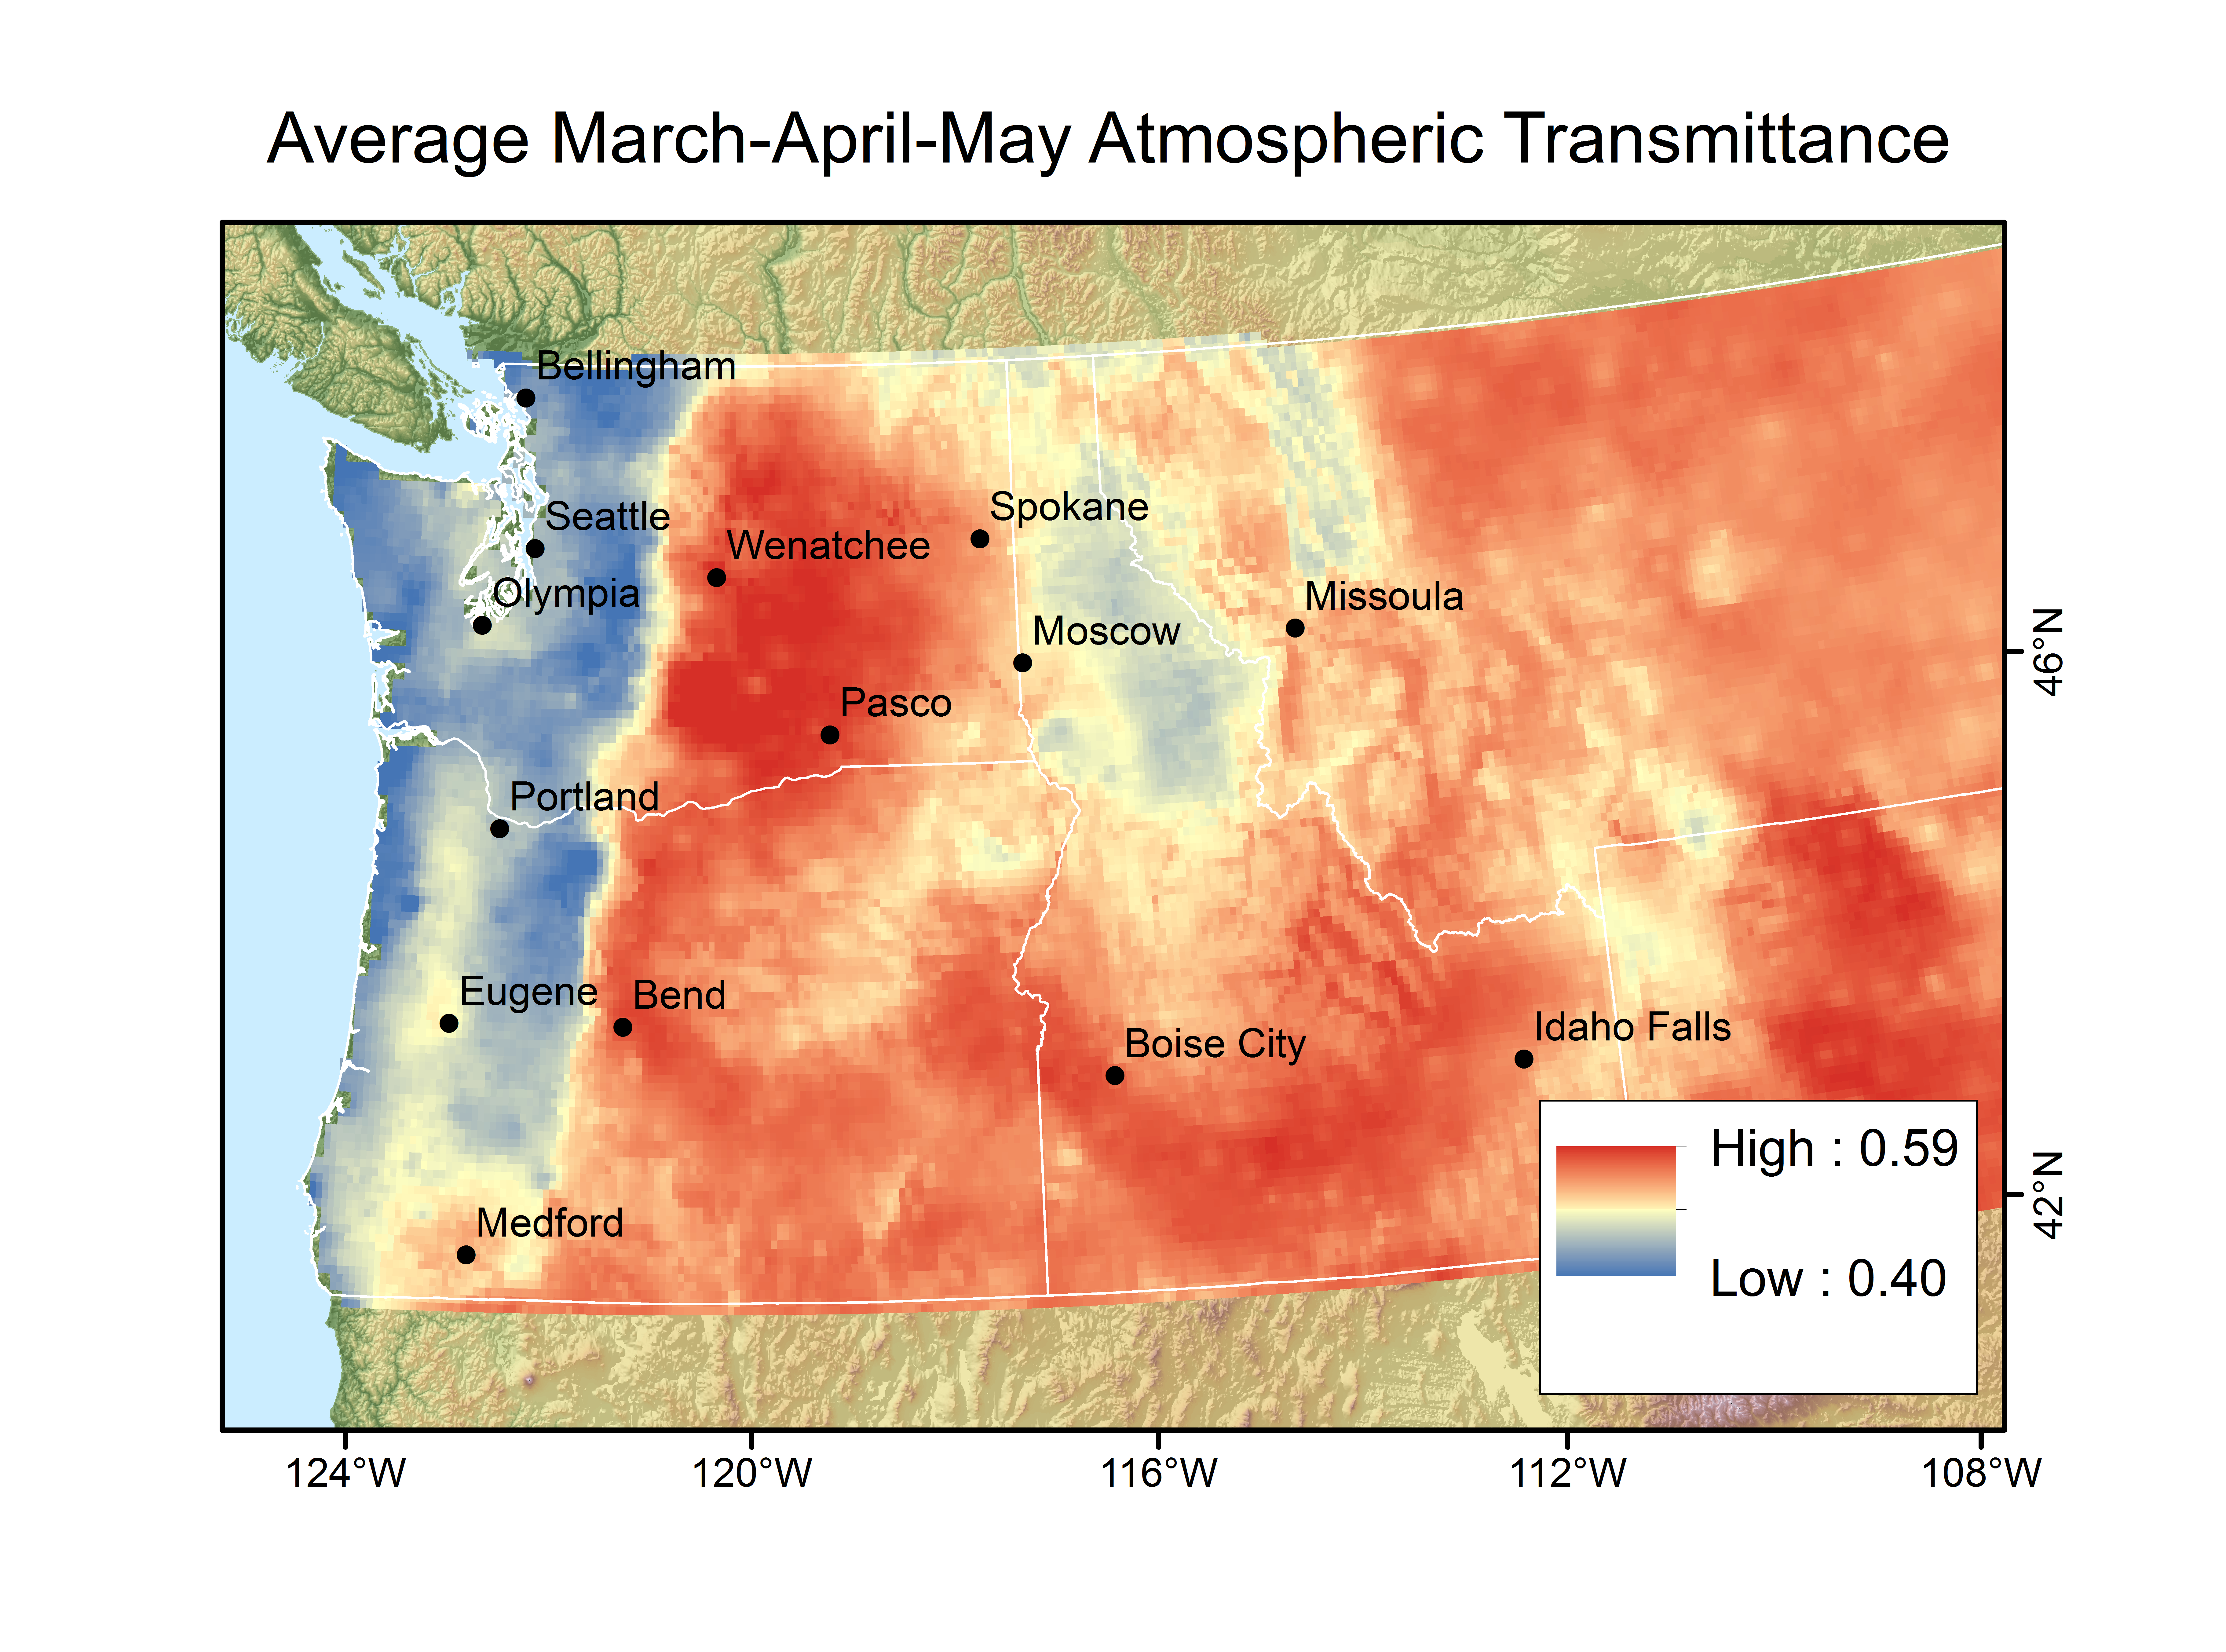 March-April-May cloudiness google earth overlay
 April-May-June cloudiness google earth overlay
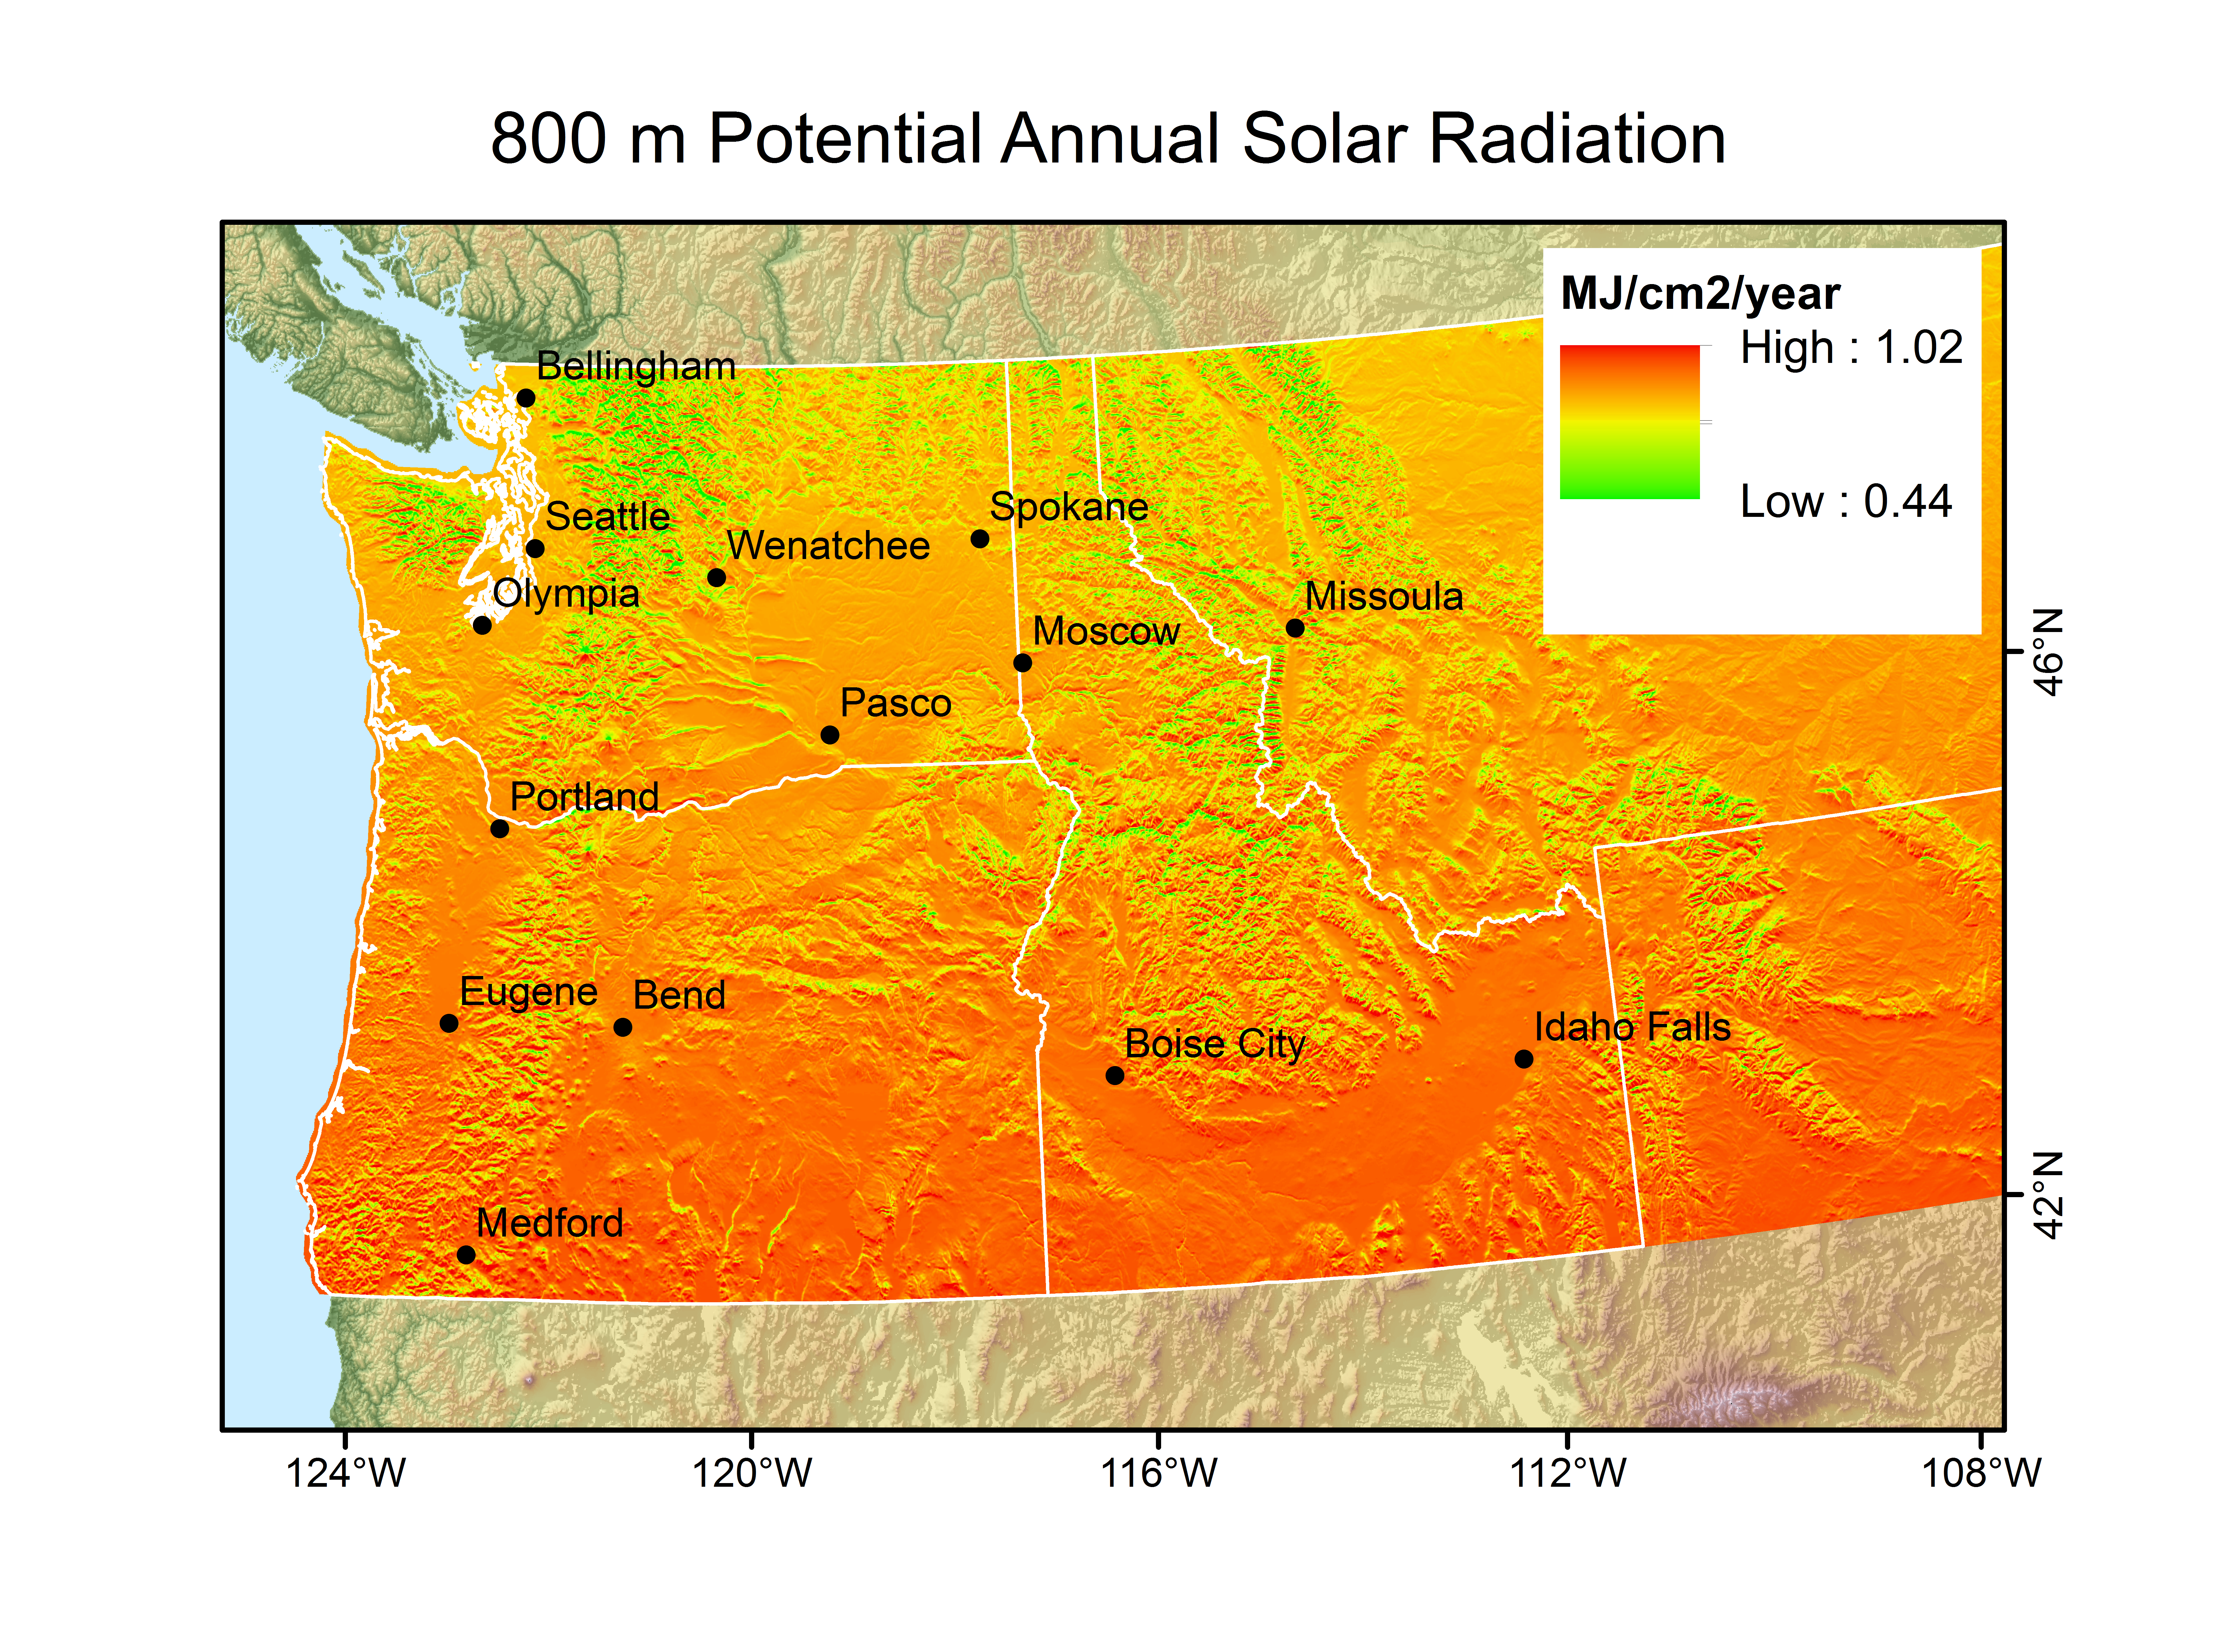
Potential Annual Solar Radiation
Topographic position, including latitude, aspect, and slope, determines the potential total incoming solar radiation incident on a location, neglecting the shading influence of surrounding topography and vegetation. Thus, the highest annual potential solar radiation are on steep, south-facing slopes, whereas the lowest values are on north-facing slopes. This relationship is clearly illustrated in the gridded potential solar radiation over the Cascade volcanoes, where high values correspond with the south side of Mount Rainier, Mount Baker, and others. This map is based on the 800 m digital elevation model from PRISM, and the equation developed by McCune and Keon [2002]. Depending on the scale of interest, a slope-aspect analysis of higher resolution elevation data may be more appropriate for assessing topographic position.
- McCune, B., and D. Keon (2002), Equations for potential annual direct incident radiation and heat load, J. Veg. Sci., 13(4), 603–606, doi:10.1111/j.1654-1103.2002.tb02087.x.
- PRISM Climate Group, Oregon State University. Available from: http://prism.oregonstate.edu
 Potential annual solar radiation google earth overlay
Learn More
Check out our related publications
Material contained here and within the embedded links is based upon work supported by the Northwest Climate Science Center.
Any opinions, findings and conclusions or recommendations expressed in this material are those of the authors and do not necessarily reflect the views of the funding agency.