|
Procedures for estimating pile volume, biomass, and emissions (Back to help)
The Piled Fuels Biomass and Emissions Calculator implements the calculation methods of Hardy (1996) as implemented in CONSUME 3.0 for estimating volume, biomass, and emissions for machine-constructed piles and Wright et al. (2010) for hand-constructed piles. The steps necessary to estimate emissions from pile burning differ for machine and hand piles and are presented separately in the following sections.
Machine Piled Fuels (adapted from Hardy (1996) and the CONSUME 3.0 User’s Guide)
CONSUME 3.0 uses a model developed by Hardy (1996) to estimate piled fuel biomass and to calculate consumption and emissions from pile burns. Unlike other fuel types, consumption of piles is not directly dependent upon fuel particle size. Six steps are required to estimate emissions from a machine-constructed pile or piles of the same shape, size, and composition. The product from each step is both relevant in itself and a prerequisite parameter for completion of the next step. Determine:
- Total gross volume of the pile
- Net volume of the woody biomass
- Density or weighted-average density of wood
- Consumable (oven-dry) mass of wood
- Percentage of mass consumed
- Mass of emissions produced
Volume, biomass, consumption, and emissions for multiple piles of the same shape, size and type are calculated as the amount for a single pile multiplied by the number of piles.
1. Total Gross Volume of the Pile
The volume of a pile is dependent upon its shape. Piles are categorized into one of seven generalized shapes as shown in Figure 1.
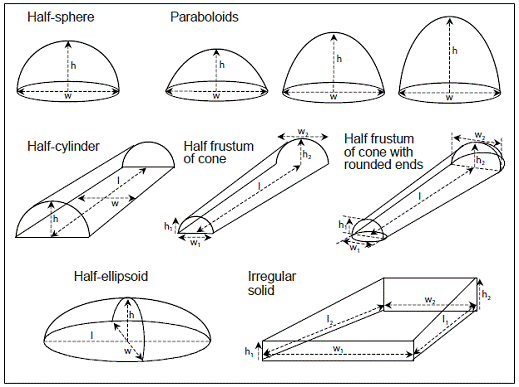
Figure 1 . Geometric pile shapes and required dimensions. Figure 4 from Wright et al. (2010).
The volume for each shape is calculated using various lengths, heights and/or widths. The formulas for each shape are in Table 1.
Table 1. Volume formulas for geometric shapes.
| Shape code † |
Geometric shape |
Volume formula |
| 1 |
Half-sphere |
V = (2 × ∏ × H3)/3 |
| 2 |
Paraboloid |
V = ( ∏ × H × W2)/8 |
| 3 |
Half-cylinder |
V = ( ∏ × H × W × L)/4 |
| 4 |
Half-frustum of a cone |
V = { ∏ × L × [H12 + H22 + (H1 × H2)]}/6 or
V = { ∏ × L × [W12 + W22 + (W1 × W2)]}/24 |
| 5 |
Half-frustum of a cone w/ rounded ends |
V = ∏ × { L × [W12 + W22 + (W1 × W2)] + W13 + W23}/24 |
| 6 |
Half-ellipsoid |
V = ( ∏ × H × W × L)/6 |
| 7 |
Irregular solid |
V = [(L1 + L2)( W1 + W2)(H1 + H2)]/8 |
| † Codes used in batch processing file format |
Pile Volume Adjustment – Some piles may contain a significant percentage of soil within the pile or mounded beneath the pile. Reduce the gross pile volume using an estimate of the percentage of the pile occupied by soil (Formula 1).
(1) Corrected Pile Volume (ft3 or m3) = Gross Pile Volume (ft3 or m3) × (100 - % Soil)
2. Net Volume of the Woody Biomass
Air comprises much of the gross volume of a pile. The ratio of wood volume to the total pile volume is the packing ratio. From destructive measurements of 17 piles, Hardy (1996) found that packing ratio ranges from 0.06 to 0.26. Consume uses the following three default packing ratios:
- Piles with species content dominated by long-needled pines and/or broadleaf deciduous litter. Mean diameters of large woody fuels < 10 inches (25 cm). Packing ratio = 0.1.
- Piles dominated by short-needled conifers. Mean diameters of large woody fuels < 10 inches (25 cm). Packing ratio = 0.2.
- Highly compacted, clean piles with large logs (diameters > 10 inches (25 cm)), especially those built with a crane or loader. Packing ratio = 0.25.
The net wood volume is the gross pile volume multiplied by the appropriate packing ratio (Formula 2).
(2) Net Wood Volume (ft3 or m3) = Gross Pile Volume (ft3 or m3) × Packing Ratio (proportion).
3. Density or Weighted-Average Density of Wood
The oven-dry density of wood is used to calculate mass of wood for fuel loading, fuel consumption, and smoke production. If a pile is composed of more than one species, the calculator will determine a weighted average oven-dry wood density for the piled material to be used to calculate the consumable mass of wood in step four. In the case of a pile or piles of mixed species, select the two most common species based on the composition of the pile(s) and note the proportion of each species in the pile(s).
The tree species wood densities available are listed in the Appendix. Wood density is calculated from specific gravity values found in Miles and Smith (2009), which were compiled from the Wood Handbook (USFS 1999) assuming an ovendry weight and wood volume at 12% moisture content (Formula 3).
(3a) Wood Density (lb/ft3) = 62.4 × Specific Gravity × (1 + 12/100) (formula 3–6b in USFS 1999)
(3b) Wood Density (kg/m3) = 1000 × Specific Gravity × (1 + 12/100) (formula 3–6a in USFS 1999)
4. Consumable (Oven-Dry) Mass of Wood
The consumable mass of wood in a pile is the net wood volume multiplied by the wood density or weighted average wood density (Formula 3).
(3) Mass of Wood (lb or kg) = Net Wood Volume (ft3 or m3) × Wood Density (lb/ft3 or kg/m3)
Multiply consumable mass of wood in pounds or kilograms by 2000 or 1000, respectively to determine mass in tons or megagrams.
5. Percentage of Mass Consumed
The amount of woody mass consumed when piles are burned typically ranges from 75 to 95 percent (Hardy 1996). Several western states have smoke management-reporting programs that recommend values of 85 or 90 percent. CONSUME 3.0 assumes the percentage of mass consumed is 90 percent. Experience and expert knowledge must be used to determine the most appropriate value for percentage consumption.
6. Mass of Emissions Produced
The mass of emissions produced by a fire is calculated by multiplying the mass of fuel consumed by an appropriate emission factor for the emission of interest. Emission factors differ with the combustion efficiency of the fire. Cleaner piles burn more efficiently than dirty piles and produce less of the products of incomplete combustion, of which particulate matter is a major emission species. Expert judgment as well as agency policy must be considered when assessing the cleanliness of a pile or piles and applying the appropriate combustion efficiency.
The rate of smoke emissions produced also varies with the combustion phase of a fir. Less smoke is produced per dry mass of fuel consumed during the more efficient flaming stage of combustion than during the less efficient smoldering and residual stages. Consequently, fuel consumption is analyzed by combustion stage to produce the best estimates for total emissions.
The flaming, smoldering, and residual combustion emission factors used to calculate total emissions are listed in Tables 3 and 4. These emission factors are weighted according to the amount of fuel consumed in each combustion phase (Formula 4). CONSUME 3.0 assumes that 70 percent of the consumption occurs during the flaming phase of combustion, 15 percent occurs during the smoldering phase of combustion, and 15 percent occurs during the glowing phase of combustion. Total emissions are simply the sum of emissions during flaming, smoldering, and residual combustion.
(4) Emissions (lb or kg) = Emission Factor (lb/ton or kg/Mg) × (Fuel Consumed (tons or Mg) × Combustion Phase (proportion))
Multiply total emissions in pounds or kilograms by 2000 or 1000, respectively to determine total emissions in tons or megagrams.
Table 3. Emission factors for particulate matter (PM, PM10, PM2.5) for different levels of combustion efficiency after Hardy (1996). Clean piles burn with greater combustion efficiency.
| |
Emission factor by pile quality
(lb emission/ton fuel consumed) |
Emission factor by pile quality
(kg emission/Mg fuel consumed) |
| Pollutant |
Clean |
Dirty |
Really Dirty |
Clean |
Dirty |
Really Dirty |
| PM |
21.9 |
27.0 |
36.0 |
10.9 |
13.5 |
18.0 |
| PM10 |
15.5 |
20.0 |
28.0 |
7.7 |
10.0 |
14.0 |
| PM2.5 |
13.5 |
17.0 |
23.6 |
6.7 |
8.5 |
11.8 |
Table 4. Emission factors for carbon dioxide (CO2), carbon monoxide (CO), methane (CH4), and non-methane hydrocarbons (NMHC) for different phases of combustion. Emission factors taken from the CONSUME 3.0 User’s Guide.
| |
Emission factor by combustion phase
(lb emission/ton fuel consumed) |
Emission factor by combustion phase
(kg emission/Mg fuel consumed) |
| Pollutant |
Flaming |
Smoldering |
Residual |
Flaming |
Smoldering |
Residual |
| CO |
52.66 |
130.37 |
130.37 |
26.33 |
65.19 |
65.19 |
| CO2* |
3429.24 |
3089.88 |
3089.88 |
1714.62 |
1544.94 |
1544.94 |
| CH4 |
3.28 |
11.03 |
11.03 |
1.64 |
5.52 |
5.52 |
| NMHC |
3.56 |
6.78 |
6.78 |
1.78 |
3.39 |
3.39 |
*A correction was made to the calculation for CO2 emissions in April 2010.
The emissions factors used previously in Consume were found to be off by a factor of 0.5.
Recommendations and Guidance
The largest errors expected from using these guidelines will occur during the process of determining the gross pile volume(s).
The seven stylized pile shapes do not provide an exhaustive choice of geometric shapes for piled slash.
These seven are presented because they reflect general shapes observed by the author [Hardy 1996] and other experts,
and also because their volumes can be calculated relatively easily from the formulae. When the dimensions for a pile are observed,
care must be taken to account for irregularities in the pile's surfaces. Try to mentally "smooth" the lobes, ridges,
and valleys into an average, smooth surface. Long logs and poles extending from the pile's nominal surface can be accounted for
by increasing the dimensions of the pile appropriately. If a significant amount of soil is either entrained within the pile
or mounded beneath it, the volume of the soil must be estimated and subtracted from the gross pile volume.
The packing ratios presented in these guidelines represent empirical field data from destructive sampling of 17 piles.
Even though guidelines are provided to determine an appropriate packing ratio for specific piles, an agency or administrative
unit may choose to specify packing ratios for applications under their jurisdiction.
A continuous range of emission factors for PM, PM10, and PM2.5 are possible. The values given for
piles with different amounts of soil contamination are weighted means from eight in situ field tests of emissions
from burning of piles of woody debris. Results from many other related tests were used to develop the relationship for
predicting emission factors by using combustion efficiency. The values for PM 10 were not derived from actual field
observations – only PM2.5 and PM were measured in the field tests from which these data were prepared.
PM10 emission factors were estimated by using limited knowledge of the size distribution of particles.
Hand Piled Fuels (adapted from Wright et al. (2010))
Relationships developed by Wright et al. (2010) are used to estimate hand pile biomass and to calculate consumption and
emissions from pile burns. Unlike other fuel categories, consumption of piles is not directly dependent upon fuel particle size.
Five steps are required to estimate emissions from a hand-constructed pile or piles of the same shape, size, and composition.
Determine:
- Geometric volume of the pile
- Corrected volume of the pile
- Consumable (oven-dry) mass of wood
- Percentage of mass consumed
- Mass of emissions produced
Volume, biomass, consumption, and emissions for multiple piles of the same shape, size and type are calculated as the amount
for a single pile multiplied by the number of piles.
1. Geometric Volume of the Pile
The volume of a pile is dependent upon its shape. Piles are categorized into one of seven generalized shapes as shown in Figure 1.
Wright et al. (2010) found hand piles to be predominantly paraboloid and ellipsoid in shape. The volume for each shape is
calculated using various lengths, heights and/or widths. The equations for each shape are in Table 1.
2. Adjusted Volume of the Pile
Geometric volume is adjusted to reflect what Wright et al (2010) termed true volume (Formula 5 or 6),
depending on the calculated geometric volume.
If geometric volume is less than 1 m3 or 35.3 ft3:
(5a) Adjusted Pile Volume (m3) = e0.2106 × Geometric Volume (m3)
(5b) Adjusted Pile Volume (ft3) = 35.3 × e0.2106 × (Geometric Volume (ft3)/35.3)
If geometric volume is greater than or equal to 1 m3 or 35.3 ft3:
(6a) Adjusted Pile Volume (m3) = e(0.2106 + 0.7691 × ln(Geometric Volume (m3)))
(6b) Adjusted Pile Volume (ft3) = 35.3 × e(0.2106 + 0.7691 × ln(Geometric Volume (ft3)/35.3))
3. Consumable (Oven-Dry) Mass of Wood
The mass of hand-piled fuels is determined by using regression relationships reported in Wright et al. (2010).
Conifer-dominated hand piles tend to be heavier for a given pile volume than shrub/hardwood-dominated hand piles;
the relationship between volume and mass is modeled with separate equations (Formula 7 or 8).
If the hand pile is composed of coniferous material:
(7a) Mass of Wood (kg) = e(4.4281 + 0.8028 × ln(Adjusted Volume (m3)))
(7b) Mass of Wood (lb) = 2.2 × e(4.4281 + 0.8028 × ln(Adjusted Volume (ft3)/35.3))
If the hand pile is composed of shrub and hardwood material:
(8a) Mass of Wood (kg) = e(3.0393 + 1.3129 × ln(Adjusted Volume (m3)))
(8b) Mass of Wood (lb) = 2.2 × e(3.0393 + 1.3129 × ln(Adjusted Volume (ft3)/35.3))
Multiply consumable mass of wood in pounds or kilograms by 2000 or 1000, respectively to determine mass in tons or megagrams.
4. Percentage of Mass Consumed
Hardy (1996) found that the amount of woody mass consumed when machine piles are burned ranges from 75 to 95 percent.
It is assumed that consumption of hand piles is similar to consumption of machine piles. Several western states have
smoke management-reporting programs that recommend values of 85 or 90 percent.
CONSUME 3.0 assumes the
percentage of mass consumed is 90 percent. Experience and expert knowledge must be used to determine the most
appropriate value for percentage consumption.
5. Mass of Emissions Produced
As with machine piles, the mass of emissions produced when hand piles are burned is calculated by multiplying the mass of
fuel consumed by an appropriate emission factor for the emission of interest. Emission factors differ with the combustion
efficiency of the fire. Cleaner piles burn more efficiently than dirty piles and produce less of the products of incomplete
combustion, of which particulate matter is a major emission species. By virtue of the manner in which they are constructed,
hand piles contain very little, if any, soil contamination and are considered clean for the purposes of selecting the
proper emission factor from Table 3.
The rate of smoke emissions produced also varies with the combustion phase of a fire. Less smoke is produced per dry mass of
fuel consumed during the more efficient flaming stage of combustion than during the less efficient smoldering and residual stages.
Consequently, fuel consumption is analyzed by combustion stage to produce the best estimates for total emissions.
The flaming, smoldering, and residual combustion emission factors used to calculate total emissions are listed in Tables 3 and 4.
These emission factors are weighted according to the amount of fuel consumed in each combustion phase (Formula 4). Multiply total
emissions in pounds or kilograms by 2000 or 1000, respectively to determine total emissions in tons or megagrams.
Literature Cited
CONSUME 3.0 user’s guide. no date.
Seattle, WA: U.S. Department of Agriculture, Forest Service, Pacific Northwest Research Station. 234 p.
https://www.fs.fed.us/pnw/fera/research/smoke/consume/consume30_users_guide.pdf (10 Dec 2010).
Hardy, C.C. 1996. Guidelines for estimating volume, biomass and smoke production for piled slash.
Gen. Tech. Rep. PNW-GTR-364. Portland, OR: U.S. Department of Agriculture, Forest Service, Pacific Northwest Research Station. 17 p.
Miles, P.D.; Smith, W.B. 2009. Specific gravity and other properties of wood and bark for 156
tree species found in North America. Res. Note NRS-38. Newtown Square, PA: U.S. Department of Agriculture, Forest Service,
Northern Research Station. 35 p.
U.S. Department of Agriculture, Forest Service [USFS]. 1999. Wood handbook–wood as an
engineering material. Gen. Tech. Rep. FPL-GTR-113. Madison, WI: Forest Products Laboratory. 463 p.
Wright, C.S.; Balog, C.S.; Kelly, J.W. 2010. Estimating volume, biomass, and potential
emissions of hand-piled fuels. Gen. Tech. Rep. PNW-GTR-805. Portland, OR: U.S. Department of Agriculture, Forest Service,
Pacific Northwest Research Station. 23 p.
Appendix
Table A.1. Wood density and specific gravity listed in alphabetical order by common name.
| Common name |
Scientific name |
Specific Gravity† |
Density (lbs/ft3) |
Density (g/cm3) |
| ailanthus |
Ailanthus altissima |
0.53 |
37.0 |
0.59 |
| Alaska yellow cedar |
Chamaecyparis nootkatensis |
0.44 |
30.8 |
0.49 |
| alligator juniper |
Juniperus deppeana |
0.51 |
35.6 |
0.57 |
| American basswood |
Tilia americana |
0.37 |
25.9 |
0.41 |
| American beech |
Fagus grandifolia |
0.64 |
44.7 |
0.72 |
| American chestnut |
Castanea dentata |
0.43 |
30.1 |
0.48 |
| American elm |
Ulmus americana |
0.50 |
34.9 |
0.56 |
| American holly |
Ilex opaca |
0.57 |
39.8 |
0.64 |
| American hophornbeam |
Ostrya virginiana |
0.70 |
48.9 |
0.78 |
| American hornbeam (ironwood) |
Carpinus caroliniana |
0.70 |
48.9 |
0.78 |
| American sycamore |
Platanus occidentalis |
0.49 |
34.2 |
0.55 |
| apple |
Malus spp. |
0.67 |
46.8 |
0.75 |
| Atlantic white cedar |
Chamaecyparis thyoides |
0.32 |
22.4 |
0.36 |
| Australian pine |
Casuarina equisetifolia |
0.88 |
61.5 |
0.99 |
| baldcypress |
Taxodium distichum |
0.46 |
32.1 |
0.52 |
| balsam fir |
Abies balsamea |
0.35 |
24.5 |
0.39 |
| balsam poplar |
Populus balsamifera |
0.34 |
23.8 |
0.38 |
| bigleaf maple |
Acer macrophyllum |
0.48 |
33.5 |
0.54 |
| bigtooth aspen |
Populus grandidentata |
0.39 |
27.3 |
0.44 |
| Bishop pine |
Pinus muricata |
0.49 |
34.2 |
0.55 |
| bitternut hickory |
Carya cordiformis |
0.66 |
46.1 |
0.74 |
| black ash |
Fraxinus nigra |
0.49 |
34.2 |
0.55 |
| black cherry |
Prunus serotina |
0.50 |
34.9 |
0.56 |
| black cottonwood |
Populus trichocarpa |
0.35 |
24.5 |
0.39 |
| black locust |
Robinia pseudoacacia |
0.69 |
48.2 |
0.77 |
| black maple |
Acer nigrum |
0.57 |
39.8 |
0.64 |
| black oak |
Quercus velutina |
0.61 |
42.6 |
0.68 |
| black spruce |
Picea mariana |
0.46 |
32.1 |
0.52 |
| black walnut |
Juglans nigra |
0.55 |
38.4 |
0.62 |
| black willow |
Salix nigra |
0.39 |
27.3 |
0.44 |
| blackgum |
Nyssa sylvatica |
0.50 |
34.9 |
0.56 |
| blue ash |
Fraxinus quadrangulata |
0.58 |
40.5 |
0.65 |
| bluegum |
Eucalyptus globulus |
0.80 |
55.9 |
0.90 |
| boxelder |
Acer negundo |
0.46 |
32.1 |
0.52 |
| bur oak |
Quercus macrocarpa |
0.64 |
44.7 |
0.72 |
| butternut |
Juglans cinerea |
0.38 |
26.6 |
0.43 |
| California black oak |
Quercus kelloggii |
0.55 |
38.4 |
0.62 |
| California laurel |
Umbellularia californica |
0.55 |
38.4 |
0.62 |
| California white oak |
Quercus lobata |
0.58 |
40.5 |
0.65 |
| canyon live oak |
Quercus chrysolepis |
0.74 |
51.7 |
0.83 |
| cedar elm |
Ulmus crassifolia |
0.64 |
44.7 |
0.72 |
| cherrybark oak |
Quercus pagoda |
0.69 |
48.2 |
0.77 |
| chestnut oak |
Quercus prinus |
0.66 |
46.1 |
0.74 |
| coast redwood |
Sequoia sempervirens |
0.38 |
26.6 |
0.43 |
| common hackberry |
Celtis occidentalis |
0.53 |
37.0 |
0.59 |
| cucumber tree |
Magnolia acuminata |
0.48 |
33.5 |
0.54 |
| Douglas-fir |
Pseudotsuga menziesii |
0.48 |
33.5 |
0.54 |
| eastern cottonwood |
Populus deltoides |
0.40 |
28.0 |
0.45 |
| eastern hemlock |
Tsuga canadensis |
0.40 |
28.0 |
0.45 |
| eastern red cedar |
Juniperus virginiana |
0.47 |
32.8 |
0.53 |
| eastern white pine |
Pinus strobus |
0.35 |
24.5 |
0.39 |
| Engelmann spruce |
Picea engelmannii |
0.35 |
24.5 |
0.39 |
| flowering dogwood |
Cornus florida |
0.73 |
51.0 |
0.82 |
| Fremont cottonwood |
Populus fremontii |
0.45 |
31.4 |
0.50 |
| gambel oak |
Quercus gambelii |
0.63 |
44.0 |
0.71 |
| giant sequoia |
Sequoiadendron giganteum |
0.38 |
26.6 |
0.43 |
| golden chinkapin |
Chrysolepis chrysophylla |
0.46 |
32.1 |
0.52 |
| grand fir |
Abies grandis |
0.37 |
25.9 |
0.41 |
| gray birch |
Betula populifolia |
0.51 |
35.6 |
0.57 |
| gray pine |
Pinus sabiniana |
0.43 |
30.1 |
0.48 |
| green ash |
Fraxinus pennsylvanica |
0.56 |
39.1 |
0.63 |
| gumbo limbo |
Bursera simaruba |
0.35 |
24.5 |
0.39 |
| honey mesquite |
Prosopis glandulosa |
0.82 |
57.3 |
0.92 |
| honeylocust |
Gleditsia triacanthos |
0.65 |
45.4 |
0.73 |
| incense cedar |
Calocedrus decurrens |
0.37 |
25.9 |
0.41 |
| jack pine |
Pinus banksiana |
0.43 |
30.1 |
0.48 |
| Jeffrey pine |
Pinus jeffreyi |
0.42 |
29.4 |
0.47 |
| Kentucky coffeetree |
Gymnocladus dioicus |
0.60 |
41.9 |
0.67 |
| knobcone pine |
Pinus attenuata |
0.42 |
29.4 |
0.47 |
| koa |
Acacia koa |
0.55 |
38.4 |
0.62 |
| laurel oak |
Quercus laurifolia |
0.63 |
44.0 |
0.71 |
| limber pine |
Pinus flexilis |
0.42 |
29.4 |
0.47 |
| live oak |
Quercus virginiana |
0.88 |
61.5 |
0.99 |
| loblolly pine |
Pinus taeda |
0.51 |
35.6 |
0.57 |
| lodgepole pine |
Pinus contorta |
0.41 |
28.7 |
0.46 |
| longleaf pine |
Pinus palustris |
0.59 |
41.2 |
0.66 |
| mahogany |
Swietenia mahagoni |
0.60 |
41.9 |
0.67 |
| mockernut hickory |
Carya tomontosa |
0.72 |
50.3 |
0.81 |
| Monterey pine |
Pinus radiata |
0.53 |
37.0 |
0.59 |
| mountain hemlock |
Tsuga mertensiana |
0.45 |
31.4 |
0.50 |
| mountain magnolia |
Magnolia fraseri |
0.44 |
30.8 |
0.49 |
| noble fir |
Abies procera |
0.39 |
27.3 |
0.44 |
| northern catalpa |
Catalpa speciosa |
0.41 |
28.7 |
0.46 |
| northern red oak |
Quercus rubra |
0.63 |
44.0 |
0.71 |
| northern white cedar |
Thuja occidentalis |
0.31 |
21.7 |
0.35 |
| nutmeg hickory |
Carya myristiciformis |
0.60 |
41.9 |
0.67 |
| Oregon ash |
Fraxinus latifolia |
0.55 |
38.4 |
0.62 |
| Oregon white oak |
Quercus garryana |
0.72 |
50.3 |
0.81 |
| osage-orange |
Maclura pomifera |
0.85 |
59.4 |
0.95 |
| overcup oak |
Quercus lyrata |
0.63 |
44.0 |
0.71 |
| Pacific dogwood |
Cornus occidentalis |
0.62 |
43.3 |
0.69 |
| Pacific madrone |
Arbutus menziesii |
0.65 |
45.4 |
0.73 |
| Pacific silver fir |
Abies amabilis |
0.43 |
30.1 |
0.48 |
| Pacific yew |
Taxus brevifolia |
0.67 |
46.8 |
0.75 |
| paper birch |
Betula papyrifera |
0.55 |
38.4 |
0.62 |
| paperbark tree |
Melaleuca quinquenervia |
0.72 |
50.3 |
0.81 |
| pecan hickory |
Carya illinoensis |
0.66 |
46.1 |
0.74 |
| persimmon |
Diospyros virginiana |
0.74 |
51.7 |
0.83 |
| pignut hickory |
Carya glabra |
0.75 |
52.4 |
0.84 |
| pin oak |
Quercus palustris |
0.63 |
44.0 |
0.71 |
| pinyon pine |
Pinus edulis |
0.57 |
39.8 |
0.64 |
| pitch pine |
Pinus rigida |
0.52 |
36.3 |
0.58 |
| pond pine |
Pinus serotina |
0.56 |
39.1 |
0.63 |
| ponderosa pine |
Pinus ponderosa |
0.40 |
28.0 |
0.45 |
| Port-Orford cedar |
Chamaecyparis lawsoniana |
0.43 |
30.1 |
0.48 |
| post oak |
Quercus stellata |
0.67 |
46.8 |
0.75 |
| pumpkin ash |
Fraxinus profunda |
0.52 |
36.3 |
0.58 |
| quaking aspen |
Populus tremuloides |
0.38 |
26.6 |
0.43 |
| red alder |
Alnus rubra |
0.41 |
28.7 |
0.46 |
| red fir |
Abies magnifica |
0.38 |
26.6 |
0.43 |
| red mangrove |
Rhizophora mangle |
0.96 |
67.1 |
1.08 |
| red maple |
Acer rubrum |
0.54 |
37.7 |
0.60 |
| red pine |
Pinus resinosa |
0.46 |
32.1 |
0.52 |
| red spruce |
Picea rubens |
0.40 |
28.0 |
0.45 |
| redbud |
Cercis canadensis |
0.58 |
40.5 |
0.65 |
| river birch |
Betula nigra |
0.56 |
39.1 |
0.63 |
| rock elm |
Ulmus thomasii |
0.63 |
44.0 |
0.71 |
| sand pine |
Pinus clausa |
0.48 |
33.5 |
0.54 |
| sassafras |
Sassafras albidum |
0.46 |
32.1 |
0.52 |
| scarlet oak |
Quercus coccinea |
0.67 |
46.8 |
0.75 |
| scarlet oak |
Quercus coccinea |
0.67 |
46.8 |
0.75 |
| serviceberry |
Amelanchier spp. |
0.79 |
55.2 |
0.88 |
| shagbark hickory |
Carya ovata |
0.72 |
50.3 |
0.81 |
| shellbark hickory |
Carya laciniosa |
0.69 |
48.2 |
0.77 |
| shortleaf pine |
Pinus echinata |
0.51 |
35.6 |
0.57 |
| silver maple |
Acer saccharinum |
0.47 |
32.8 |
0.53 |
| Silverbell |
Halesia spp. |
0.45 |
31.4 |
0.50 |
| Sitka spruce |
Picea sitchensis |
0.36 |
25.2 |
0.40 |
| slash pine |
Pinus elliottii |
0.59 |
41.2 |
0.66 |
| slippery elm |
Ulmus fulva |
0.53 |
37.0 |
0.59 |
| sourwood |
Oxydendrum arboreum |
0.55 |
38.4 |
0.62 |
| southern magnolia |
Magnolia grandiflora |
0.50 |
34.9 |
0.56 |
| southern red cedar |
Juniperus virginiana |
0.44 |
30.8 |
0.49 |
| southern red oak |
Quercus falcata |
0.59 |
41.2 |
0.66 |
| spruce pine |
Pinus glabra |
0.44 |
30.8 |
0.49 |
| striped maple |
Acer pensylvanicum |
0.46 |
32.1 |
0.52 |
| subalpine fir |
Abies lasiocarpa |
0.32 |
22.4 |
0.36 |
| sugar maple |
Acer saccharum |
0.63 |
44.0 |
0.71 |
| sugar pine |
Pinus lambertiana |
0.36 |
25.2 |
0.40 |
| swamp chestnut oak |
Quercus michauxii |
0.67 |
46.8 |
0.75 |
| swamp white oak |
Quercus bicolor |
0.72 |
50.3 |
0.81 |
| sweet birch |
Betula lenta |
0.65 |
45.4 |
0.73 |
| sweetbay magnolia |
Magnolia virginiana |
0.46 |
32.1 |
0.52 |
| sweetgum |
Liquidambar styraciflua |
0.52 |
36.3 |
0.58 |
| Table mountain pine |
Pinus pungens |
0.52 |
36.3 |
0.58 |
| tamarack |
Larix laricina |
0.53 |
37.0 |
0.59 |
| tanoak |
Lithocarpus densiflorus |
0.62 |
43.3 |
0.69 |
| Utah juniper |
Juniperus osteosperma |
0.72 |
50.3 |
0.81 |
| Virginia pine |
Pinus virginiana |
0.48 |
33.5 |
0.54 |
| water hickory |
Carya aquatica |
0.62 |
43.3 |
0.69 |
| water oak |
Quercus nigra |
0.63 |
44.0 |
0.71 |
| water tupelo |
Nyssa aquatica |
0.50 |
34.9 |
0.56 |
| western hemlock |
Tsuga heterophylla |
0.45 |
31.4 |
0.50 |
| western larch |
Larix occidentalis |
0.52 |
36.3 |
0.58 |
| western redcedar |
Thuja plicata |
0.32 |
22.4 |
0.36 |
| western white pine |
Pinus monticola |
0.38 |
26.6 |
0.43 |
| white ash |
Fraxinus americana |
0.60 |
41.9 |
0.67 |
| white fir |
Abies concolor |
0.39 |
27.3 |
0.44 |
| white oak |
Quercus alba |
0.68 |
47.5 |
0.76 |
| white spruce |
Picea glauca |
0.40 |
28.0 |
0.45 |
| willow oak |
Quercus phellos |
0.69 |
48.2 |
0.77 |
| winged elm |
Ulmus alata |
0.66 |
46.1 |
0.74 |
| yellow birch |
Betula alleghaniensis |
0.62 |
43.3 |
0.69 |
| yellow buckeye |
Aesculus flava |
0.36 |
25.2 |
0.40 |
| yellow poplar |
Liriodendron tulipifera |
0.42 |
29.4 |
0.47 |
| †12% moisture content volume basis |
Table A.2. Wood density and specific gravity listed in alphabetical order by scientific name.
| Common name |
Scientific name |
Specific Gravity† |
Density (lbs/ft3) |
Density (g/cm3) |
| Pacific silver fir |
Abies amabilis |
0.43 |
30.1 |
0.48 |
| balsam fir |
Abies balsamea |
0.35 |
24.5 |
0.39 |
| white fir |
Abies concolor |
0.39 |
27.3 |
0.44 |
| grand fir |
Abies grandis |
0.37 |
25.9 |
0.41 |
| subalpine fir |
Abies lasiocarpa |
0.32 |
22.4 |
0.36 |
| red fir |
Abies magnifica |
0.38 |
26.6 |
0.43 |
| noble fir |
Abies procera |
0.39 |
27.3 |
0.44 |
| koa** |
Acacia koa |
0.55 |
38.4 |
0.62 |
| bigleaf maple |
Acer macrophyllum |
0.48 |
33.5 |
0.54 |
| boxelder |
Acer negundo |
0.46 |
32.1 |
0.52 |
| black maple |
Acer nigrum |
0.57 |
39.8 |
0.64 |
| striped maple |
Acer pensylvanicum |
0.46 |
32.1 |
0.52 |
| red maple |
Acer rubrum |
0.54 |
37.7 |
0.60 |
| silver maple |
Acer saccharinum |
0.47 |
32.8 |
0.53 |
| sugar maple |
Acer saccharum |
0.63 |
44.0 |
0.71 |
| yellow buckeye |
Aesculus flava |
0.36 |
25.2 |
0.40 |
| ailanthus |
Ailanthus altissima |
0.53 |
37.0 |
0.59 |
| red alder |
Alnus rubra |
0.41 |
28.7 |
0.46 |
| serviceberry |
Amelanchier spp. |
0.79 |
55.2 |
0.88 |
| Pacific madrone |
Arbutus menziesii |
0.65 |
45.4 |
0.73 |
| yellow birch |
Betula alleghaniensis |
0.62 |
43.3 |
0.69 |
| sweet birch |
Betula lenta |
0.65 |
45.4 |
0.73 |
| river birch |
Betula nigra |
0.56 |
39.1 |
0.63 |
| paper birch |
Betula papyrifera |
0.55 |
38.4 |
0.62 |
| gray birch |
Betula populifolia |
0.51 |
35.6 |
0.57 |
| gumbo limbo |
Bursera simaruba |
0.35 |
24.5 |
0.39 |
| incense cedar |
Calocedrus decurrens |
0.37 |
25.9 |
0.41 |
| American hornbeam (ironwood) |
Carpinus caroliniana |
0.70 |
48.9 |
0.78 |
| water hickory |
Carya aquatica |
0.62 |
43.3 |
0.69 |
| bitternut hickory |
Carya cordiformis |
0.66 |
46.1 |
0.74 |
| pignut hickory |
Carya glabra |
0.75 |
52.4 |
0.84 |
| pecan hickory |
Carya illinoensis |
0.66 |
46.1 |
0.74 |
| shellbark hickory |
Carya laciniosa |
0.69 |
48.2 |
0.77 |
| nutmeg hickory |
Carya myristiciformis |
0.60 |
41.9 |
0.67 |
| shagbark hickory |
Carya ovata |
0.72 |
50.3 |
0.81 |
| mockernut hickory |
Carya tomontosa |
0.72 |
50.3 |
0.81 |
| American chestnut |
Castanea dentata |
0.43 |
30.1 |
0.48 |
| Australian pine |
Casuarina equisetifolia |
0.88 |
61.5 |
0.99 |
| northern catalpa |
Catalpa speciosa |
0.41 |
28.7 |
0.46 |
| common hackberry |
Celtis occidentalis |
0.53 |
37.0 |
0.59 |
| redbud |
Cercis canadensis |
0.58 |
40.5 |
0.65 |
| Port-Orford cedar |
Chamaecyparis lawsoniana |
0.43 |
30.1 |
0.48 |
| Alaska yellow cedar |
Chamaecyparis nootkatensis |
0.44 |
30.8 |
0.49 |
| Atlantic white cedar |
Chamaecyparis thyoides |
0.32 |
22.4 |
0.36 |
| golden chinkapin |
Chrysolepis chrysophylla |
0.46 |
32.1 |
0.52 |
| flowering dogwood |
Cornus florida |
0.73 |
51.0 |
0.82 |
| Pacific dogwood |
Cornus occidentalis |
0.62 |
43.3 |
0.69 |
| persimmon |
Diospyros virginiana |
0.74 |
51.7 |
0.83 |
| bluegum |
Eucalyptus globulus |
0.80 |
55.9 |
0.90 |
| American beech |
Fagus grandifolia |
0.64 |
44.7 |
0.72 |
| white ash |
Fraxinus americana |
0.60 |
41.9 |
0.67 |
| Oregon ash |
Fraxinus latifolia |
0.55 |
38.4 |
0.62 |
| black ash |
Fraxinus nigra |
0.49 |
34.2 |
0.55 |
| green ash |
Fraxinus pennsylvanica |
0.56 |
39.1 |
0.63 |
| pumpkin ash |
Fraxinus profunda |
0.52 |
36.3 |
0.58 |
| blue ash |
Fraxinus quadrangulata |
0.58 |
40.5 |
0.65 |
| honeylocust |
Gleditsia triacanthos |
0.65 |
45.4 |
0.73 |
| Kentucky coffeetree |
Gymnocladus dioicus |
0.60 |
41.9 |
0.67 |
| Silverbell |
Halesia spp. |
0.45 |
31.4 |
0.50 |
| American holly |
Ilex opaca |
0.57 |
39.8 |
0.64 |
| butternut |
Juglans cinerea |
0.38 |
26.6 |
0.43 |
| black walnut |
Juglans nigra |
0.55 |
38.4 |
0.62 |
| alligator juniper |
Juniperus deppeana |
0.51 |
35.6 |
0.57 |
| Utah juniper |
Juniperus osteosperma |
0.72 |
50.3 |
0.81 |
| eastern red cedar |
Juniperus virginiana |
0.47 |
32.8 |
0.53 |
| southern red cedar |
Juniperus virginiana |
0.44 |
30.8 |
0.49 |
| tamarack |
Larix laricina |
0.53 |
37.0 |
0.59 |
| western larch |
Larix occidentalis |
0.52 |
36.3 |
0.58 |
| sweetgum |
Liquidambar styraciflua |
0.52 |
36.3 |
0.58 |
| yellow poplar |
Liriodendron tulipifera |
0.42 |
29.4 |
0.47 |
| tanoak |
Lithocarpus densiflorus |
0.62 |
43.3 |
0.69 |
| osage-orange |
Maclura pomifera |
0.85 |
59.4 |
0.95 |
| cucumber tree |
Magnolia acuminata |
0.48 |
33.5 |
0.54 |
| mountain magnolia |
Magnolia fraseri |
0.44 |
30.8 |
0.49 |
| southern magnolia |
Magnolia grandiflora |
0.50 |
34.9 |
0.56 |
| sweetbay magnolia |
Magnolia virginiana |
0.46 |
32.1 |
0.52 |
| apple |
Malus spp. |
0.67 |
46.8 |
0.75 |
| paperbark tree |
Melaleuca quinquenervia |
0.72 |
50.3 |
0.81 |
| water tupelo |
Nyssa aquatica |
0.50 |
34.9 |
0.56 |
| blackgum |
Nyssa sylvatica |
0.50 |
34.9 |
0.56 |
| American hophornbeam |
Ostrya virginiana |
0.70 |
48.9 |
0.78 |
| sourwood |
Oxydendrum arboreum |
0.55 |
38.4 |
0.62 |
| Engelmann spruce |
Picea engelmannii |
0.35 |
24.5 |
0.39 |
| white spruce |
Picea glauca |
0.40 |
28.0 |
0.45 |
| black spruce |
Picea mariana |
0.46 |
32.1 |
0.52 |
| red spruce |
Picea rubens |
0.40 |
28.0 |
0.45 |
| Sitka spruce |
Picea sitchensis |
0.36 |
25.2 |
0.40 |
| knobcone pine |
Pinus attenuata |
0.42 |
29.4 |
0.47 |
| jack pine |
Pinus banksiana |
0.43 |
30.1 |
0.48 |
| sand pine |
Pinus clausa |
0.48 |
33.5 |
0.54 |
| lodgepole pine |
Pinus contorta |
0.41 |
28.7 |
0.46 |
| shortleaf pine |
Pinus echinata |
0.51 |
35.6 |
0.57 |
| pinyon pine |
Pinus edulis |
0.57 |
39.8 |
0.64 |
| slash pine |
Pinus elliottii |
0.59 |
41.2 |
0.66 |
| limber pine |
Pinus flexilis |
0.42 |
29.4 |
0.47 |
| spruce pine |
Pinus glabra |
0.44 |
30.8 |
0.49 |
| Jeffrey pine |
Pinus jeffreyi |
0.42 |
29.4 |
0.47 |
| sugar pine |
Pinus lambertiana |
0.36 |
25.2 |
0.40 |
| western white pine |
Pinus monticola |
0.38 |
26.6 |
0.43 |
| Bishop pine |
Pinus muricata |
0.49 |
34.2 |
0.55 |
| longleaf pine |
Pinus palustris |
0.59 |
41.2 |
0.66 |
| ponderosa pine |
Pinus ponderosa |
0.40 |
28.0 |
0.45 |
| Table mountain pine |
Pinus pungens |
0.52 |
36.3 |
0.58 |
| Monterey pine |
Pinus radiata |
0.53 |
37.0 |
0.59 |
| red pine |
Pinus resinosa |
0.46 |
32.1 |
0.52 |
| pitch pine |
Pinus rigida |
0.52 |
36.3 |
0.58 |
| gray pine |
Pinus sabiniana |
0.43 |
30.1 |
0.48 |
| pond pine |
Pinus serotina |
0.56 |
39.1 |
0.63 |
| eastern white pine |
Pinus strobus |
0.35 |
24.5 |
0.39 |
| loblolly pine |
Pinus taeda |
0.51 |
35.6 |
0.57 |
| Virginia pine |
Pinus virginiana |
0.48 |
33.5 |
0.54 |
| American sycamore |
Platanus occidentalis |
0.49 |
34.2 |
0.55 |
| balsam poplar |
Populus balsamifera |
0.34 |
23.8 |
0.38 |
| eastern cottonwood |
Populus deltoides |
0.40 |
28.0 |
0.45 |
| Fremont cottonwood |
Populus fremontii |
0.45 |
31.4 |
0.50 |
| bigtooth aspen |
Populus grandidentata |
0.39 |
27.3 |
0.44 |
| quaking aspen |
Populus tremuloides |
0.38 |
26.6 |
0.43 |
| black cottonwood |
Populus trichocarpa |
0.35 |
24.5 |
0.39 |
| honey mesquite |
Prosopis glandulosa |
0.82 |
57.3 |
0.92 |
| black cherry |
Prunus serotina |
0.50 |
34.9 |
0.56 |
| Douglas-fir |
Pseudotsuga menziesii |
0.48 |
33.5 |
0.54 |
| white oak |
Quercus alba |
0.68 |
47.5 |
0.76 |
| swamp white oak |
Quercus bicolor |
0.72 |
50.3 |
0.81 |
| canyon live oak |
Quercus chrysolepis |
0.74 |
51.7 |
0.83 |
| scarlet oak |
Quercus coccinea |
0.67 |
46.8 |
0.75 |
| scarlet oak |
Quercus coccinea |
0.67 |
46.8 |
0.75 |
| southern red oak |
Quercus falcata |
0.59 |
41.2 |
0.66 |
| gambel oak |
Quercus gambelii |
0.63 |
44.0 |
0.71 |
| Oregon white oak |
Quercus garryana |
0.72 |
50.3 |
0.81 |
| California black oak |
Quercus kelloggii |
0.55 |
38.4 |
0.62 |
| laurel oak |
Quercus laurifolia |
0.63 |
44.0 |
0.71 |
| California white oak |
Quercus lobata |
0.58 |
40.5 |
0.65 |
| overcup oak |
Quercus lyrata |
0.63 |
44.0 |
0.71 |
| bur oak |
Quercus macrocarpa |
0.64 |
44.7 |
0.72 |
| swamp chestnut oak |
Quercus michauxii |
0.67 |
46.8 |
0.75 |
| water oak |
Quercus nigra |
0.63 |
44.0 |
0.71 |
| cherrybark oak |
Quercus pagoda |
0.69 |
48.2 |
0.77 |
| pin oak |
Quercus palustris |
0.63 |
44.0 |
0.71 |
| willow oak |
Quercus phellos |
0.69 |
48.2 |
0.77 |
| chestnut oak |
Quercus prinus |
0.66 |
46.1 |
0.74 |
| northern red oak |
Quercus rubra |
0.63 |
44.0 |
0.71 |
| post oak |
Quercus stellata |
0.67 |
46.8 |
0.75 |
| black oak |
Quercus velutina |
0.61 |
42.6 |
0.68 |
| live oak |
Quercus virginiana |
0.88 |
61.5 |
0.99 |
| red mangrove |
Rhizophora mangle |
0.96 |
67.1 |
1.08 |
| black locust |
Robinia pseudoacacia |
0.69 |
48.2 |
0.77 |
| black willow |
Salix nigra |
0.39 |
27.3 |
0.44 |
| sassafras |
Sassafras albidum |
0.46 |
32.1 |
0.52 |
| coast redwood |
Sequoia sempervirens |
0.38 |
26.6 |
0.43 |
| giant sequoia |
Sequoiadendron giganteum |
0.38 |
26.6 |
0.43 |
| mahogany |
Swietenia mahagoni |
0.60 |
41.9 |
0.67 |
| baldcypress |
Taxodium distichum |
0.46 |
32.1 |
0.52 |
| Pacific yew |
Taxus brevifolia |
0.67 |
46.8 |
0.75 |
| northern white cedar |
Thuja occidentalis |
0.31 |
21.7 |
0.35 |
| western redcedar |
Thuja plicata |
0.32 |
22.4 |
0.36 |
| American basswood |
Tilia americana |
0.37 |
25.9 |
0.41 |
| eastern hemlock |
Tsuga canadensis |
0.40 |
28.0 |
0.45 |
| western hemlock |
Tsuga heterophylla |
0.45 |
31.4 |
0.50 |
| mountain hemlock |
Tsuga mertensiana |
0.45 |
31.4 |
0.50 |
| winged elm |
Ulmus alata |
0.66 |
46.1 |
0.74 |
| American elm |
Ulmus americana |
0.50 |
34.9 |
0.56 |
| cedar elm |
Ulmus crassifolia |
0.64 |
44.7 |
0.72 |
| slippery elm |
Ulmus fulva |
0.53 |
37.0 |
0.59 |
| rock elm |
Ulmus thomasii |
0.63 |
44.0 |
0.71 |
| California laurel |
Umbellularia californica |
0.55 |
38.4 |
0.62 |
| †12% moisture content volume basis |
|
 and Wright et al. (2010; PNW-GTR-805) form the scientific basis for this calculator.")


