Oceanography Lab Unveils Data Visualization System

New Technology Will Allow For Comparison Of Large-scale Images And Analysis Of Complex Data
By Emily Marshall
The first one. No, wait, the second one is brighter. Can we see the fourth one again? Comparing images on a computer monitor can be a difficult task. To see them side-by-side, the images must often be reduced until the details are lost, and to make the images large enough to appreciate the details, researchers can generally only look at one image at a time, scrolling through individually while trying to recall the nuances of each.
Seeing images side-by-side without losing resolution would certainly make comparisons easier, and new technology at the University of Washington (UW) is allowing researchers to do just that.
The innovative tile display, built in UW oceanography professor E. Virginia Armbrust's lab, consists of 15 30-inch flat-panel computer monitors. They are tiled in a 5x3 array and controlled by a cluster of nine networked computers. Its total size is 7.5 by 12.5 feet, including the monitor stands, and it will enable researchers to visualize data in new and compelling ways.
The tiled screens provide much higher resolution than previous technologies, allowing the details in large-scale images and complex data sets to be uncovered.
The tile display was physically constructed by Armbrust lab system administrator Chris Berthiaume in collaboration with the CalIT2 group at the University of California-San Diego, and cost almost $90,000 to build. The computers running the monitor array are housed in a separate room to minimize heat and noise, although one can feel the heat emanating from the monitors from several inches away. The total resolution of the array is an astounding 61.4 megapixels, about 30 times that of a typical desktop monitor. Images can be displayed on one of the monitors or spread across several, and many images or other files can be displayed and manipulated simultaneously on different portions of the monitor array.
 |  |
One of the difficulties in analyzing images, such as those of the microscopic algae studied in the Armbrust lab, is that to compare multiple large-scale images one has to scroll between them instead of being able to compare them side-by-side. The size and resolution of the tiled monitors allow for multiple images to be placed on the monitors at the same time for comparison, and because each image can be blown up to many times what would be possible on a single monitor, even the tiniest details become apparent.
Another benefit of the tile display is, as Armbrust says, "to be able to visualize complex data sets. What often happens once you get a really good way of seeing the relationship of your data to itself and to the rest of the data is that you're limited by the size of your screen, the resolution of your screen. To see the detail you lose the context. With this we can keep both the context and the detail.” The power of the technology is particularly apparent when looking at the genome map of the diatom Thalassiosira pseudonana, one of the organisms studied by the Armbrust lab. The map fills all 15 monitors and is color-coded to show genes with properties of interest. From the back of the room, researchers can easily see patterns emerging in the data, and walking up to the screens they can read the name of each individual gene. This ability to distinguish details in a large context is what excites Armbrust. Generally, she says, in order to see this level of detail you would have to blow your image up to such a large degree that all of the context, and your ability to know where you are in the genome, would be lost.
The popularity of this type of tiled monitor display is growing in the research lab setting, with similar structures currently in the works at MIT and the University of Hawaii. The computer/monitor clusters are known as OptIPortals, and will be connected to each other via a fiberoptic network known as the National LambdaRail, allowing for extremely high-speed data transmission between research groups. Armbrust believes this will be highly beneficial for collaboration. Using high-definition cameras in combination with LambdaRail allows collaborators to see each other in real-time and high-definition, eliminating the choppy and delayed video that often accompanies video conferencing. There is great potential for data sharing with this technology, says Armbrust. "We could actually have an image coming from MIT, another screen over here where we're seeing the people at MIT, and us pointing to that and saying ‘How about doing it this way?'” The technology also allows for remote desktop sharing, with multiple people projecting their individual computer desktops onto the monitors simultaneously to compare data or share notes.
The visualization wall will eventually be a shared resource for users across the university campus, Armbrust says, and she is excited about working to improve its capabilities to suit the research being done by various groups. For the moment she has not considered what type, if any, of fees will be charged for usage, and is working with new users on a collorative basis. Russell McDuff, director of the UW School of Oceanography, anticipates that the wall will be widely used for ecogenomic and environmental research as well as teaching across several UW departments.
As with any new technology, kinks still need to be worked out with the Armbrust lab OptIPortal. One of the pressing difficulties is obtaining data that can take advantage of the large-scale high-resolution capabilities of the tiled monitors. Not every image contains enough information to be magnified to the scale of the monitor array without becoming blocky, or pixilated. The problem is similar to what happens when printing a low-resolution digital photo in a large format such as a poster. Unless the photo is very high-resolution, it becomes fuzzy when enlarged. This is because when one expands a low-resolution image there are not enough pixels to fill the larger space. The computer multiplies or enlarges the pixels, making them appear blocky. Formats such as PDFs expand readily because coordinates instead of just pixels code their information, but not all images are so easily scaled. In order to take advantage of the screen, "You have to have things that have the appropriate resolution, otherwise it's just a big version of something,” remarks Armbrust.
She goes on to mention that a whole new technology and way of thinking is needed to back up this visualization method. Most current research focuses on making ever smaller images like those seen on iPhones and similar portable devices. Not as much work is going into large-scale imaging, but Armbrust feels that this type of imaging will be very beneficial to scientists. McDuff also thinks that the capability for advanced visualization that the tile array provides ties in nicely with the UW's recently launched eScience Institute. The new institute, formed in January 2008, will bring scientists together with technology and computer experts to analyze the increasingly complex information being generated by large-scale and data-intensive experiments. The Armbrust tile display, with its size and capacity for high-resolution images, will be a vital link for visualizing the type of complex data that the researchers in the eScience Institute hope to gather and analyze.
This type of complex data analysis requires serious computing power. The tile display is controlled by a cluster of nine computers housed in a specially designed room next to the visualization room. Empty racks await stacks of computer servers. For now there is only one server, but soon dozens will be storing data for the tile display. The room feels refrigerated, with giant fans pulling the hot air produced by the computers out of the room, where it is filtered and then used to heat other parts of the building. Armbrust is proud that her newly-designed lab, even with all of its energy-hungry technology, has earned a LEED Silver ranking, which is an indication of environmentally conscious design and operation.
The visualization room itself was designed in collaboration with UW-TV. Specially intended to make viewers want to linger and absorb the data, it boasts comfortable chairs and tables, inviting researchers to relax and be inspired by new research directions revealed by the high-resolution images on the screen.
Emily Marshall is a graduate student in microbiology at the University of Washington.
Images:
Top: Armbrust shows off her lab's new advanced visualization wall. The monitors show the genome map of Thalassiosira pseudonana, one of the organisms studied by her lab. Photo: Virginia Armbrust
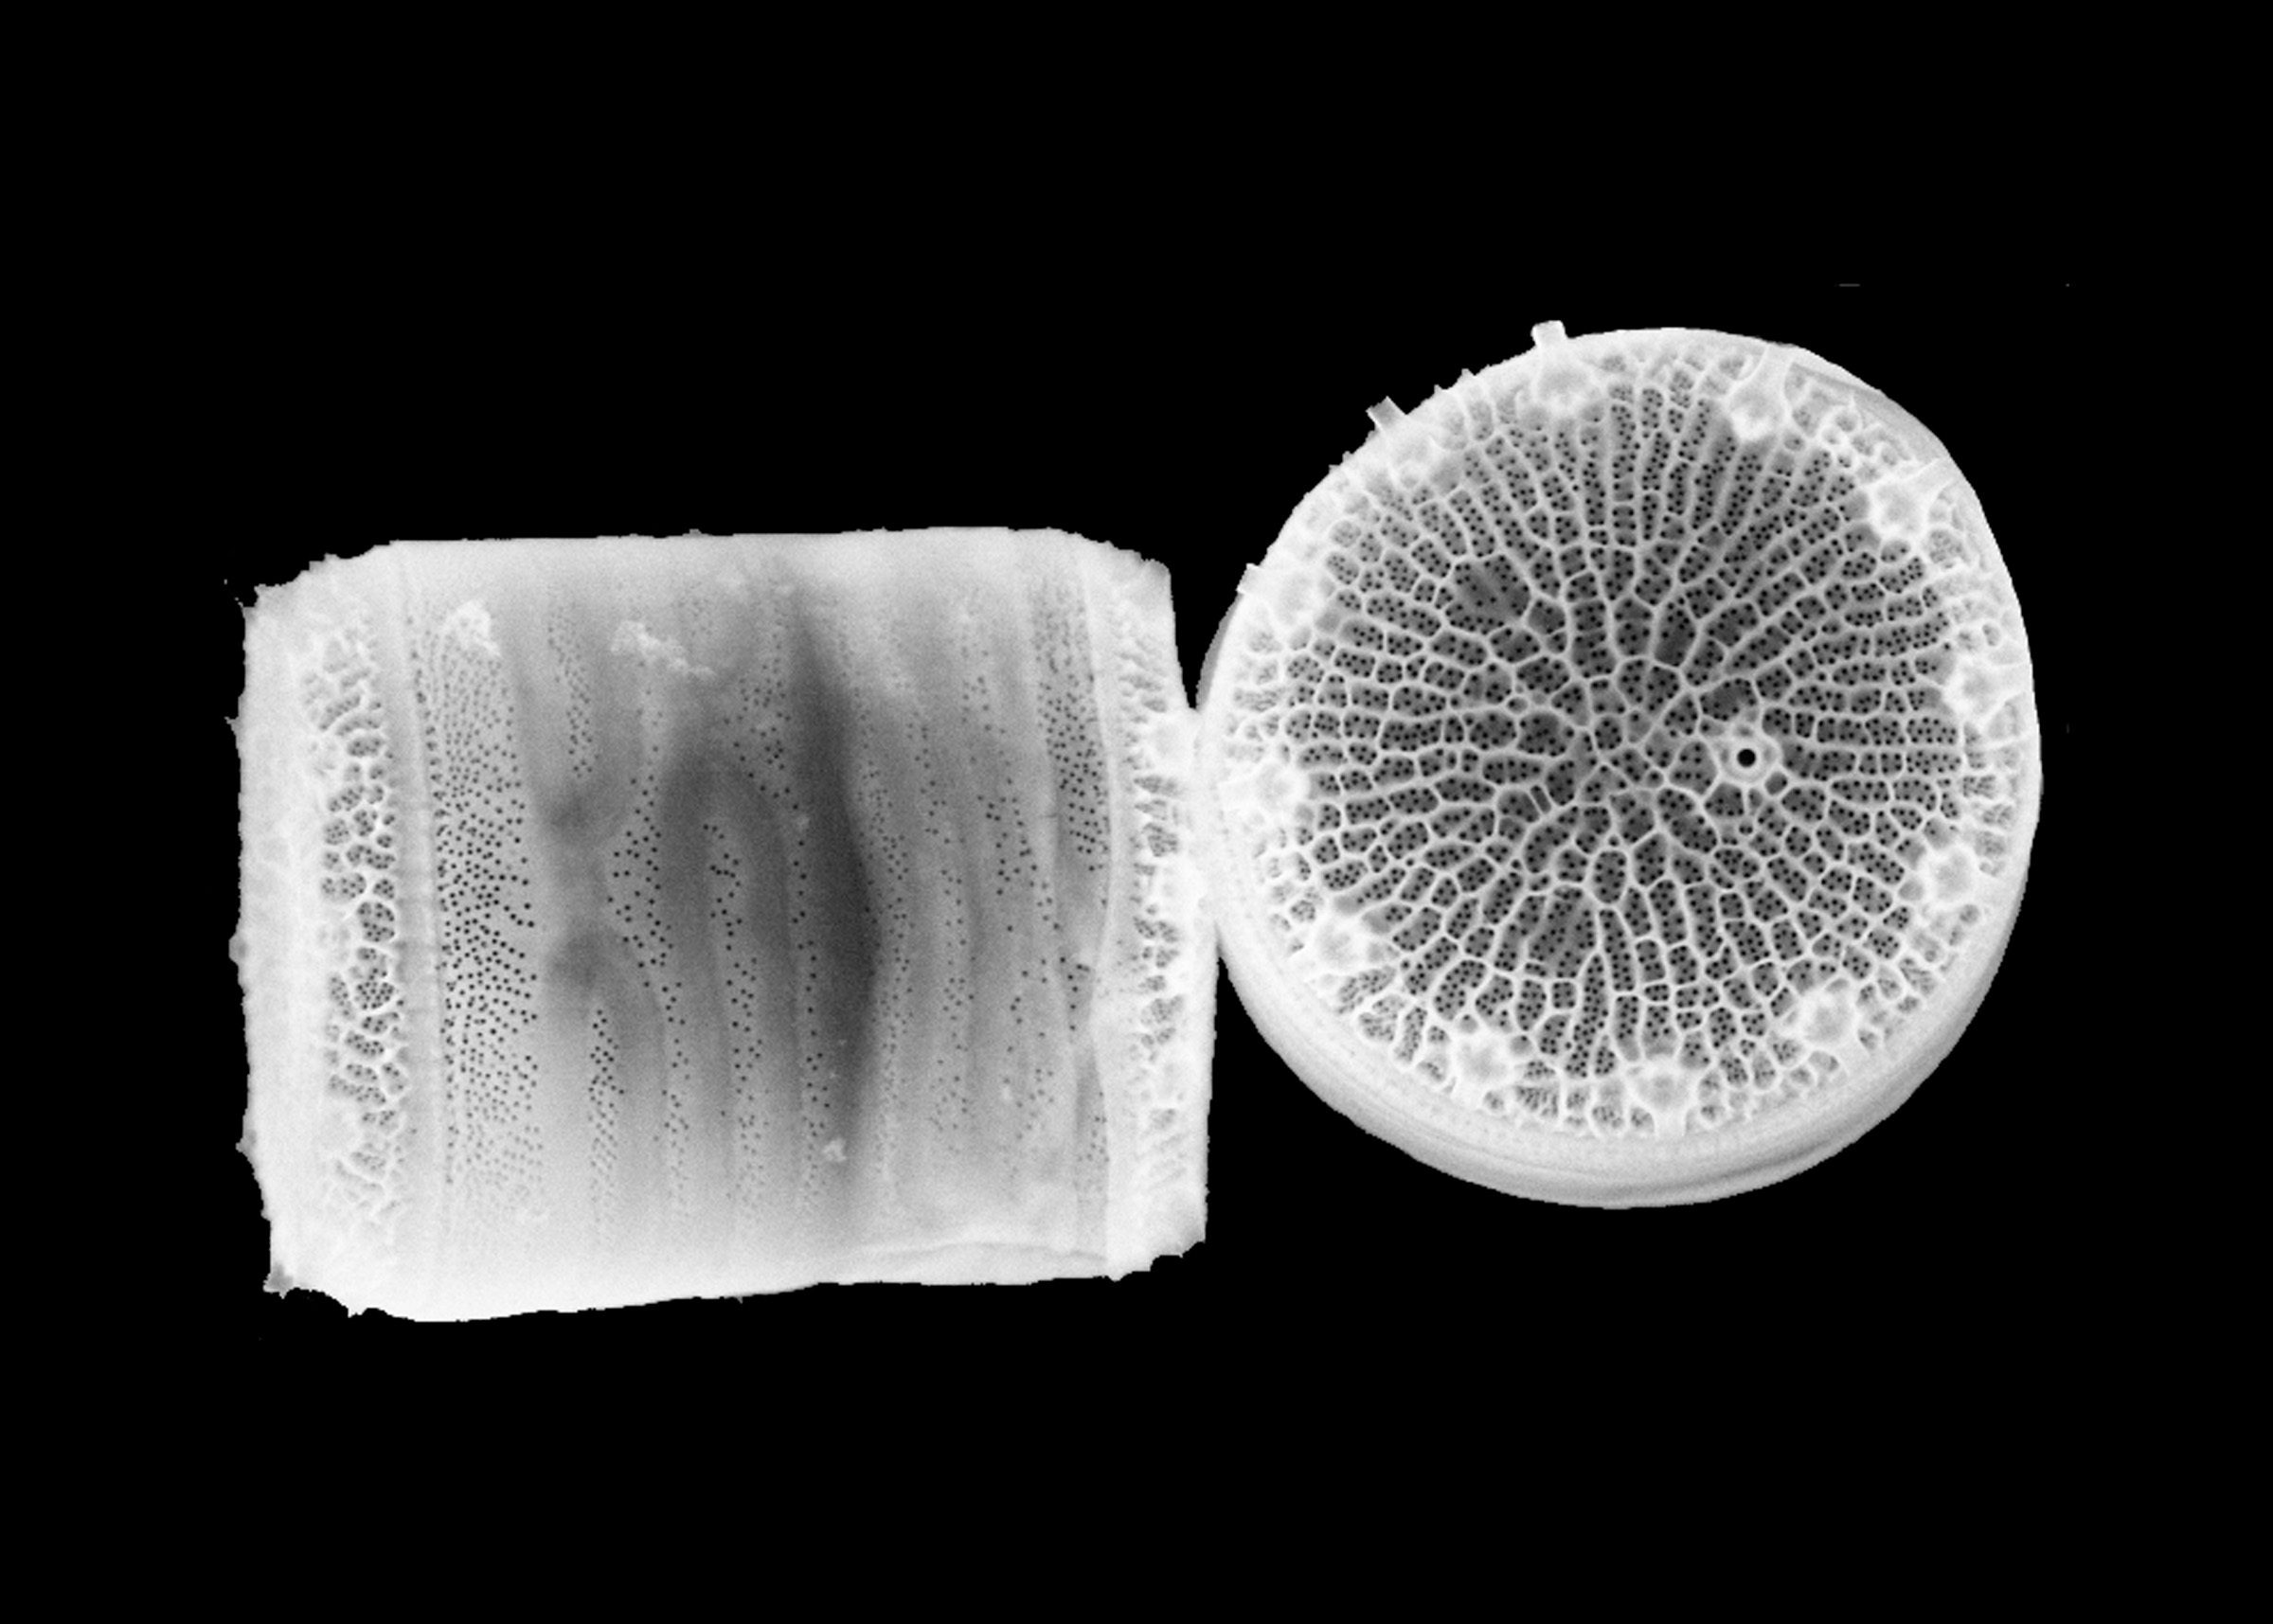
Bottom: Thalassiosira pseudonana. High-resolution imaging will allow for more detailed appreciation and comparison of the ornate silica cell wall structure of these and other diatoms.
Photo: University of Washington

|