
-
April 30, 2025
Mapping Our Way to Accessible Cities via AI-Powered Crowdsourcing: A Look Inside Project Sidewalk
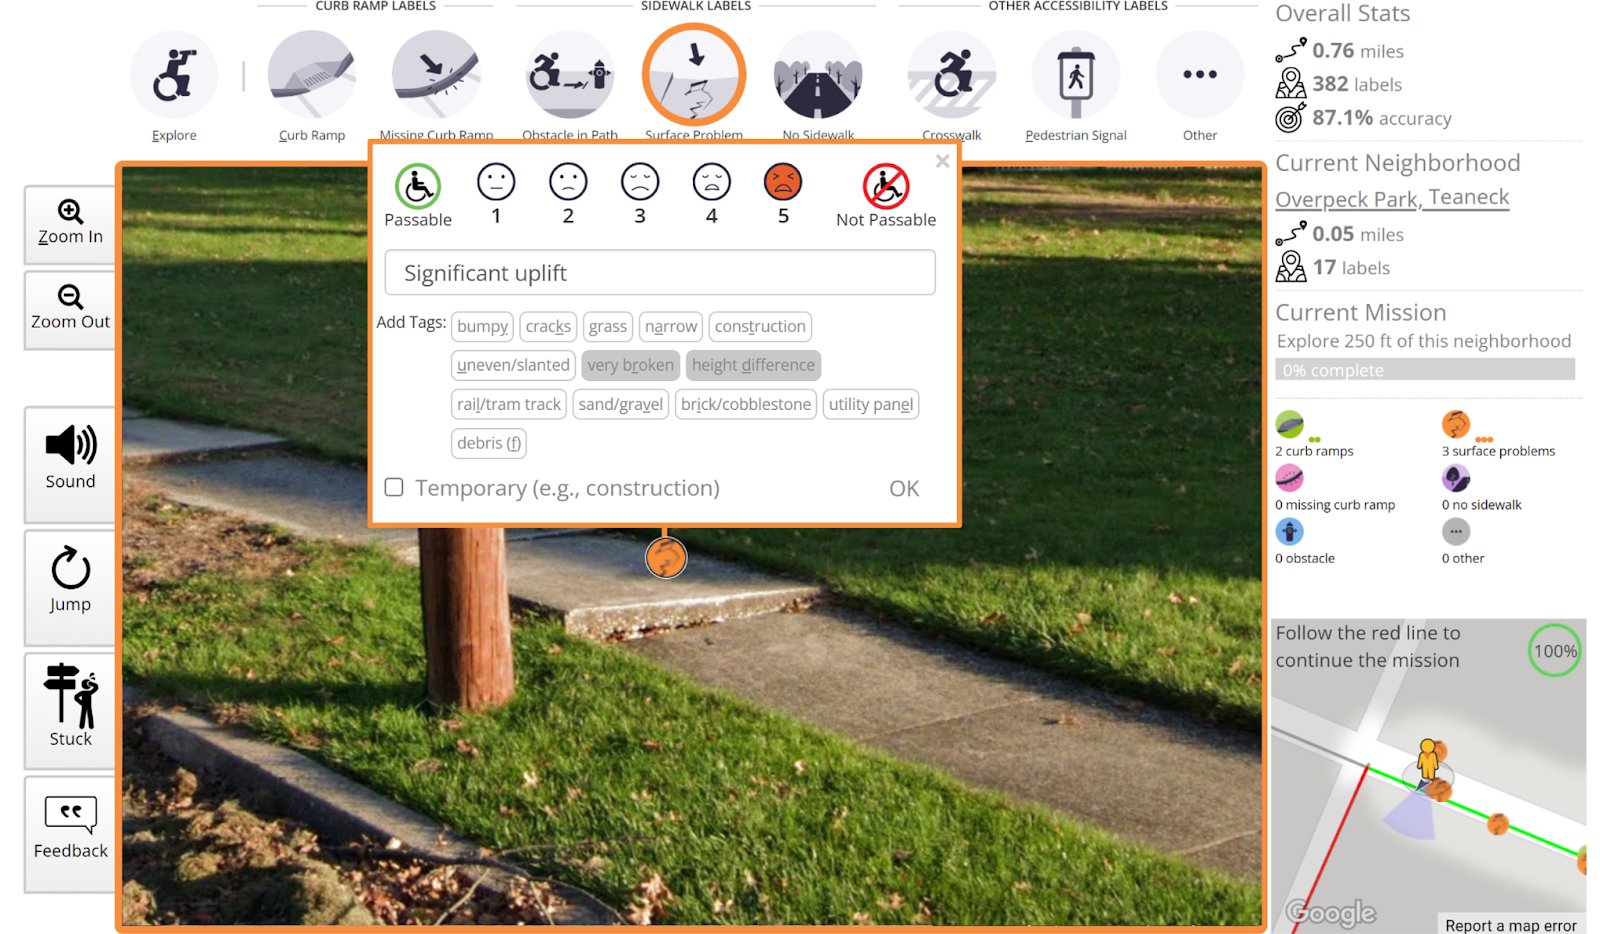
Figure 1. Project Sidewalk’s mission is to map and assess every sidewalk in the world via crowdsourcing, artificial intelligence (AI), and online map imagery. Above, a Project Sidewalk user labels a “sidewalk uplift” as a surface problem, which poses a significant safety and accessibility hazard.
“Using Project Sidewalk gave me a new perspective that I can use to help change the world.” – Girl Scout, Age 11
“It is amazing to think that in just a few hours, users can label so many problematic sidewalks and validate others’ work” – Wheelchair user
Sidewalks are more than just concrete paths; they are vital arteries of our communities—connecting us to work, school, shops, transit, and parks. They are spaces for strolling, playing, dining, and commerce. For many, especially individuals with mobility challenges, accessible sidewalks aren’t just a convenience – they are lifelines, enabling independence, physical activity, and access to key services. Despite decades of civil rights legislation, however, many city streets and sidewalks remain inaccessible. As the United Nations notes, “[there is a] widespread lack of accessibility in built environments, from roads and housing to public buildings and spaces.”
The Hidden Problem: Missing Data
The challenge isn’t just fixing broken sidewalks; it’s also that we often don’t even know where the problems are. Reliable data on sidewalk existence, condition, and accessibility features are surprisingly scarce. For example, in a sample of 178 US cities, Deitz et al. found that only 36 (20%) published sidewalk data, 18 (10%) had curb ramp locations, and even fewer included detailed accessibility information like sidewalk condition, obstructions, and crossing controls.
This lack of data fundamentally limits how sidewalks can be studied in cities, the ability for communities, disability advocacy groups, and local governments to understand, transparently discuss, and make informed urban planning decisions, and how sidewalks and accessibility are incorporated into interactive map, navigation, and GIS tools. Imagine, for example, loading up Google Maps and being provided personalized pedestrian-based routing directions that avoids obstacles and meets your mobility needs.
Enter Project Sidewalk: A Virtual Solution with Real-World Impact
This is where Project Sidewalk comes in! Developed by Professor Jon E. Froehlich and his lab at the University of Washington, with support from PacTrans, UW CREATE, and the National Science Foundation, this innovative tool is revolutionizing how we map and understand sidewalk accessibility.
How? By harnessing the power of crowdsourcing, artificial intelligence (AI), and online map imagery. Project Sidewalk allows anyone to become a virtual sidewalk explorer. You virtually explore cities via immersive imagery similar to a first-person video game, labeling sidewalks and identifying accessibility features or problems like missing curb ramps, uneven surfaces, or obstructions. Other missions allow users to validate pre-existing labels to ensure high data quality. See Figures 1 and 2.
For each identified sidewalk feature or obstacle, users assign a severity score, add descriptive tags, and can even leave detailed notes. This data is then used for:
- Creating powerful new interactive visual analytics of urban accessibility.
- Providing concrete data to inform government policy and funding decisions.
Training AI models to automatically detect accessibility issues, helping to scale the auditing process even further.
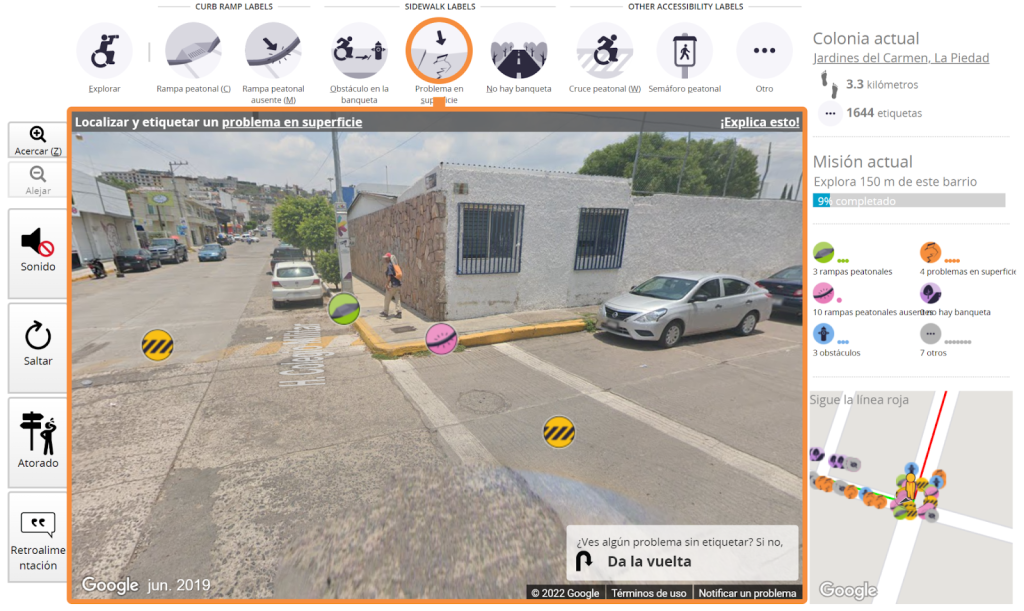
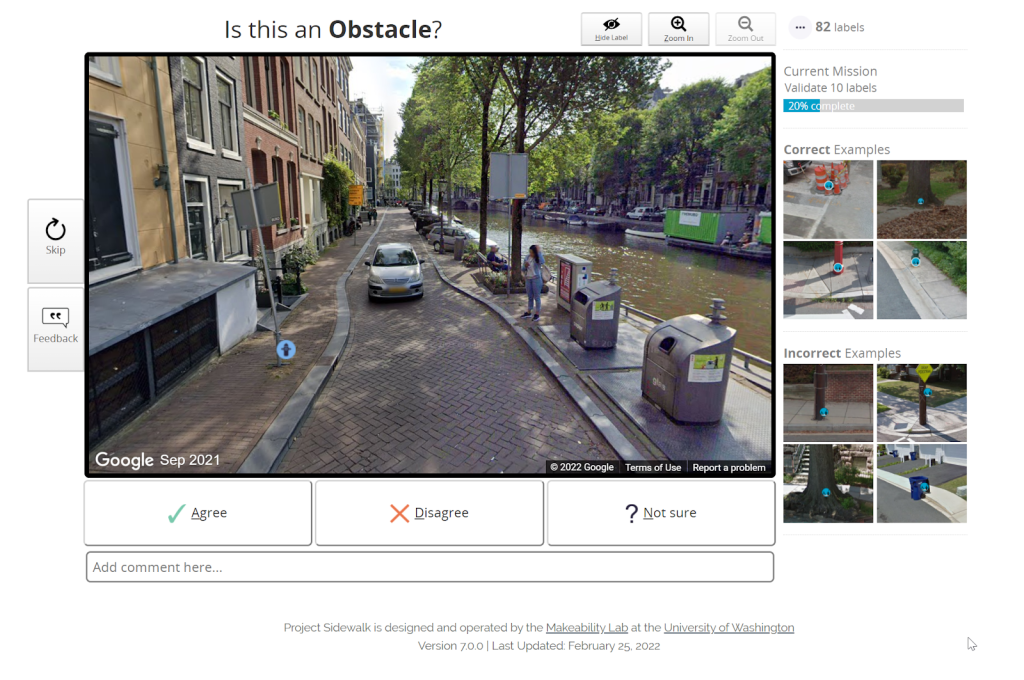
Figure 2. (top) A screenshot of a user virtually auditing sidewalks in Mexico showing labels for a curb ramp (green), missing curb ramp (red) and crosswalks (yellow). (bottom) A user validating an obstacle-in-path label in Amsterdam.
Making a Difference, Street by Street, City by City
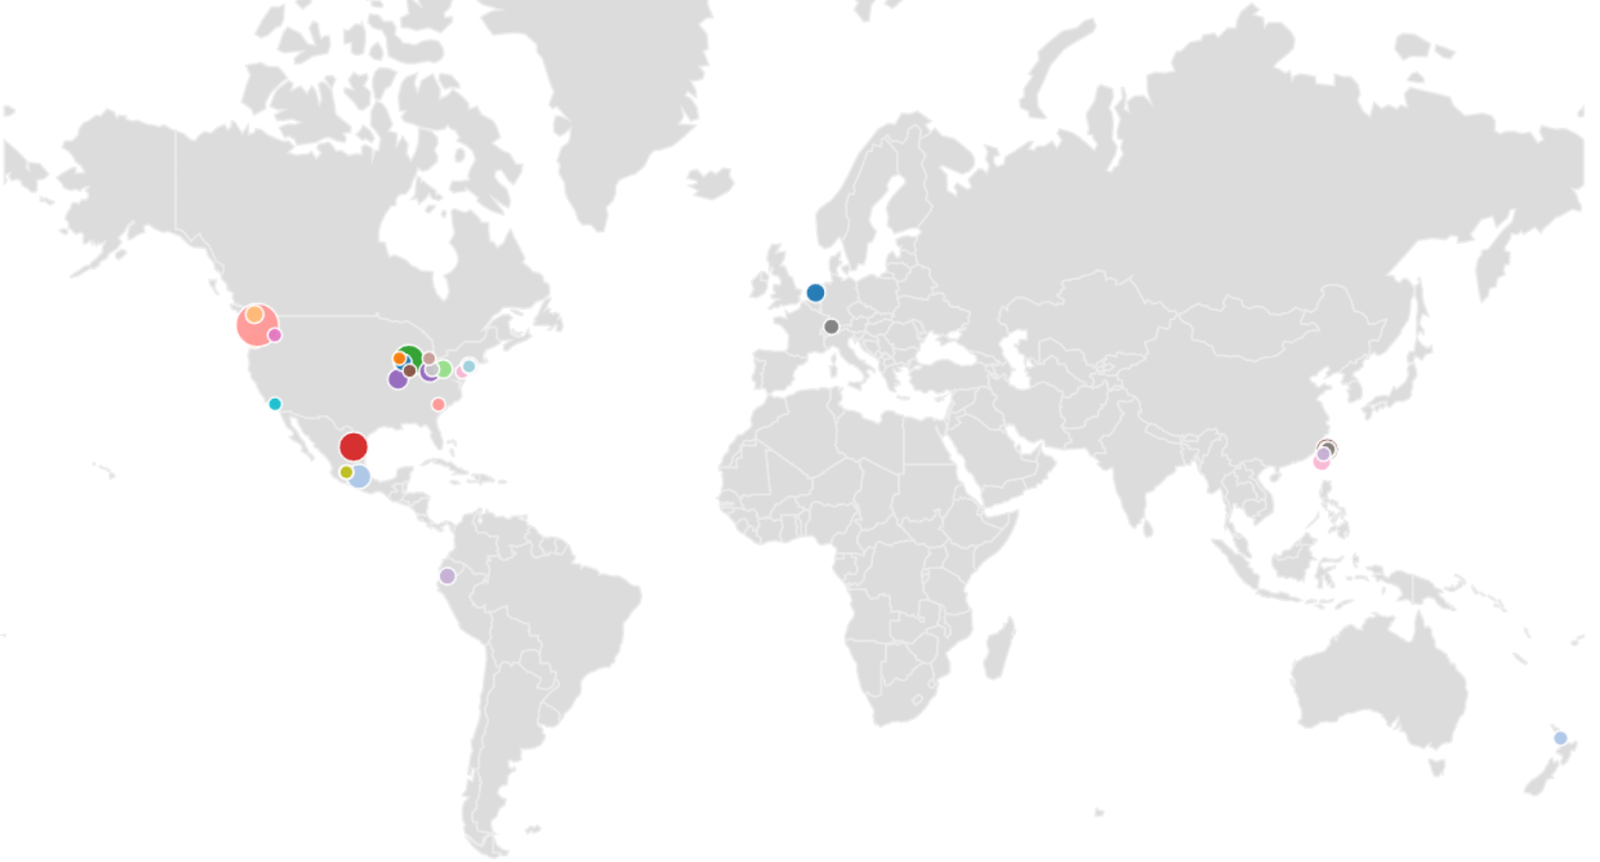
Figure 3. The PacTrans-supported Project Sidewalk is now deployed in 35 cities across 8 countries including the US, Canada, Mexico, Ecuador, Netherlands, Switzerland, and New Zealand. Project Sidewalk users have analyzed over 21,380 km of city streets contributing over 1.1 million labels and 935k validations.
Working with NGOs, disability advocates, community groups, and local governments, Project Sidewalk is now deployed in 35 cities across 8 countries including the US, Canada, Mexico, Ecuador, The Netherlands, Switzerland, and New Zealand (Figure 3). Incredibly, Project Sidewalk volunteers have contributed over 1.1 million sidewalk accessibility labels, covering more than 21,350 km of city streets (over 13,200 miles). To our knowledge, this is the largest open sidewalk accessibility dataset ever collected.
And it’s leading to tangible change:
- In Newberg, Oregon: Community members used Project Sidewalk to meticulously map local sidewalks, collecting over 17,000 labels. This data fueled successful advocacy efforts, resulting in two new sidewalk repair programs.
- In Chicago, Illinois: The city used Project Sidewalk data to guide infrastructure spending equitably, ensuring sidewalk improvements targeted high-priority areas across different wards.
- In Oradell, New Jersey: Project Sidewalk became an educational tool. Local Girl Scouts mapped their entire town, learning about urban design, and disability advocacy. They then presented their findings directly to the Oradell City Council – empowering youth to shape their community! This project, in collaboration with the Bergen County Community Council of the National MS Society and the Hackensack Meridian School of Medicine, showcases the tool’s power to unite diverse groups. See Figures 4 and 5.
Furthering its educational reach, Project Sidewalk is also a featured project in SciStarter, a leading community science platform connecting volunteers to scientific research.
A Global Tool for a Universal Challenge
Because Project Sidewalk leverages existing Google Street View imagery, it doesn’t require expensive or time-consuming physical audits. This makes it easy to deploy almost anywhere in the world–100+ countries currently have Street View coverage with over 220 billion street view images.
- In San Pedro, Mexico, the local government said: “Project Sidewalk provides us with data that is essential to improving San Pedro’s urban accessibility. With Project Sidewalk, we know the main problems to be solved, how many problems there are, and their location… The results will be used to inform a new Pedestrian Master Plan for our municipality.”
- In Zurich, Switzerland Project Sidewalk was used to support a community and government partnership called ZuriACT (Zurich Accessible CiTy) to transform the city’s pedestrian accessibility, leading to a new open data portal on sidewalk assessments.
- In Burnaby, Canada, Project Sidewalk was used to support community-engaged sidewalk auditing of over 220 miles in collaboration with Simon Fraser University and the local Burnaby government

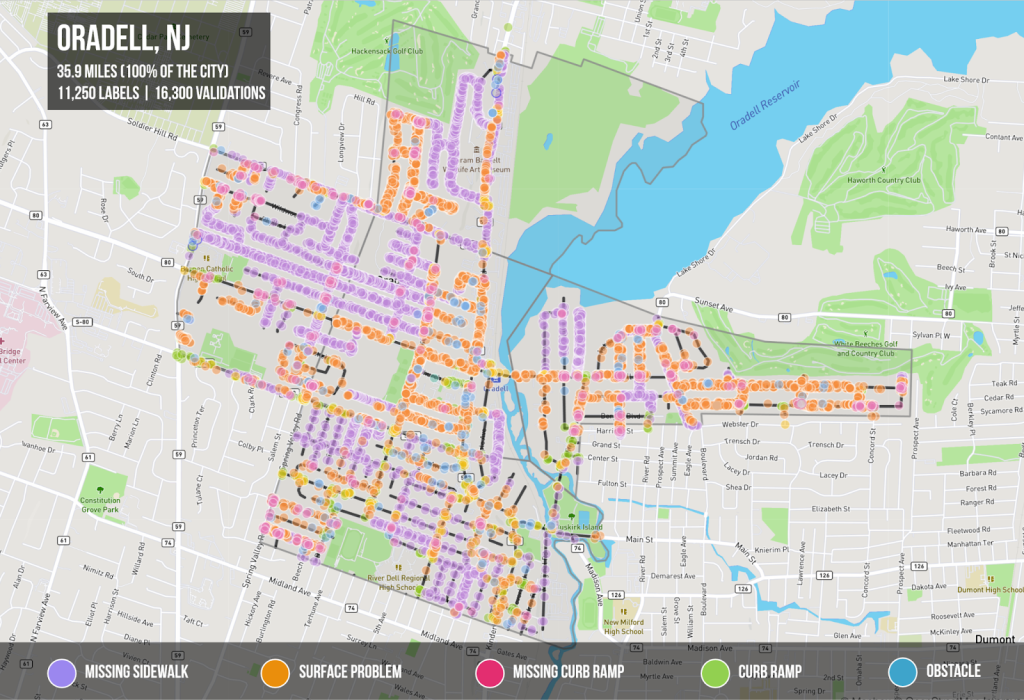
Figure 4. In Oradell, NJ, we are working with the Girl Scouts and local organizations to map and assess sidewalk accessibility as a service-learning project. The girls and other community members completed 35.9 miles of virtual assessments and collected 11k labels and 26k validations. The figure above shows color-coded circles of found problems—most commonly, surface problems (orange) and missing sidewalks (purple).
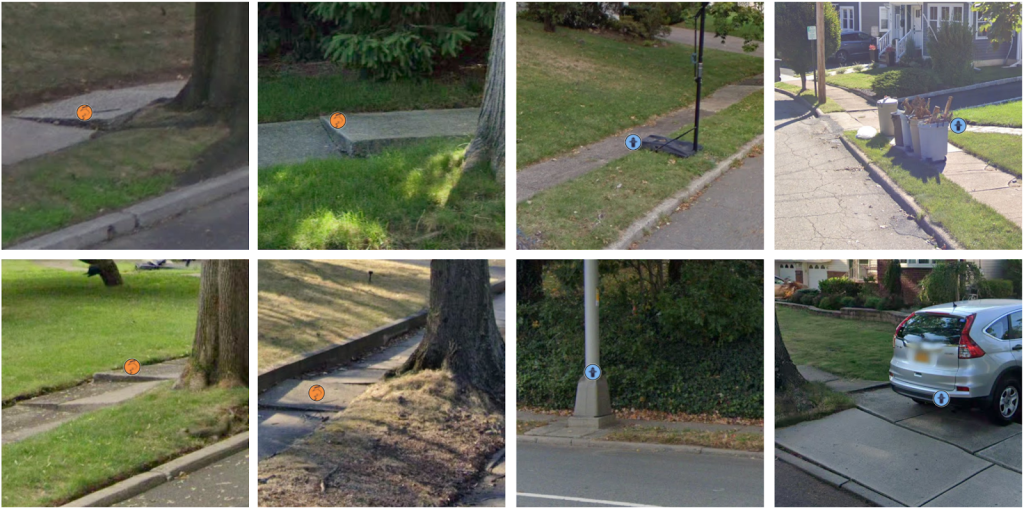
Figure 5. Example sidewalk problems found in Oradell, NJ—surface problems are orange labels and obstacles are blue.
Get Involved: Help Build More Accessible Communities
Sidewalk accessibility affects everyone. Whether you push a stroller, use a wheelchair or walker, rely on transit, or simply enjoy walking, safe and accessible sidewalks make our communities better.
You can be part of the solution! Visit https://projectsidewalk.org to learn more, explore the maps, and try your hand at virtual auditing. Just a few minutes of your time can contribute valuable data that empowers change. If you are a data or machine learning scientist, we just released a public dataset of annotated sidewalk features/problems on Hugging Face (Figure 6) to help others build AI models of automatic sidewalk assessment.
Together, we can transform our cities into places that are more walkable, rollable, and livable for all!
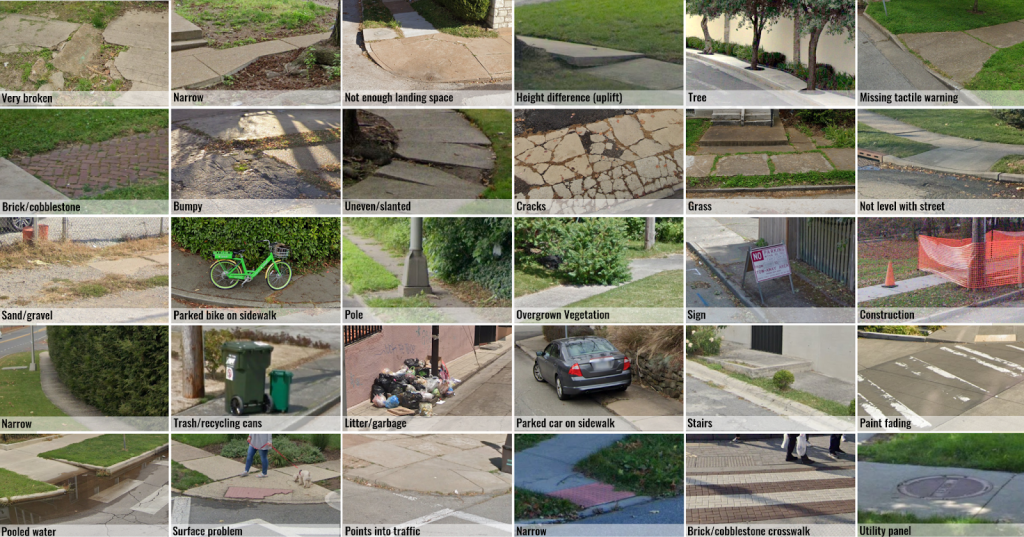
Figure 6. To help others build on their work, Project Sidewalk just released a public dataset of labeled sidewalk images and trained AI models on Hugging Face: https://huggingface.co/projectsidewalk. Some examples from the dataset are shown above.
In 2010, a reported 77.9% of people used safety belts in Idaho.
Source: U.S. Dept. of Transportation, Research and Innovative Technology Administration, Bureau of Transportation Statistics