
PacTrans News
-
August 26, 2025
Registration Now Open for the PacTrans Region 10 Transportation Conference

We are proud to continue the tradition of providing a premier forum for transportation research in the Pacific Northwest. This year’s theme is Connecting Communities: Improving Mobility Under Uncertainty.
-
August 25, 2025
Another Summer, Another Successful WA Transportation Camp!

In August, the 2025 PacTrans-WSDOT Washington Transportation Camp wrapped up its third successful year, taking place at:
- Washington State University in Pullman, WA
Pullman, WA – June 27-26, 2025 - University of Washington in Seattle, WA
Seattle, WA – August 3-8, 2025
WA Transportation Camp is a one-week residential high school summer program covering transportation topics such as urban planning, traffic safety, supply chain logistics, and the realm of connected and autonomous vehicles. Students worked on real-world challenges, connected with UW and WSU faculty, and industry professionals, and experienced firsthand how transportation shapes our communities and daily lives.
- Washington State University in Pullman, WA
-
August 6, 2025
USDOT SMART Team Honored as First-Ever Safe Systems Champion at 2025 Washington Traffic Safety Summit
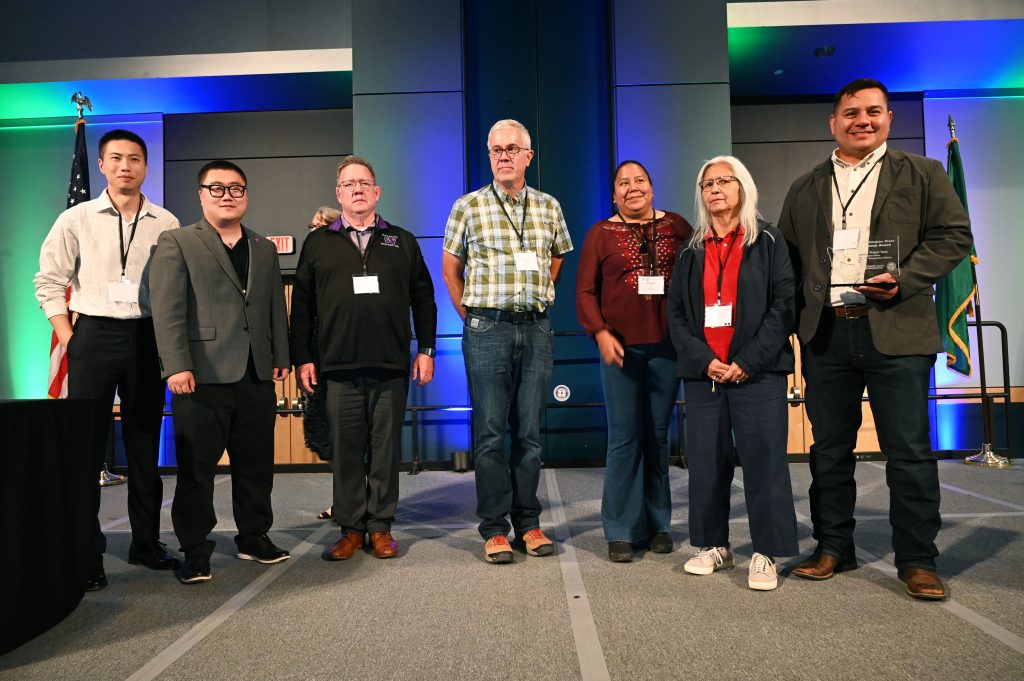
USDOT SMART Team, led by the Yakama Nation DNR Engineering Program, in partnership with AIWaysion, UW STARLab, and WSDOT, has been honored as the first-ever recipient of the Safe Systems Champion Award at the 2025 Washington Traffic Safety Summit, held July 15 – 17, 2025 at the Spokane Convention Center, Washington.
-
July 8, 2025
PacTrans Offers Internship Opportunities in Infrastructure with Support from WSDOT

With support from the Washington State Department of Transportation (WSDOT), PacTrans offered spring internship opportunities to high school and undergraduate students interested in infrastructure-related fields such as transportation, engineering, planning, computer science, and more.
At the end of the three-month long experience, students gathered at the WSDOT Northwest Region Office in Shoreline, WA to present their work with fellow cohort members, mentors, friends and family. Interns were placed in a variety of departments, including Hydraulics, Fish Passage, Traffic Management, Complete Streets, Freight, Geotechnical Engineering, and others.

Throughout the program, students gained hands-on experience and developed both technical and professional skills. Many learned technical skills, such as coding or field work (i.e. monitoring intersections, ropes training). Many also built interpersonal skills like networking and community engagement. During the final presentations, students proudly shared their accomplishments, which included coauthoring a USDOT ADCMS Report and improving local bus routes.
We are proud to have helped students explore the wide range of career paths available in infrastructure. By the end of the internship, students had not only gained valuable workforce experience and built their resumes, but also formed meaningful connections with mentors and peers. We look forward to their bright careers in the future!
-
June 30, 2025
Exploring Spokane’s Streets: Active Transportation & Complete Streets Field Course Highlights
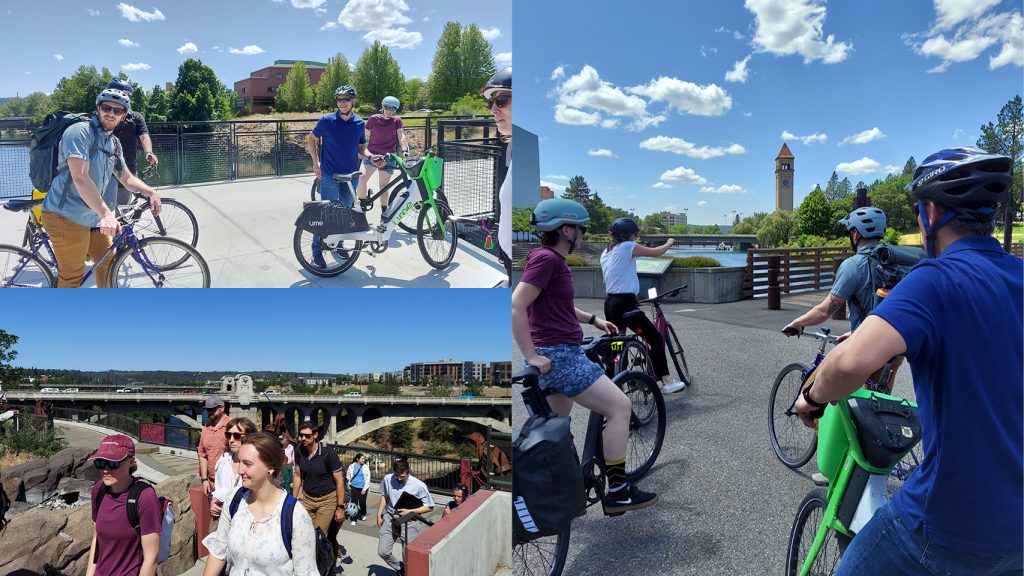
On June 18, 2025, fourteen participants gathered in downtown Spokane, Washington for the Field Course in Active Transportation Safety and Complete Streets Design instructed by transportation engineers, Chris Breiland and Marissa Milam, at Fehr & Peers. After a brief overview of key active transportation design concepts, the group hit the streets for a sunny walking tour of the city’s pedestrian, bike, and public transportation infrastructure projects that had been installed.
Attendees included representatives from the City of Spokane, Parametrix, Spokane Transit, Spokane Regional Transportation Council, WSDOT, as well as a Spokane AT advocate and columnist. The tour sparked lively, insightful discussions as participants shared knowledge from their various perspectives.
Following lunch, the group split into walking and biking teams to explore additional corridors. A common theme throughout the day was the challenge of retrofitting existing infrastructure to improve safety and accessibility for all users—while still accommodating vehicles and truck deliveries.
The bike group explored both new and retrofitted bridges to allow for safer pedestrian and bicycle crossings of both the river and railway tracks, and improved connectivity of the university district with downtown. The day concluded with a group reflection on key takeaways and opportunities for future improvements.