| A | B | C | D | E | F | G | H | I | J | K | L | M | N | O | P | Q | R | S | T | U | V | W | X | Y | Z |
Epidemiology GlossaryAAbsolute Risk Reduction (ARR):Absolute difference in the rate of events between the control and intervention group.ARR = events in control group minus events in intervention group BBayes Theorem:The estimate of the likelihood of a disease is increased or decreased by the results of a test. Pre-test odds of a disease x Likelihood Ratio = posttest odds of a diseaseSee nomogram for applying likelihood rations. Bias:A systematic error that leads to results that do not represent the true findings. See lead time bias and length bias.Blinding:Single Blind Study Design:The subjects do not know whether they are in the placebo or treatment group. Double Blind Study Design: Neither the subjects nor the researchers know whether the subject is in the placebo or treatment groups. CCase-control Studies:Retrospective studies beginning with people who have a disease and controls who are similar but do not have the disease. The investigator then looks retrospectively to see what proportion in each group were exposed to the same risk factors.
Causality:Determination of causality
Cohort Studies:Observational studies, prospective or retrospective, in which groups are assembled according to exposure or lack of exposure, then followed longitudinally to determine outcomes (e.g., fractions who develop a disease).
Confidence Interval (CI):Usually calculated as "95% confidence intervals", indicating that there is a 95% probability that the effect of treatment in the whole population lies within the stated range. The CI is affected by sample size and by variability among subjectsConfounders:Patient characteristics that may affect the results a study is trying to measure. Because these factors may be unevenly distributed (non-random) between study groups, they can decrease the validity of the study.Cost-effectiveness:Evaluates the outcomes and costs of interventions intended to improve health. Often framed as the resources required to achieve a set quantity of a specific health outcome.DEEffectiveness:The ability of an intervention to achieve the desired results under usual conditions.EfficacyThe ability of an intervention to achieve the desired results under ideal conditions.FGHIIncidenceThe number of new cases of disease within a given time period.JKKappa Value:Kappa value is a chance-corrected measure of agreement between pairs of observers. It reflects the degree of agreement for a particular physical finding. In general, a high level of agreement occurs when kappa values are above 0.5. Agreement is poor when kappa values are less than 0.3.See formulas for calculating kappa. LLead Time Bias:Apparent lengthening of survival due to earlier diagnosis in the course of disease without any actual prolongation of life.Length Bias:Bias due to the tendency of screening to detect a larger number of cases of slowly progressing disease and miss aggressive disease due to its rapid progression.
Likelihood Ratios:The odds of disease given a specified test value divided by the odds of disease in the study population. The odds that a given finding on history or physical examination would occur in a patient with the target disorder as opposed to a patient without the target disorder.See nomogram for applying likelihood rations. Positive Likelihood Ratio: Mnemonic: 
How big is a big LR+?
Negative Likelihood Ratio: Mnemonic:
How small is a small LR-?
MNNegative Predictive Value:See Predictive ValueNumber Needed to Treat (NNT):Number of people needed to treat to prevent one bad outcome.
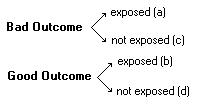
OOdds Ratio:
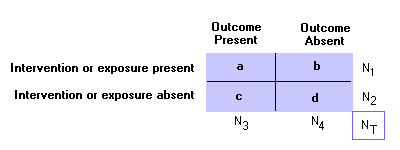
To calculate a, b, c, d: see the 2x2 table PPredictive Value:For both PPV and NPV, use table for calculations:
Positive Predictive Value (PPV): Negative Predictive Value (NPV): PrevelanceThe number of cases of disease in a population at a given time (frequency).
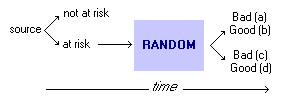
Use table to calculate: Probability:Pre-Test Probability: Post-Test Probability: QRRandomized Control Studies:Experimental study where people are randomly assigned to an intervention or control group. the randomization refers to allocation among study groups, not to eligibility for the trial.
Findings expressed as Relative Risk. Recall Bias:Subjects may have inaccurately recalled past medical history or previous exposures. This is especially a concern in retrospective studies in which the presence of a disease (or a particular outcome) may bias subjects' recall of their exposure to a putative risk.Receiver Operator Curves (ROC):A graph plotting the true positive rate (1-specificity) over a series of cutoffs for defining a positive test. A diagonal line indicates no ability to distinguish persons with and without the condition. The farther the curve reaches toward the upper left corner of the graph the better the test in discriminating diseased from non-diseased persons.
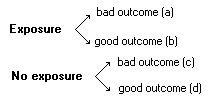
Relative Risk:
To calculate a, b, c, d: see the 2x2 table Reliability:The ability of a test to obtain the same results under the same conditions.SSensitivity:Proportion of persons with condition who test positive
To calculate a and c, see the 2x2 table SpecificityProportion of persons without condition who test negative:
To calculate b and d, see the 2x2 table Surrogate Marker:An alternate marker used in studies as a replacement for a true clinical outcome. Recent studies highlight the possible discrepancies between intermediate and endpoint markers. For example, eccanide and fleccanide, anti-arrhythmic medications, were shown to reduce ventricular arrhythmia (surrogate endpoint) but increase mortality (true clinical outcome).TTable ("2x2 table):Goal of epidemiologic investigation
See Relative Risk, Odds Ratio, Sensitivity, and Specificity for formulas. UVVariabilityIntraobserver Variability: Interobserver Variability: WXyZ |
| A | B | C | D | E | F | G | H | I | J | K | L | M | N | O | P | Q | R | S | T | U | V | W | X | Y | Z | Top |


