Experimenting with buildings in Westport
Developed with collaborators in the NSF-supported
Cascadia CoPes Hub project.
This is intended as proof of concept only, so far.
See vis3d for some other experiments
with 3D visualization.
Using Google Earth imagery around Westport as a texture on 1/3 arcsecond
topography used in the GeoClaw
tsunami simulations shown below.
Animation of tsunami simulations
With some building locations used to initialize
"debris" that is simply advected with the fluid velocity.
This may not be realistic debris movement, but helps visualize the flow.
These simulations only show the first 90 minutes post-quake, and do not
capture later waves and further flooding that would occur.
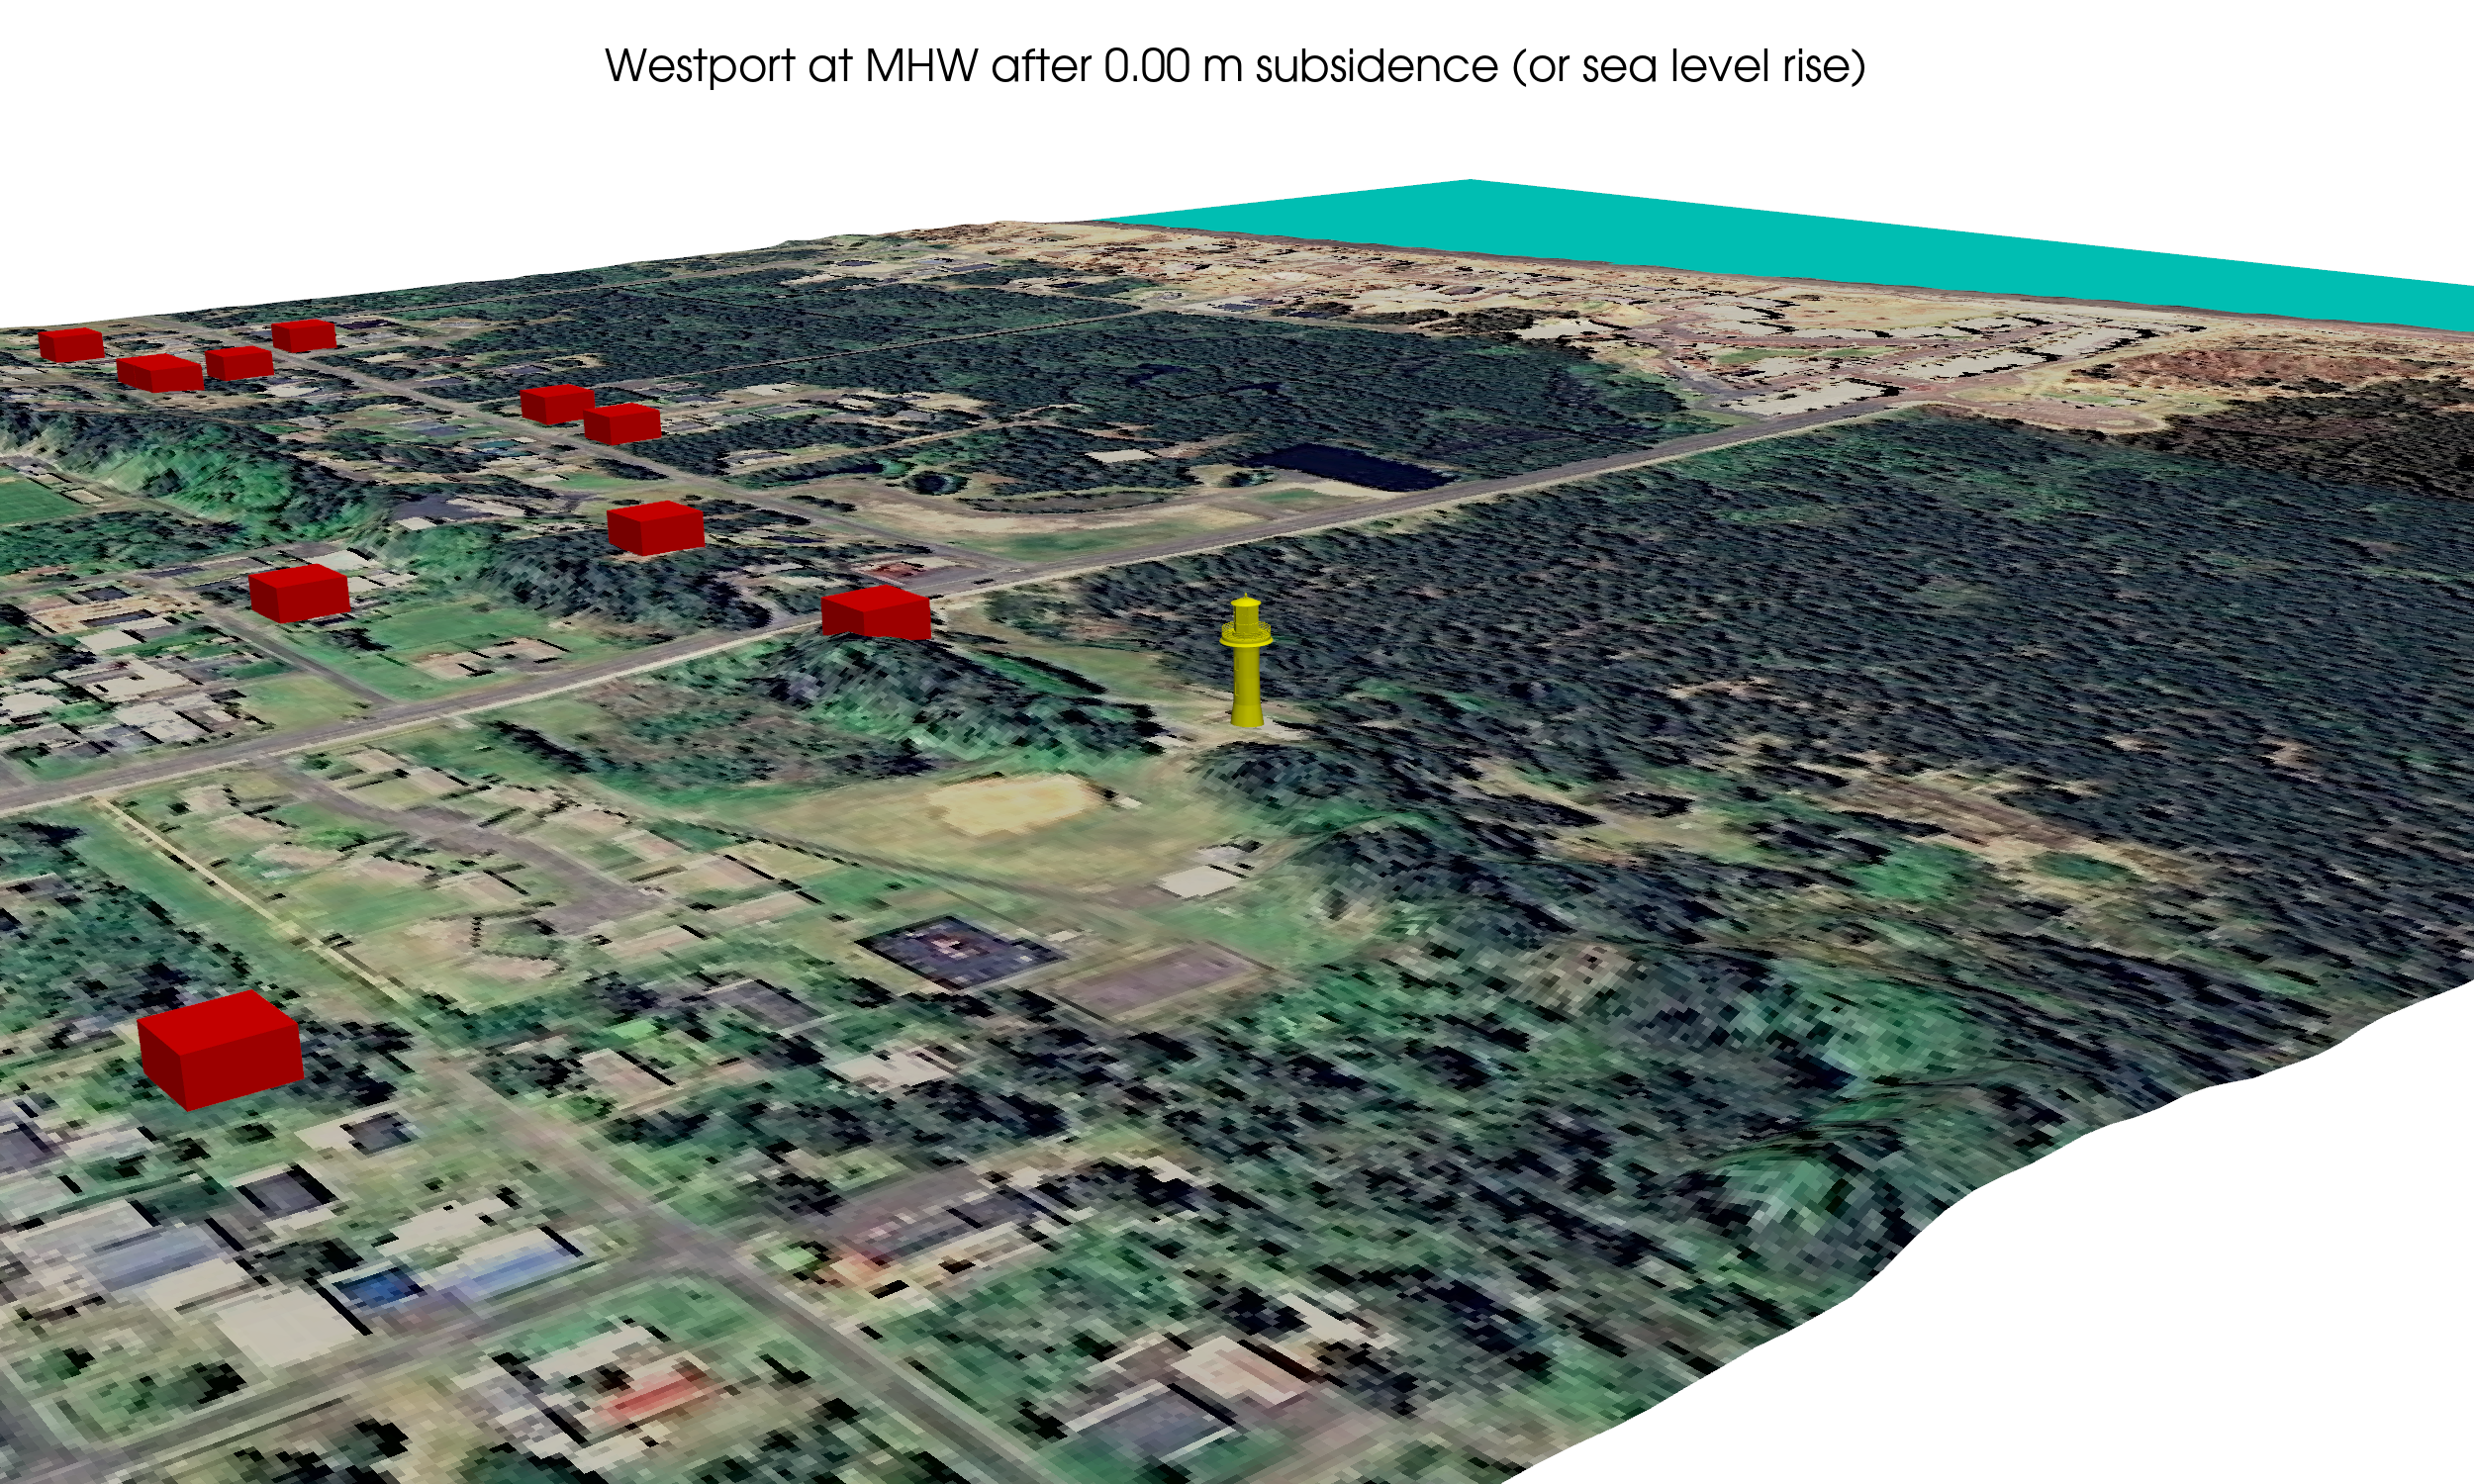
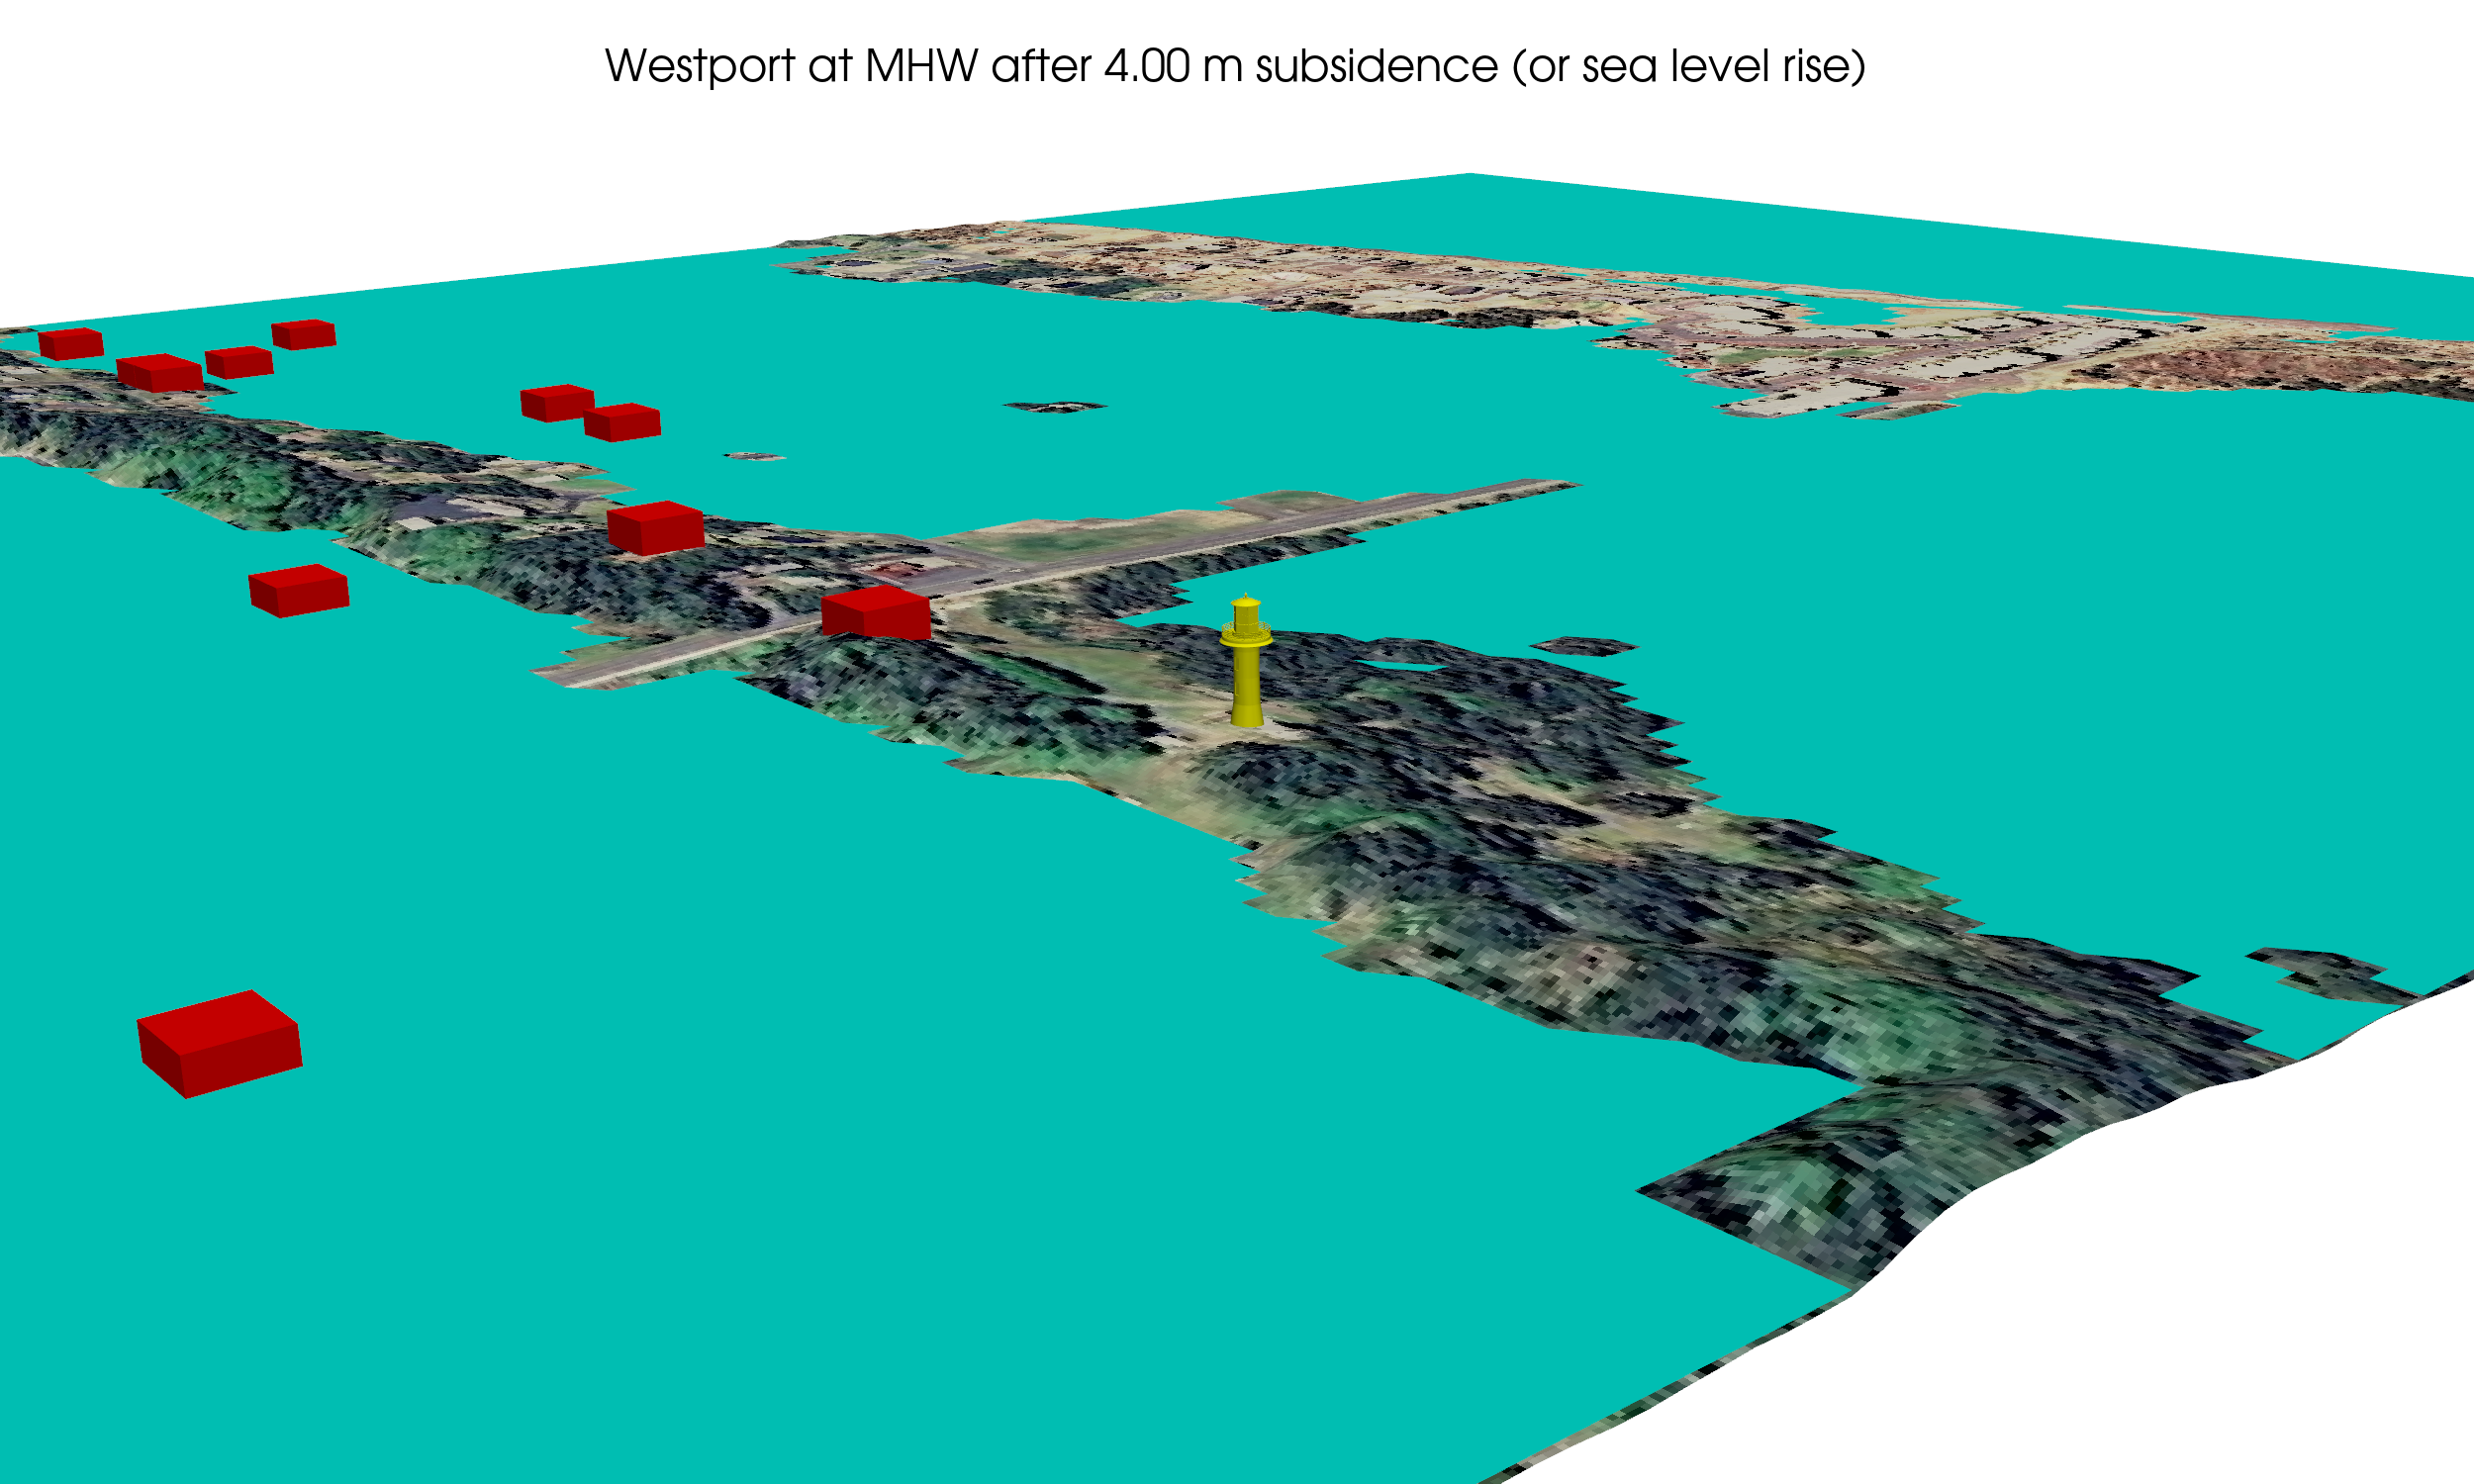
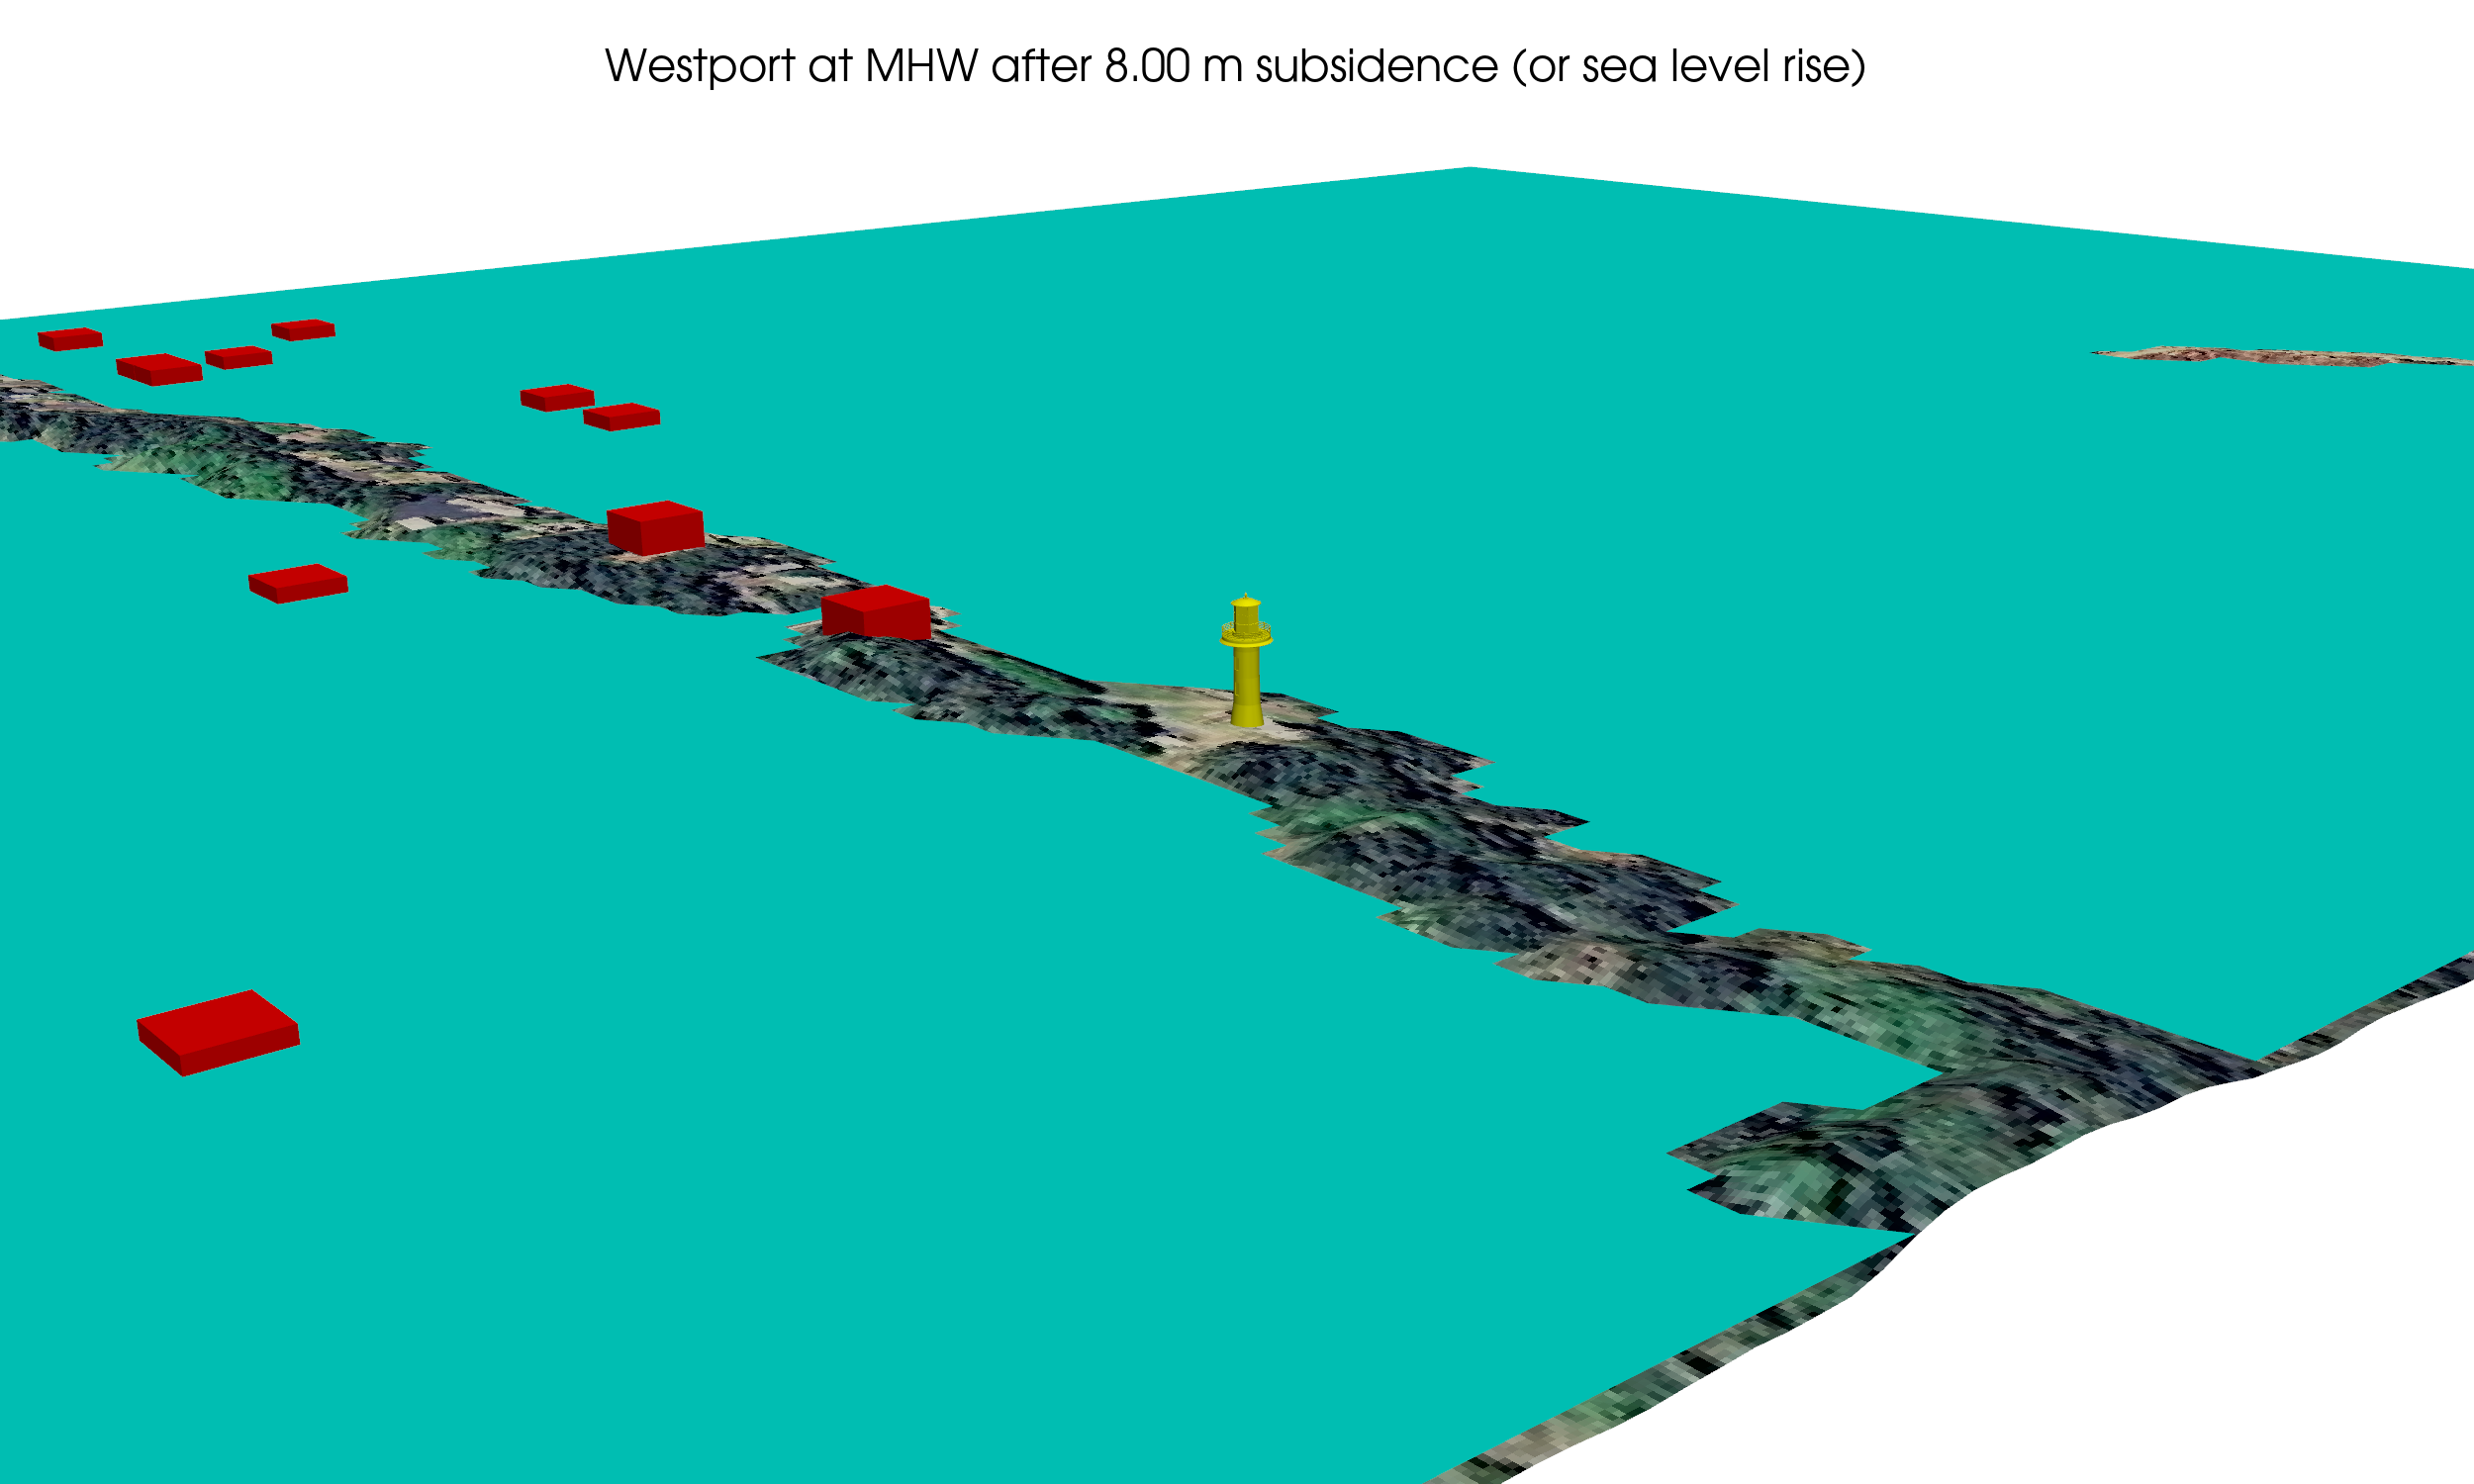
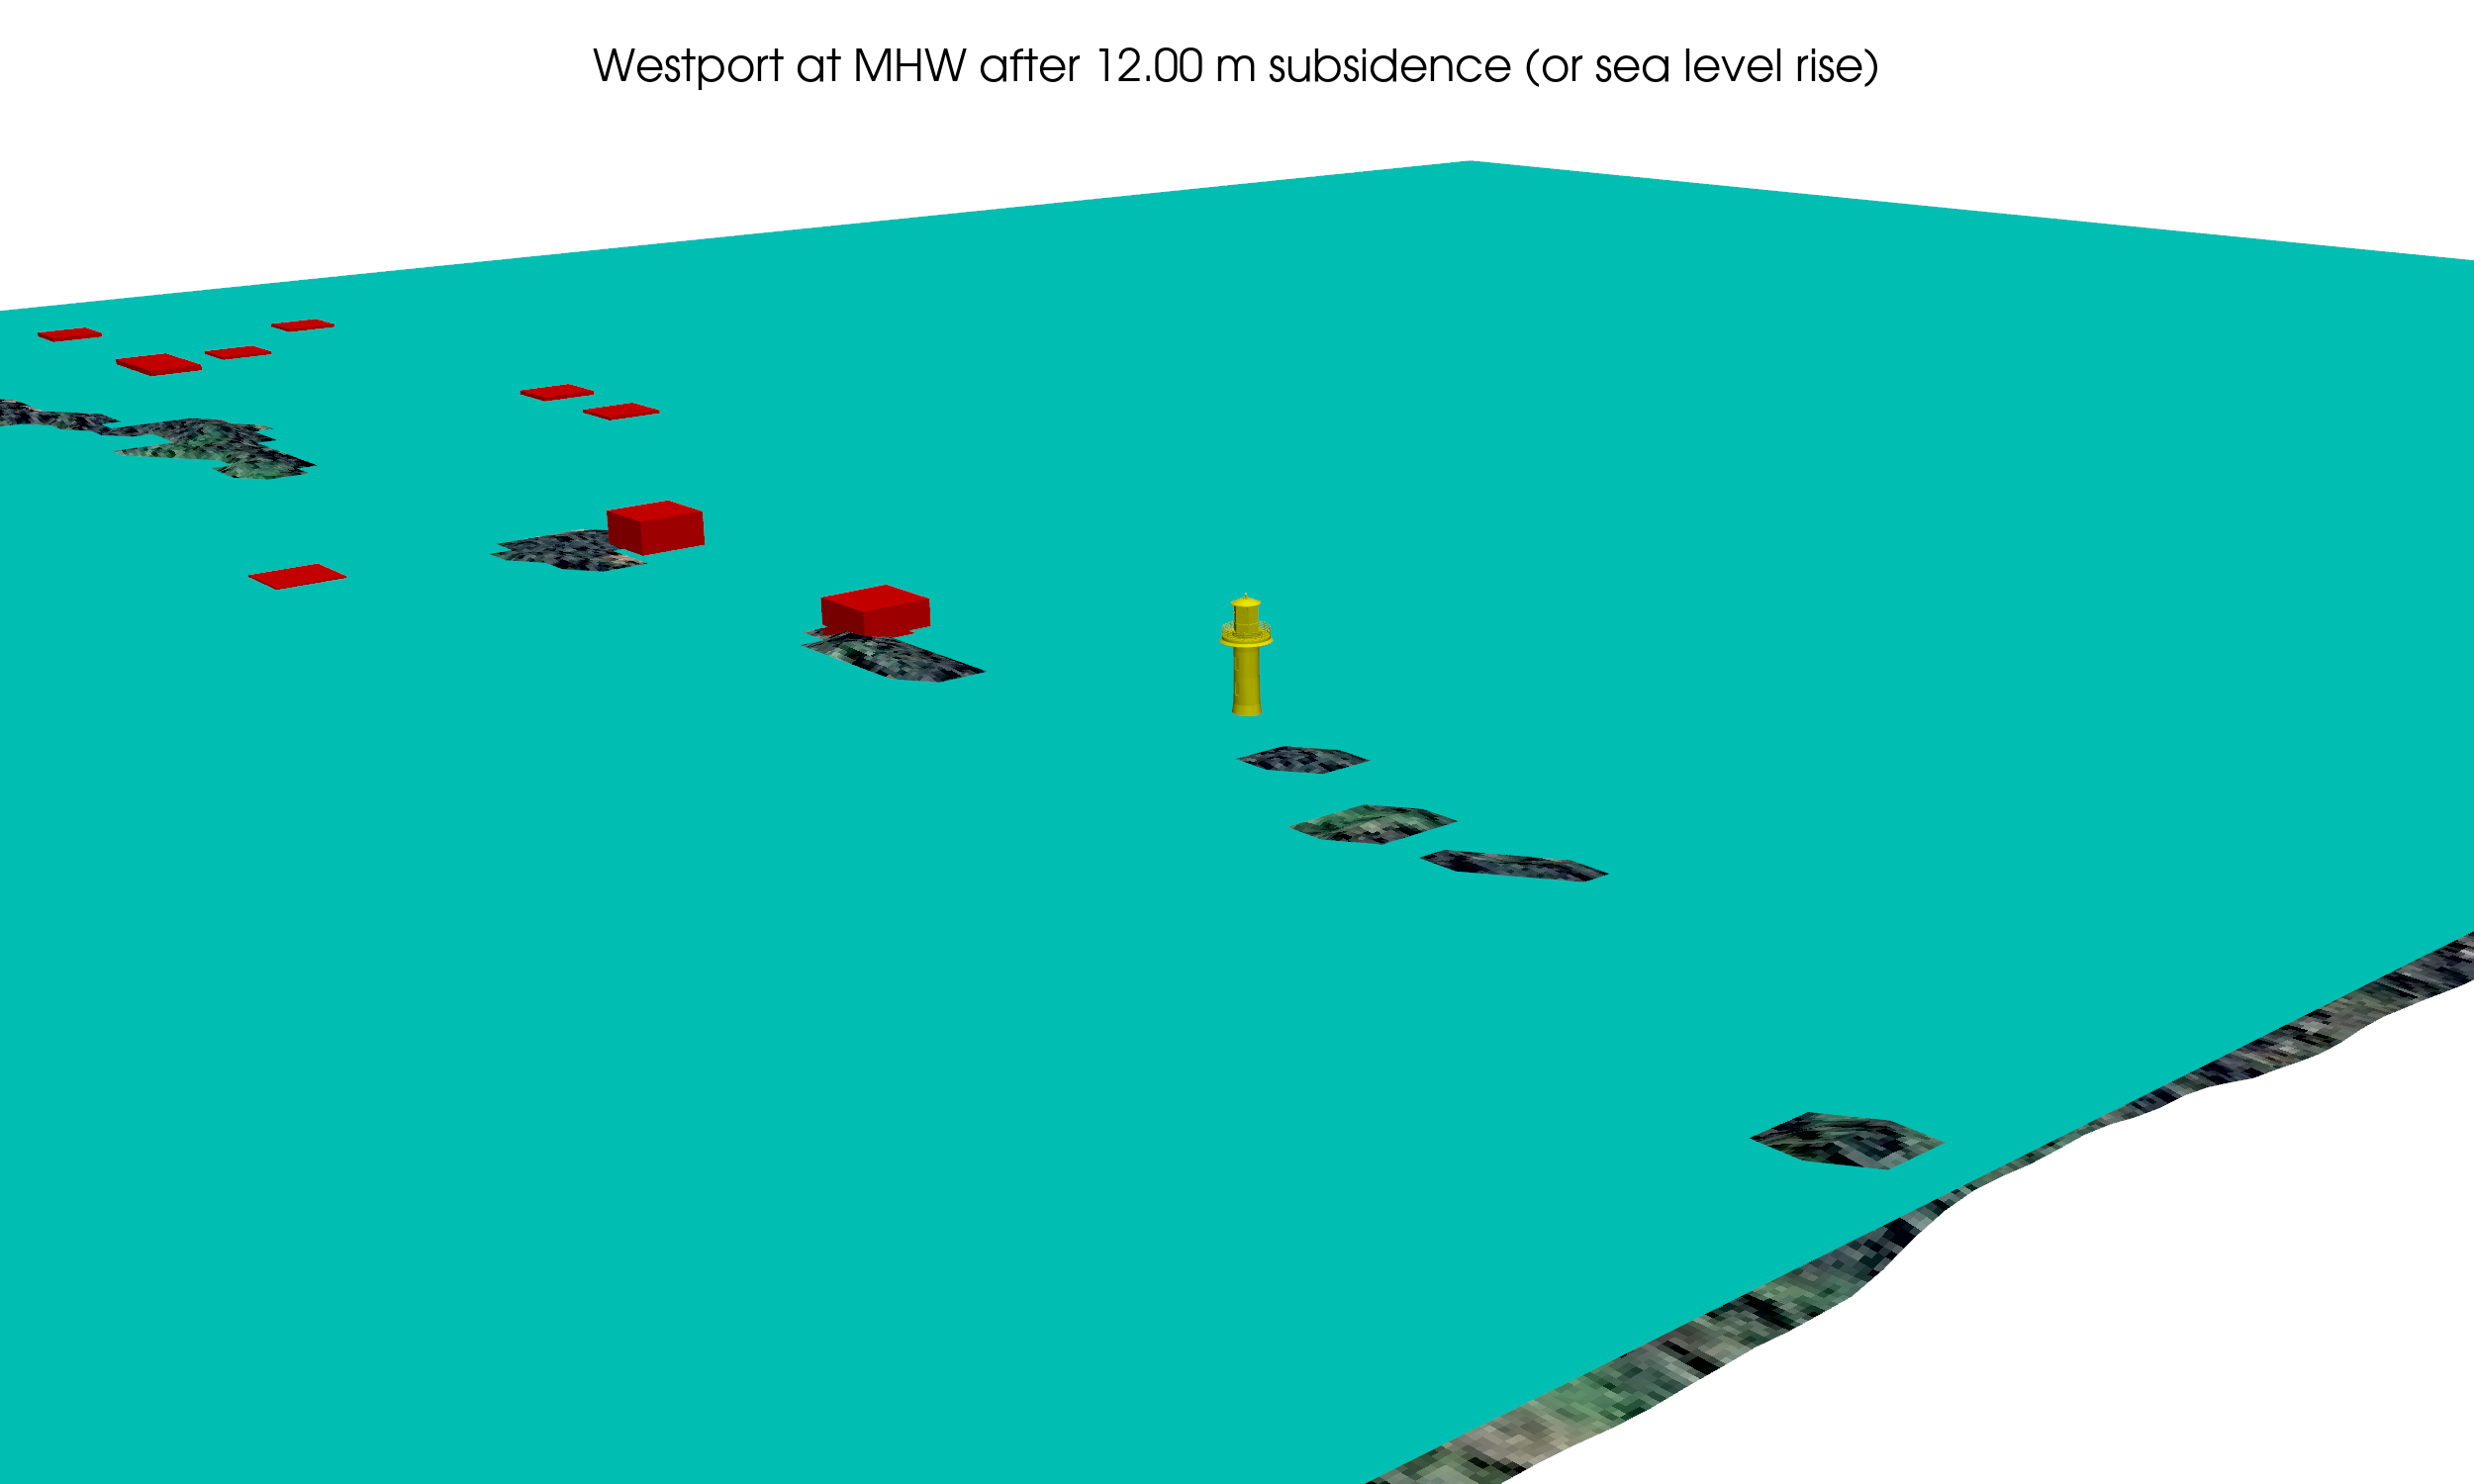
Visualizing effect of subsidence and/or sea level rise
Interactive view of lighthouse region at MHW:
With a few buildings from a database of the building inventory
drawn as boxes, and with
a generic 3D model of a lighthouse found at
lighthouse model, by dylanheyes (CC-Attribution license).
(With the correct height of 107 feet = 33 meters).
Snapshots at other water levels: