Frame 19 --- Study Area speed at time t = 1.71000e+04
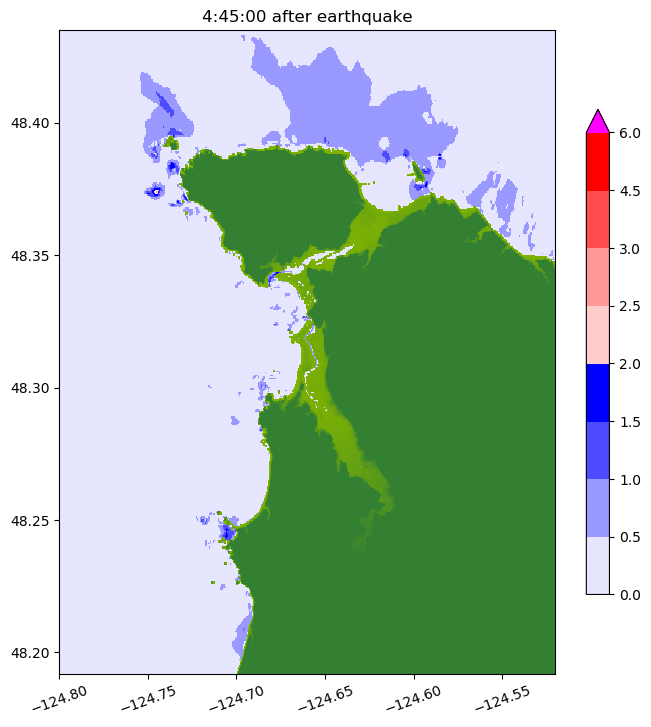
Image source: /rc_scratch/rale6846/WA_EMD_2020/Runs/Flattery/AK_v570/_plots/frame0019fig11.png
Other figures at this time: Computational domain Study Area eta Study Area speed All Figures
Other frames: 0 1 2 3 4 5 6 7 8 9 10 11 12 13 14 15 17 18 19 20 21 22 23 24 25 26 27 28 29 30 31 32 33 34 All Frames