Frame 2 --- Study Area speed at time t = 1.80000e+03
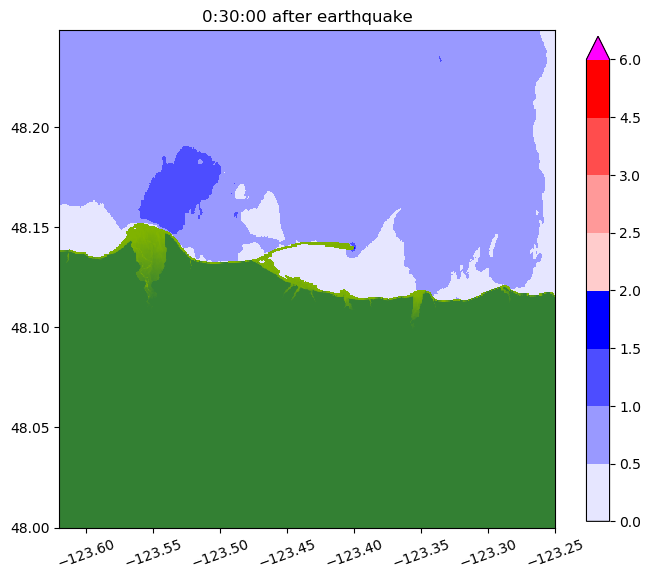
Image source: /rc_scratch/rale6846/WA_EMD_2021/Runs/Elwha_PA/CSZ_XL1/_plots/frame0002fig11.png
Other figures at this time: Computational domain Outer Coast eta SJdF eta Study Area eta Study Area speed All Figures
Other frames: 0 1 2 3 4 5 6 7 8 9 10 11 12 13 14 15 16 All Frames