All the power to youtube…
The "Cross of Gold" (1896) – a copy of the speech is here

All the power to youtube…
The "Cross of Gold" (1896) – a copy of the speech is here
The longer the global downturn lasts, the more tempting it becomes for governments to use protectionism to expenditure switch their way out of the crisis (See Chapter 15 and .
Global Trade Alert is an organization that expected exactly this trend and started to keep track of protectionist measures as the crisis unfolded. By now it has generated a rich database.
The database has become popular for news organizations to keep track of the sheer volume of tariffs and retaliations. Simon Evenett uses the database to document the "assault on world trade" ranking countries cleverly by
– number of measures imposed (#1 Russia, 20 measures)
– number of product categories affected (#1 China, 329 products)
– percent of sectors affected (#1 Algeria, 68% of all sectors protected)
– number of trading partners affected (#1 China, 163 countries)
Test drive the web site and the database, pick your favorite country and find out which measures were implemented, and which trading partner was affected. Can you surmise why particular countries choose protect particular industries or impose tariffs on particular trading partners?

"Global Imbalances" are often blamed as one source of the 2008/9 crisis. What are global imbalances? In a nutshell, US consumer, US firms, and the US government were "saving too little" and Asian economies, especially China were "saving too much." What's bad about that? Well the notion is that the excess savings in Asia funded the unsustainable behavior of US consumers/firms/government. At some point something had to give. Here is a good summary (edited) of the issues from Menzie Chinn.
According to news accounts [WSJ link], rebalancing is going to be a centraltopic.
Olivier Blanchard [IMF Chief Economist] has observed that the world will needto transition from public to private sources of demand and rebalance the globalpattern of growth in demand, “with a shift from domestic to foreign demand inthe United States and a reverse shift from foreign to domestic demand in therest of the world, particularly in Asia.†We hope to agree on the policiesneeded to avoid a return tothe sort of imbalances that contributed to this crisis and put in place aprocess for encouraging all countries to live up to their commitment to supporta transition to a more balanced pattern of global demand growth. Many thepolicies that would support this transition would also strengthen the overallpace of global growth.
Whenever I hear the term "rebalancing", I ampervaded by a sense of déjà vu. We've heard of this hope for years [1] [2] (andI proposed some steps to promote exactly that process in 2005 [3]). Are such hopes any more likely to befulfilled now?
The starting point in such discussions is usually China, partly because of its relatively rapidgrowth rate, and its large trade balances (although, as I've noted previously, China is smallrelative to developed economies [4] [5]), and accumulation of foreign exchangereserves.

Figure1: Chinese trade balance, in billion USDper month (blue, left axis) and Chinese international reserves, in trillion USD(red, right axis). NBER defined recessions shaded gray (assumes recessionbeginning 07M12 ends 09M06). Sources: IMF, InternationalFinancial Statistics, updated using ADB, ARIC database, and author'scalculations.
From my own perspective, I've always thought it odd tointerpret Chinaas the driver. Much better to think ofAmericaengaging in spendthrift behavior (most importantly via tax cuts and taxbreaks/distortions) enabled perhaps by East Asian economies.
But, returning to current events, first note that the US tradebalance has adjusted radically since the onset of the crisis. I don't thinkanyone argues that this very sharp adjustment has been due primarily to Chinesefactors. I'd say recession in the UScombined with credit crunch hitting US consumptionand trade financing, are key.

Figure 2: US goods and services trade balance (seasonally adjusted) to GDP ratio (blue) and US-China goods trade balance (nsa) to GDP ratio (red), and 12 month trailing moving average (maroon). NBER defined recessions shaded gray (assumes recession beginning 07M12 ends 09M06). Sources: BEA/Census, July trade release, Macroeconomic Advisers Sep. 17 release, and author's calculations.
Second, as shown in Figure 2, while the US-China tradedeficit now accounts for a larger share of the total US trade deficit, even thebilateral trade deficit is shrinking as a ratio to GDP (I suspect the tradedeficit will deteriorate somewhat as oil prices rebound, therebyreducing theChina share).
So let me argue for, if not primacy at least equality,for US factors. And here I think the question is what will happen toconsumption (and hence household saving). I think that there is a good chancethat rebalancing will occur.

Figure3: Log real consumption in Ch.2005$(blue, left axis) and log real household net worth (red, right axis),1990Q1-2009Q2. Household net worth deflated by PCE deflator. NBER definedrecessions shaded gray (assumes recession beginning 07M12 ends 09M06). Sources:BEA, 09Q2 2nd release, and Federal Reserve Board, Flow of Funds, Sept. 17release, and author's calculations.
My reasoning is that with household net worth downsubstantially from its peak, consumption growth is likely to remain lacklusterfor a substantial period, as households rebuild their balance sheets. In addition, the deleveraging ofthe financial sector is likely to make access to credit more difficult, furtherconstraining consumption beyond the impetus to rebuild net wealth.
Of course, just because rebalancing occurs doesn't meanall is happy in the world. Given that consumption is 70% of GDP (in nominalterms), slow consumption growth suggests slow GDP growth, in the absence ofsome alternative source of aggregate demand (net exports, government spending).
I note that Simon Johnson is skeptical of this call forrebalancing in the medium run. I agree that it's hard to see any means ofcredibly precommiting to implement policies that would enhance rebalancing. Butmy thesis is that many of the forces in play — deleveraging, higher householdsaving — might very well accomplish a lot of what did not occur during theprevious eight years. See also Justin Fox's and Martin Wolf's views.
Idiosyncratic Shocks are all the buzz when it comes to common currencies, such as the Euro. Everyone benefits in good times when a common currency eliminates transaction costs and facilitates capital flows.
But when member countries experience adverse economic shocks, or when their growth rates differ dramatically, there is conflict in the Union. Lagging countries would love to depreciate their currencies to gain a competitive edge (via expenditure switching), but there is no support for this from the leading countries. The laggard faces two unhappy choices: face the cost of leaving the union, or fact the cost of a long and painful adjustment.
Here it is instructive to remember that even the US is nothing other than a union of 50 states that have all agreed to use the dollar. If each state had its own currency, Louisiana could have simply depreciated its currency to export its way out of the Hurricane Katrina recession. But without that option, the state simply had to ride it out, live through the spike in of unemployment and endure falling wages. In the US, there seems to be consensus that such idiosyncratic shocks aren't all that bad — people can move other states to find jobs. Tell that to the Spaniards…
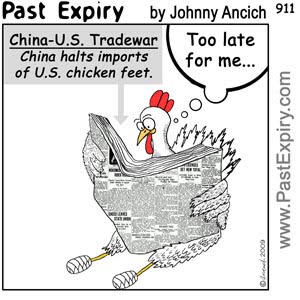
First off, the "Game of Chicken" is actually an economic model!
But this post is about how the impostion of a tariff is related to chicken, again. Harry Johnson taught us in the 1950s that its quite likely that the imposition of a tariff may not improve the welfare of a country — if other countires retaliate (and guess what, the ususally do). His analysis is presented in Figure 7.2 of International Economics.
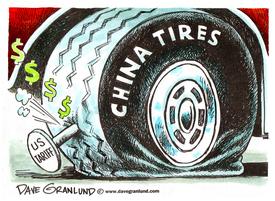
Now why would Obama impose a tariff if his advisors are well aware of Harry Johnson's work? (Hint: think about the economics of who is gaining and loosing, and the realities of political support)
Economists, even those staunchly in the Obama camp, are up in arms about his decision to levy tariffs on tires from China. Here is the most simplistic economists view on these tariffs (assuming partial equilibrium and that the US is a "small open economy"). This is certainly the easiest way to indicate the negative impact of a tire tariff, but its not the full story.
Doug Irvin, an eminent economic historian, reminds us that no matter how enlightened, independent, or ideological a president may have been, "regardless of party, every president, at some point, and often for political reasons, has imposed restrictions on imports."
Chapter 7 in International Economics clearly outlines that once politicians are maximizing not only economic welfare, but also political political objectives, it is actually the absence of tariffs that should surprise us.
What does endogenous protection imply about President Obama's objective function? Who are the key pressure groups in the US?
Gary Hufbauer Jeffrey Schott outline why "Buy American" is not only bad for US jobs, but even worse for US reputation. It is a classic "beggar-thy-neighbor" policy…
The IMF expects G-7 countries to show a combined fiscal deficit equivalent to 10.36% of GDP this year, more than double the level following the 1990-91 recession. Could that have anything to do with the divergence of dollar/gold as a safe haven?
This may just be the beginning of a long line of posts on the faltering fortunes of the dollar…
In a wonderful application of interest arbitrage, the dollar has been falling ever since deleveraging ended earlier this year. Today's WSJ outlines the key reasons
– risk appetite is up as people bet on the end of the global recession.
– investors are leaving the safe heaven of US treasury bills that they bought during the crisis
– where is the money going? China, Japan, Brazil of Europe
But wait there is more: deleveraging and changing risk perceptions are just one part of the interest arbitrage equation. On top of this
have caused a reversal for the first time in 16 years."
These two reports feed straight into the interest arbitrage equation to explain the falling dollar.
Here is the puzzle: the same day the dollar hit its low, gold topped the $1000/oz sound barrier. Usually gold is a safe haven, just like the dollar was during the crisis. Why the divergence?

