
Bloomberg nicely outlines the Chinese “Expenditure Switching” and “Expenditure Increasing” response. No one (other than the White House?) expected the Chinese to simply roll over and absorb Trumps trade war. Below is a wonderful graphic that outlines all the policy choices. 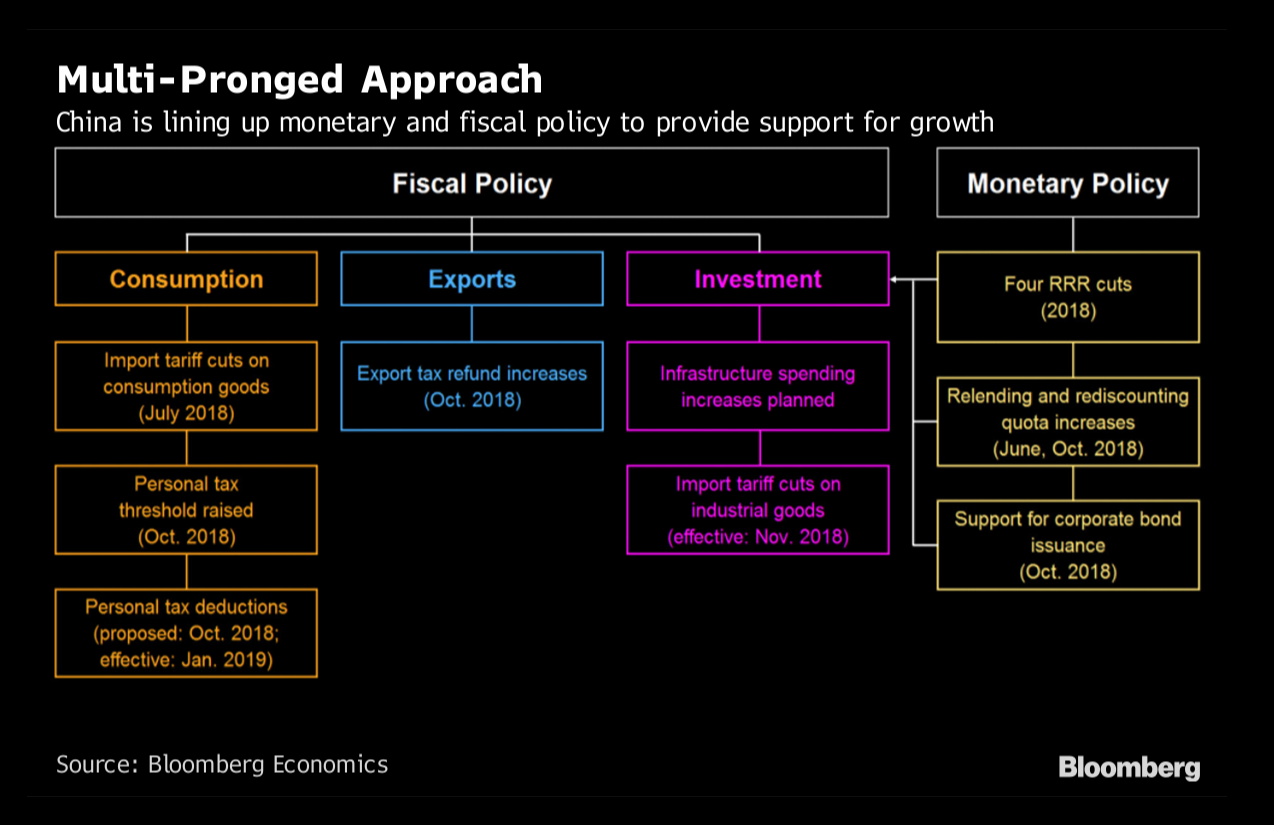
Category Archives: Expenditure Switching
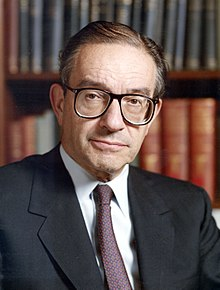
Former Fed Chair Comments On Trump’s Populism
In a recent BBC interview former Fed Chair Al Greenspan suggested that “The populism of Donald Trump is a “shout of pain” but it won’t improve the living standards of ordinary Americans.” Greenspan led the US Central Bank from 1987 to 2006, said Mr Trump’s trade war with China would hurt US workers. The BBC comments that “since 2017, Mr Trump has left or sought to renegotiate international trade deals and imposed steep import tariffs on goods like steel. He says he wants to stop US jobs being lost to countries with lower labour costs, like Mexico or China, while addressing decades-old trade imbalances.”
Interestingly Greenspan compared the president’s approach to that of populist leaders in Latin America in the late 19th and early 20th centuries. “We have one major so-called leader saying ‘I feel your pain and I am here to help you’,” he told BBC Radio 4. “People like the sound of it but the facts are he is lowering the standard of living of the average American.”
How do Greenspan’s comments relate to the policies that eventually require expenditure switching and expenditure reductions?
“IMF never again”: Argentinean Assessment Of The $50Bil IMF Deal
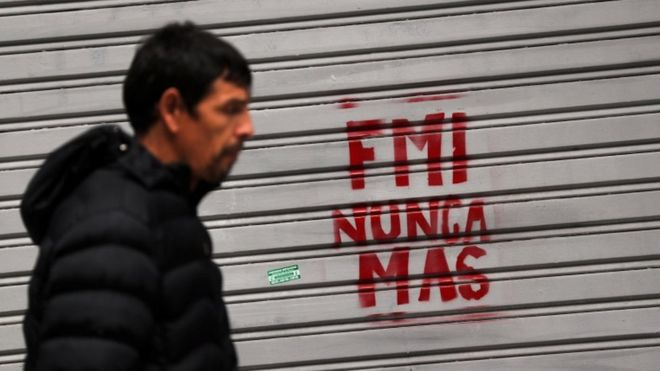
“IMF never again” says this graffiti in Argentina. There is widespread suspicion in Argentina about the new IMF deal, reports the BBC. Why? If, as the IMF Managing Director stated that “As we have stressed before, this is a plan owned and designed by the Argentine government, one aimed at strengthening the economy for the benefit of all Argentines.” “At the core of the government’s economic plan is a rebalancing of the fiscal position,” reports the IMF. Why the cryptic language use of the fancy term “rebalancing,” and why are Argentines suspicious?
Argentinean Expenditure Switching and Expenditure Reducing
Bloomberg reports that Argentina “will reduce the nation’s fiscal deficit at a faster pace as part of an agreement with the IMF…” At the same time the article suggests that “an eventual deal with the International Monetary Fund will restore confidence and ensure long-term economic growth, President Macri told reporters on Wednesday.” That may be difficult to achieve at while the fiscal deficit declines according to the TB/Y / NS-I model. But until growth returns, the “main objective is reducing the fiscal deficit, which is a fundamental problem. This is something that makes us vulnerable because we depend so much on lending.” “Depending too much on lending” is a great euphemism for “living above one’s means.” Below are a few background graphs that correlate well with the TB/Y models (Source: Financial Times).


Argentina: Crisis Deepens Without IMF Agreement
The WSJ Daily Shot has a great summary of recent events in Argentina: Argentina is in trouble. The peso (ARS) gave up 7% on Monday as markets await further news from the IMF.
The central bank continues its attempts to intervene, but the situation appears hopeless even with short-term rates at 40%. Argentina needs some $30bn in standby funds, perhaps more.
 Source: IIF
Credit investors are not taking chances, pushing Credit Default Swaps (CDS) spreads higher on Monday. (The price of a credit default swap is referred to as its “spread,” and is denominated in basis points (bp), or one-hundredths of a percentage point. For example, a Citigroup CDS might have a spread of 255.5 bp, or 2.555%. That means that, to insure $100 of Citigroup debt, you have to pay $2.555 per year).
And we have Contageon! Several other EM currencies are still struggling. Here Argentina’s neighbor’s currencies: The Brazilian real (BRL)
The Uruguayan peso (UYU):
Argentina Calls In The IMF
Time Magazine and the Economist Magazine report that Argentinians smell a rat. When interest rates at at 20%, if no “Austerity,” then what?  Things have taken a rather dramatic turn for the worst over the past two weeks. After the central bank hiked rates three times in the space of a week for a total of 1,275 basis points in an effort to arrest the slide in the peso. But that wasn’t enough as the Argentinean Peso (ARS) careened to a new all-time low ahead of another CB rate decision.
 Bloomberg noted, the bid/offer was “very wide with almost no real trades executed.” This crisis goes back to a poorly communicated December CB decision to up the inflation target along with a couple of rate cuts in January. Now the chickens have come home to roost and it’s a bloodbath, both for the currency and for the bonds, which are plunging:
 Needless to say, it doesn’t help that U.S. interest rates are rising. Standard results from a Mundell Fleming Monetary Policy expansion…
The Price of Austerity
Reply
Austerity protests are growing violent in Europe, and we are not just talking about Greece. Here is a summary of Austerity measures that European countries have instituted to avoid debt crises (spiraling public deficits that increase country risk). Its the cost of maintaining membership in the Eurozone. Other countries "simply" devalue – not that devaluation is without costs, they are just not that obvious. Here is a good exercise: lists the costs and benefits of staying in the Eurozone, and the costs and benefits of a devaluation. 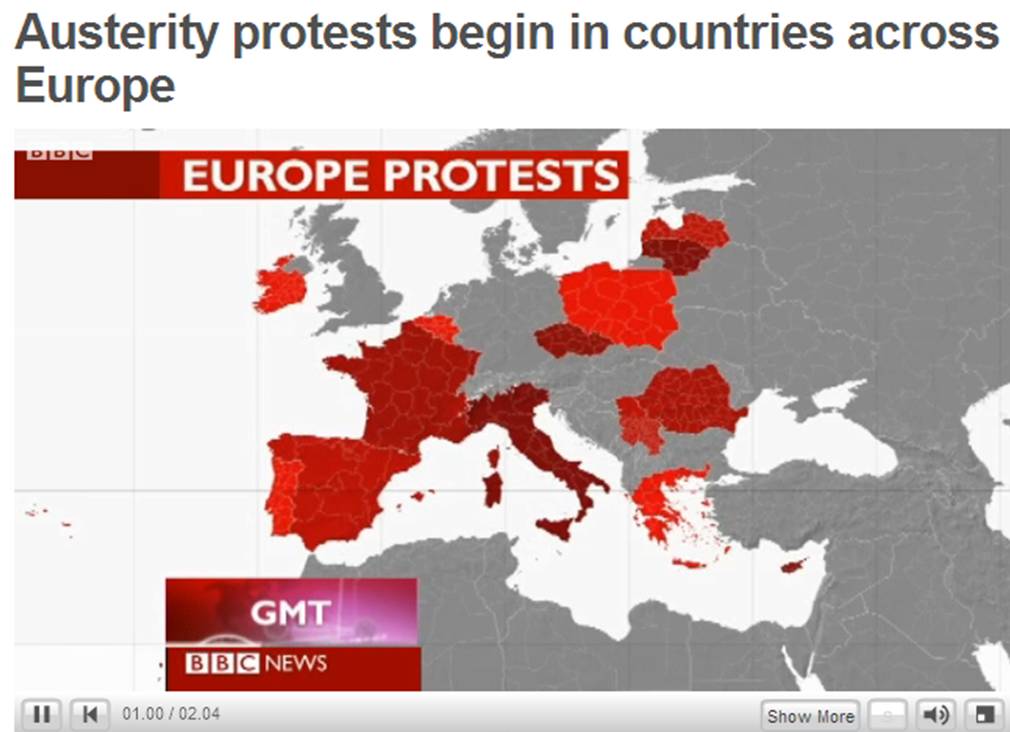
IMF breaks off talks with Hungary
Deficits, Elections & The IMF
Why have Hungary and the IMF been chatting in the first place? A previous post highlights Hungary's fiscal deficit problem, which led to increased country risk and foreign reluctance to finance the Hungarian external deficit. As Chapter 15 and this post by Simon Johnson outline, this is a classic case for the IMF — especially if elections are coming up. Here is the story from the Financial Times:
IMF breaks off talks with Hungary
This is a story we used to see a lot more ten or twenty years ago. Hungary and IMF have broken off talks, as the new Hungarian government refuses to accept further austerity measures. The FT reports that the message is not entirely clear, as the economy minister later accepted that Hungary would cut its budget deficit to 3% of GDP by 2011. It looks as though the government is mindful of the local elections, which could see the rise of a far-right party that opposes foreign capital. The election are held in October. The EU also criticised the Hungarian policies, as well as attempt to undermine the independence of the central bank. Hungary currently does not need to draw on the €20bn standby facility, but the article says the country’s financial position remains precarious. The forint fell by over 3% against the euro after the news of the breakdown of talks came out.
Update 7/23/2010: When It Rains, It Pours
From Bloomberg: Hungary Credit Rating May Be Cut to Junk After IMF Talks Fail
Standard & Poor’s said it is reviewing Hungary’s credit rating for possible downgrade after the collapse of negotiations with the International Monetary Fund and European Union. A cut would give Hungary’s debt a junk rating.
From Reuters: Ratings agencies threaten Hungary with downgrade
Moody's placed Hungary's Baa1 local and foreign currency government bond ratings on review, citing increased fiscal risks after the International Monetary Fund and the European Union suspended talks over their 20 billion euro ($25 billion) financing deal at the weekend.
Tough Love IMF Style
Chapter 15 outlines Expenditure Switching and Expenditure Reducing Policies. None one could have described the heart ache better than former IMF chief economist Simon Johnson. After using either the IS/LM or the TB/Y model to indicate how a country can end up with a balance of payments crisis, it may be interesting to read Johnson's account of the IMF's image problem. He highlights that no matter how different countries are the sources of the problems are almost always similar (as the models in Chapter 15 confirm…). His descriptive also highlights why the political powerless almost are always the losers when in the harsh austerity measures kick in, and that this hardly makes the IMF radar :
"ONE THING YOU learn rather quickly when working at the International Monetary Fund is that no one is ever very happy to see you. Typically, your “clients” come in only after private capital has abandoned them, after regional trading-bloc partners have been unable to throw a strong enough lifeline, after last-ditch attempts to borrow from powerful friends like China or the European Union have fallen through. You’re never at the top of anyone’s dance card.
The reason, of course, is that the IMF specializes in telling its clients what they don’t want to hear. I should know; I pressed painful changes on many foreign officials during my time there as chief economist in 2007 and 2008. And I felt the effects of IMF pressure, at least indirectly, when I worked with governments in Eastern Europe as they struggled after 1989, and with the private sector in Asia and Latin America during the crises of the late 1990s and early 2000s. Over that time, from every vantage point, I saw firsthand the steady flow of officials—from Ukraine, Russia, Thailand, Indonesia, South Korea, and elsewhere—trudging to the fund when circumstances were dire and all else had failed.
Every crisis is different, of course. Ukraine faced hyperinflation in 1994; Russia desperately needed help when its short-term-debt rollover scheme exploded in the summer of 1998; the Indonesian rupiah plunged in 1997, nearly leveling the corporate economy; that same year, South Korea’s 30-year economic miracle ground to a halt when foreign banks suddenly refused to extend new credit.
But I must tell you, to IMF officials, all of these crises looked depressingly similar. Each country, of course, needed a loan, but more than that, each needed to make big changes so that the loan could really work. Almost always, countries in crisis need to learn to live within their means after a period of excess—exports must be increased, and imports cut—and the goal is to do this without the most horrible of recessions. Naturally, the fund’s economists spend time figuring out the policies—budget, money supply, and the like—that make sense in this context. Yet the economic solution is seldom very hard to work out.
No, the real concern of the fund’s senior staff, and the biggest obstacle to recovery, is almost invariably the politics of countries in crisis.
Typically, these countries are in a desperate economic situation for one simple reason—the powerful elites within them overreached in good times and took too many risks. Emerging-market governments and their private-sector allies commonly form a tight-knit—and, most of the time, genteel—oligarchy, running the country rather like a profit-seeking company in which they are the controlling shareholders. When a country like Indonesia or South Korea or Russia grows, so do the ambitions of its captains of industry. As masters of their mini-universe, these people make some investments that clearly benefit the broader economy, but they also start making bigger and riskier bets. They reckon—correctly, in most cases—that their political connections will allow them to push onto the government any substantial problems that arise…"
The Great Contraction
International Feedback Mechanisms are detailed in Chapter 15. Except here, the locomotive effect is going the wrong direction…
Extra EU 27 Trade Falls by 20 % In 2009 – and that is before the upcoming EU austerity measures

Source: WSJ
To round out the balance of payment information, here is the news on EU financial flows:
EU Foreign Direct Investment (FDI) flows have been severely affected by the global economic and financial crisis. They …dropped sharply in 2008, for both inward and outward FDI flows (34 % for outflows, 52 % for inflows).
Euro Collapse, What’s it to the US?
Applications of Expenditure Switching and the Real Effective Exchange Rate changes, via Menzie Chinn
The euro has been depreciating against the dollar over the past few weeks. The implications of this development for the US depend critically on (1) the extent of the depreciation, (2) the duration, and (3) the source of the depreciation. (See Jim's post for other links.)

Figure 1: EUR/USD exchange rate, monthly averages (blue line), and value as of 5/14; and trade weighted value of USD against broad basket of currencies (red line), and value as of 5/14. NBER defined recessions shaded gray. Source: Federal Reserve Board via FRED II, NBER.
The euro has depreciated since the 2009M11 average, by about 10.5% in log terms, and about 16.1% versus 2008M07, just before the Lehman bankruptcy. What the graph makes clear is that the first flight-to-safety induced dollar appreciation faded after about a year. This second dollar appreciation might be construed as another flight-to-safety. How lasting will this appreciation be? Much depends upon how and whether the euro area governments resolve the current crisis. It also depends upon the desirability of US dollar denominated assets, including Federal government debt.
Since I am less pessimistic than some others regarding the short to medium term deficit outlook for the US [0], I think that the upward appreciation of the dollar against the euro might be fairly persistent. That being said, Figure 1 also highlights the fact that euro movements do not translate one-for-one into dollar value movements. At the monthly to annual frequency, the elasticity is about 0.4 to 0.45 (calculated as log-changes on log-changes).
It's difficult to evaluate the impact of exchange rate depreciation on GDP, and other variables, without taking a stand on what causes the exchange rate movements. The OECD has recently released documentation on their new macroeconometric model. One of the experiments implemented involves a 10% euro depreciation against a basket of currencies. From Karine Hervé, Nigel Pain, Pete Richardson, Franck Sédillot and Pierre-Olivier Beffy, The OECD's New Global Model, Economics Department Working Papers No. 768 (May 2010) (h/t Torsten Slok):

The simulations are conducted in the following fashion:
The exchange rate simulations assume sustained 10% nominal effective depreciations, individually for US dollar, yen and euro rates, against all other currencies, assuming that monetary policy follows a standard Taylor rule and that fiscal policy is set by endogenous rule. Following depreciation in the first quarter, the exchange rate is assumed to remain at the new level throughout the simulation period with the sustained shift assumed to be exogenous, coming from unexplained movements in markets expectations, rather than being policy induced or reflecting an identifiable change in economic fundamentals. The possible endogenous influence of simulated changes in interest rates on exchange rates, which might tend to offset the original shock, is therefore not taken into account. For this reason, these shocks are not particularly realistic, but serve rather to illustrate the role and transmission channels of exchange rates in the model.
The key channel is expenditure switching; a depreciation induces more spending on euro area goods, and less on those of the RoW. However, the table indicates the effect of a 10% euro depreciation would only have a modest impact on US GDP — a 0.2 percentage point deviation relative to baseline two years out, if sustained. The historical correlation between the euro/dollar rate and the BIS trade weighted value of the euro is about 0.5 (that is, the elasticity is about 0.5), so the euro depreciation since the April average is only about 5%, and hence the negative impact about half that indicated in the table.
There are other channels incorporated in the model, including valuation effects from exchange rate changes (see this post for discussion).
Part of the reason that the effect on the US is modest is that changes in the euro/dollar exchange rate are not the same as changes in the USD value. This is illustrated in Figure 1. The short run elasticity of (broad) trade weighted exchange rate with respect to the euro/dollar exchange rate is about 0.4-0.45 (at the one month to one year horizon).
The model is fairly conventional in terms of macroeconomics — in the short run output is largely demand determined, while in the long run it is supply determined (in other words, pretty much like in most standard macro textbooks). The key distinction is econometric; the key macro relationships are estimated using error correction models.
One channel that is not included (and would not be included in a open economy RBC [1] or a standardDSGE) is the effect coming from cross-border propagation of equity price declines. For that, one might need to appeal to financial stress indicators, as discussed in this post.
Interesting side point: the government spending multipliers are substantially greater than unity.

The multiplier, defined as the five year cumulative deviation from baseline for a one percentage point of GDP increase in government spending is 2.0; this multiplier assumes a Taylor rule for monetary policy. Presumably, with interest rates set at zero, the multiplier would be bigger.
Greek Cause and Consequence
The fixed exchange rate does not leave much room for Greece to deal with its debt and budget deficit.
I summarized the causes of the Greek tragedy in a previous blog, the results are captured by Yahoo's and MSNBC's slideshows.
1) Use the TB/Y diagram to show how Greece got into the crisis. Refer to specific actions of the Greek government in the past decade
2) Use another TB/Y diagram to show the necessary Greek reforms to get out of the crisis.

Buy American – The Flip Side
I have previously discussed the Buy American measures that are designed to induce expenditure switching.
Here is an extract from a Canadian blog that highlights why such provisions are so unpopular with trading partners….
Exports and Buy America:
Exports to the United States have fallen nearly 50%, in part thanks to “Buy America”.
I was just transferred from our Mississauga, ON offices to Hamilton, and I get the pleasure of driving through the steel armpit of Ontario daily. US Steel purchased Stelco, our largest steel manufacturer, two years ago and just after it received hundreds of millions from Ontario’s provincial government to keep operating. Within days of “Buy America”, US steel shut down the Canadian Stelco plant.
A few months ago, as the benefits for the laid off workers dried up, US Steel was notified that they would have to either bring the workers back or pay out their pensions. US Steel decided to bring them back to work. Instead of making steel, they painted all the buildings in a fresh coat of blue paint. If you understand the size of the Stelco plant and buildings, then you can understand what a formidable task this was.
A couple weeks after it now appears that all the buildings are blue and the workers have been laid off again. However the steel mill now sends clouds of pollution miles high in the sky. I have been told by some locals that the US Steel sends its iron ore to the plant to be refined. Once refined it is put back on the ship and sent to one of their US plants – most likely in Gary Indiana – to be turned into steel. So we get the pollution up here but none of the profits or labour. The government of Canada has taken US Steel to court for $10 million per day for breach of contract.
Wait until more Canadians find out about this. “Buy Canada’, or more plausibly, “Do Not Buy America” will gain steam. We’re a free trade country by and far, but “Buy America” has been a hard hit below the belt for most of us.

Protectionism
The longer the global downturn lasts, the more tempting it becomes for governments to use protectionism to expenditure switch their way out of the crisis (See Chapter 15 and .
Global Trade Alert is an organization that expected exactly this trend and started to keep track of protectionist measures as the crisis unfolded. By now it has generated a rich database.
The database has become popular for news organizations to keep track of the sheer volume of tariffs and retaliations. Simon Evenett uses the database to document the "assault on world trade" ranking countries cleverly by
– number of measures imposed (#1 Russia, 20 measures)
– number of product categories affected (#1 China, 329 products)
– percent of sectors affected (#1 Algeria, 68% of all sectors protected)
– number of trading partners affected (#1 China, 163 countries)
Test drive the web site and the database, pick your favorite country and find out which measures were implemented, and which trading partner was affected. Can you surmise why particular countries choose protect particular industries or impose tariffs on particular trading partners?
