
Jeff Frankelhas a great review of the most past and present current account determinants.
Use the TB/Y diagram to explain why the CA in the US may have improved after the 2008 Crisis. 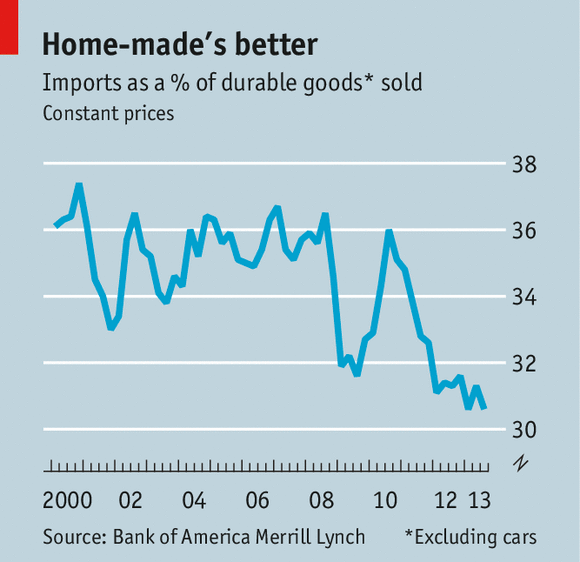
This figure is from the economist magazine, why did they exclude cars? Read the article – then does the
exclusion make more or less sense?