The monthly release of the US Payroll data is always a key indicator of economic activity. Jeff Miller parses what we should and should not read into the payroll data. Here is the abstract:
A) Job creation and destruction exceeds 2 million per month, so the net effect is likely going to be relatively small – despite the fact that the economy created millions of jobs.
B) The reported payroll data is the change in the net, reducing the magnitude of the payroll data even further.
C) But most importantly, the payroll data ist is not the actual change in payroll jobs based on a surveyed sample of US businesses.
D) Given the size of the US workforce (~150 million), the sampling error implies a 90% confidence interval of 112,000 jobs! This means that if 100 samples were taken, the mean of 90 of the 100 samples would contain the true mean, but that these 90 samples could differ up to 112,000 jobs.
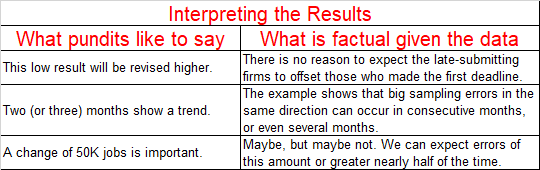
This has important implications for the interpretation of payroll results: