
The Bank for International Settlements maintains a rich time series on real effective exchange rates. Interestingly, Econbrowser uses the data to show that the appreciation of the dollar against the euro is much less pronounced when we look at the broadest exchange rate measure. The answer is of course China holding its exchange rate with the US fixed.
The euro and the dollar. First, here is a graph of the dollar/euro exchange rate expressed in units of USD per EUR.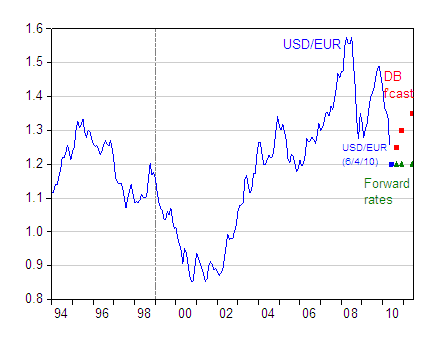
Figure 1: USD/EUR exchange rate, monthly averages (blue line); synthetic euro before 1999M01. USD/EUR exchange rate on 6/4/2010 (blue square), Deutsche Bank forecasts as of 6/4/2010 (red squares) and forward rates (green triangles). Source: Fed via FREDII, Deutsche Bank, Exchange Rate Perspectives, June 8, 2010 [not online].
The euro has declined precipitously since late last year. As of June 4, the USD/EUR rate was 1.2. Forward rates (which have little predictive power, and usually point in the wrong direction [2] ) imply no change. The Deutsche Bank forecast is for strengthening against the dollar, rising to 1.35 USD/EUR in a year’s time.
That’s just one forecast, and given the uncertainties regarding the resolution of the euro area’s fiscal problems, there is little reason to put too much credence on this particular forecast. But this brings me to the second point. Despite the euro’s depreciation, the dollar has exhibited much less movement on a real, trade-weighted, basis.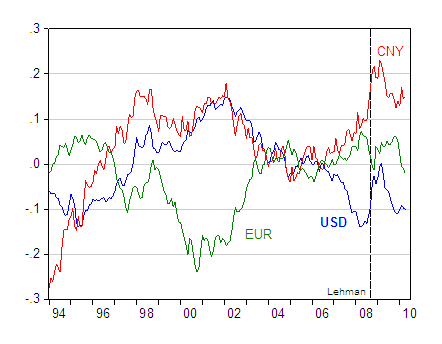
Figure 2: Log broad trade weighted real USD (blue bold), CNY (red) and EUR (green). Source: BIS and author’s calculations.
The data on this graph only extend up to 2010M04. The USD in nominal terms, on a broad basis, has appreciated by 2.8% (log terms, not annualized) in May. Still, that puts into perspective the fact that the USD is roughly where it was on the eve of the Lehman collapse.