
James Hamilton has a great post on why economists use logarithms: S– it’s usually a much more meaningful and robust way to display and examine data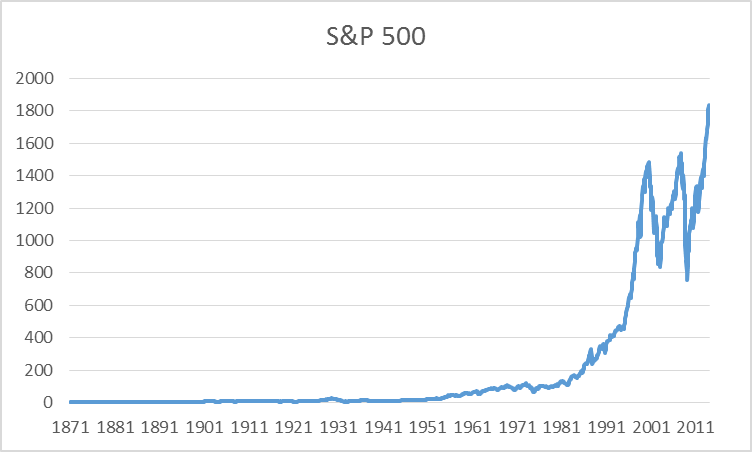
S&P 500 stock price index, 1871:M1 – 2014:M2. Data source: Robert Shiller.
On the other hand, if you plot these same data on a log scale, a vertical move of 0.01 corresponds to a 1% change at any point in the figure. Plotted this way, it’s clear that, in percentage terms, the recent volatility of stock prices is actually modest relative to what happened in the Great Depression in the 1930′s.
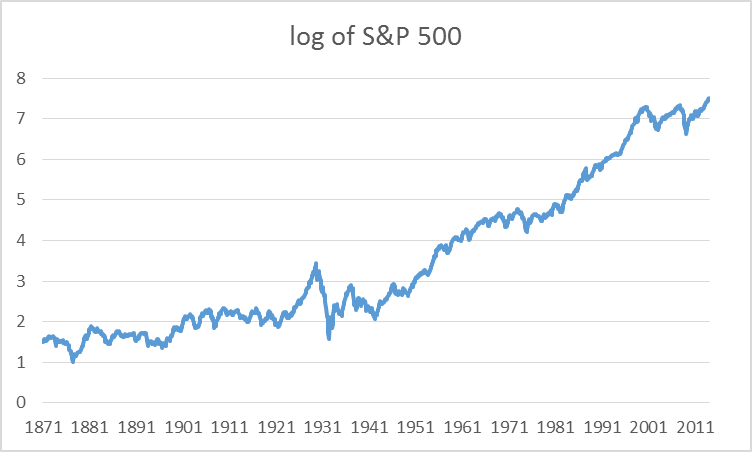
Natural log of U.S. stock prices.
other helpful sites are
http://people.virginia.edu/~rwm3n/pdf/Notes%20on%20logarithms.pdf