Difference between revisions of "MEG Data Acquisition"
| Line 14: | Line 14: | ||
View -> Show viewer | View -> Show viewer | ||
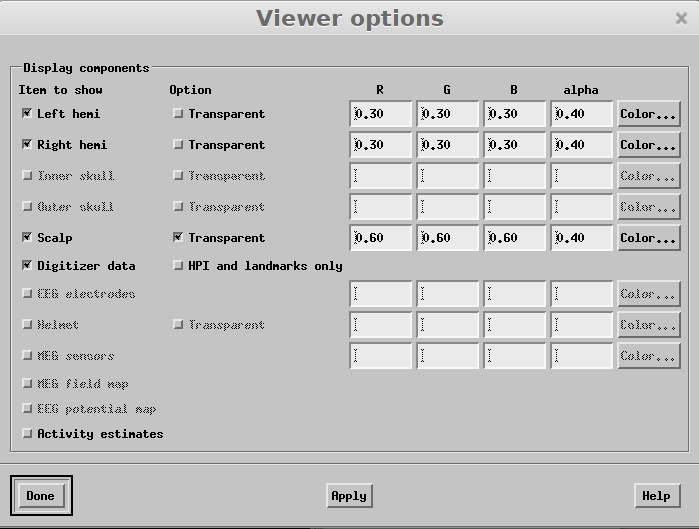
Within the viewer window click the "Options" button. Within the "Viewer Options" dialogue check "digitizer data" and "HPI and landmarks only". [[File:Viewer options.png]] | Within the viewer window click the "Options" button. Within the "Viewer Options" dialogue check "digitizer data" and "HPI and landmarks only". [[File:Viewer options.png]] | ||
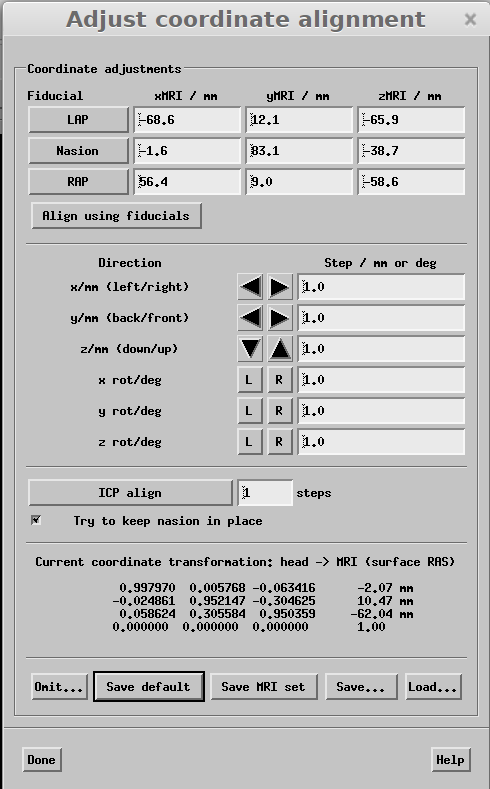
| − | + | Next mark the fiducial locations on the scalp. To do this click LAP, RAP and Nasion in the "Adjust coordinate alignment" dialogue and then mark each spot by clicking on the scalp surface . After marking each location click "Align using fiducials". [[File:Mne analyze AdjustCoordAlign.png]] | |
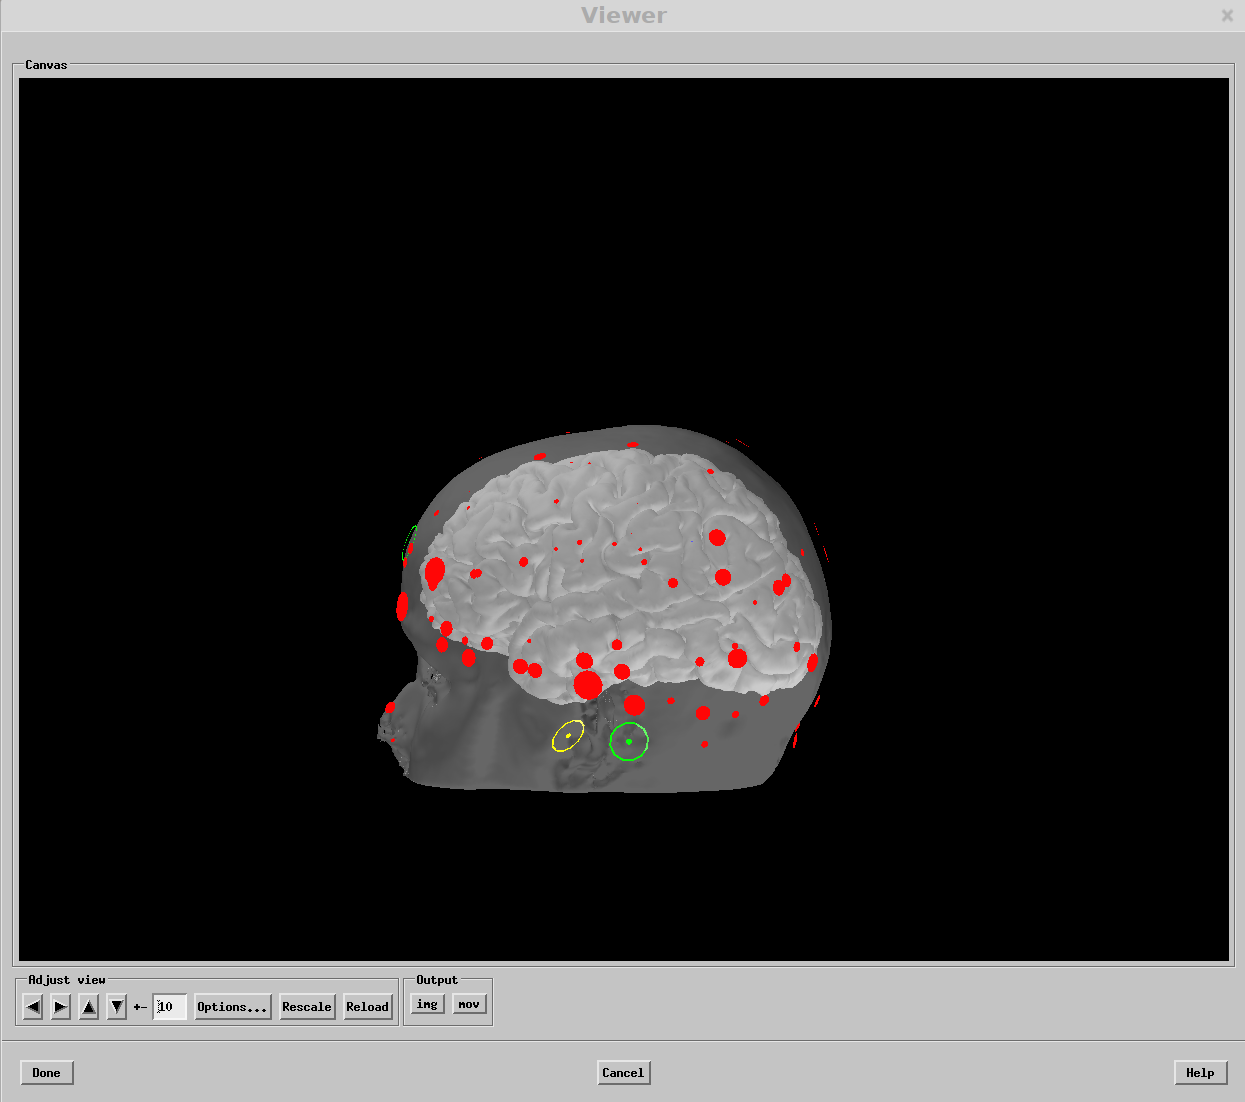
| − | + | From this point it is an art of getting as many of the digitizer points as possible to lie on the scalp. In the "Viewer Options" dialogue make the scalp transparent and un-check the "HPI and landmarks only" button. This will let you see where each digitized point lies with respect to the scalp. You want each point on the surface but not below it. Blue points are below the surface. Adjust points manually with the arrow buttons and using the ICP algorithm until you are happy. [[File:Mne analyze viewer.png]] | |
| − | + | ||
| − | + | ||
| − | + | ||
| − | + | Once you have aligned everything click "Save Default" in the coodinate adjustment dialogue. This will save out the transform in the subjects folder. Then, make a "trans" folder within the subject's directory and move transform file and rename subj-trans.fif | |
| − | + | ||
| − | + | == Visualizing data in source space | |
| − | + | mne_analyze | |
| − | + | File -> Load Surface -> Select Inflated | |
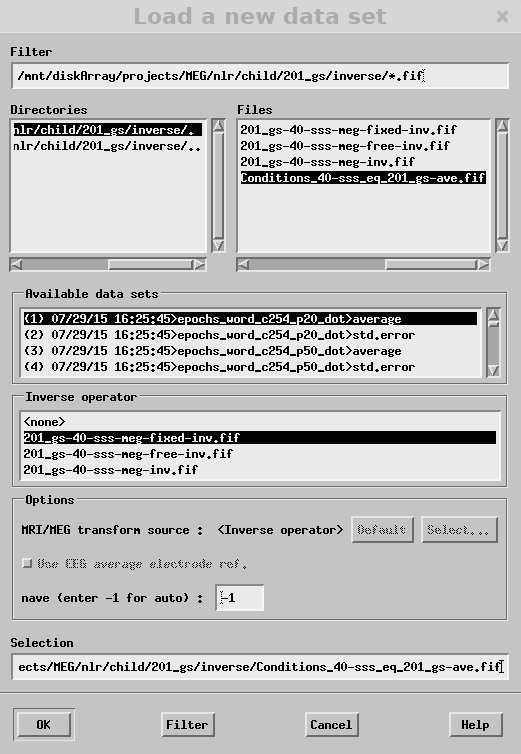
| + | File-> Open | ||
[[File:LoadInverse-mne analyze.png]] | [[File:LoadInverse-mne analyze.png]] | ||
To adjust sensor plots: Adjust -> Scales | To adjust sensor plots: Adjust -> Scales | ||
To adjust source visualization: Adjust -> Estimates | To adjust source visualization: Adjust -> Estimates | ||
Revision as of 22:24, 23 October 2015
Creating a BEM model for source localization
After running freesurfer on a subject's T1 anatomy we next need to create a BEM model.
 cd /home/jyeatman/git/mnefun/bin
 python run_mne_bem.py --subject NLR_201_GS --layers 1 --overwrite
Aligning MEG sensor data to the BEM model
Open mne_analyze to compute the coordinate alignment. In mne_analyze load the subject's surface and digitizer data:
 File -> Load Surface -> Select Inflated
 File -> Load Digitizer Data -> sss_fif -> select any raw file
Next adjust how these digitized points align with the scalp in the MRI
 Adjust -> Coordinate Alignment
 View -> Show viewer
Within the viewer window click the "Options" button. Within the "Viewer Options" dialogue check "digitizer data" and "HPI and landmarks only".  Next mark the fiducial locations on the scalp. To do this click LAP, RAP and Nasion in the "Adjust coordinate alignment" dialogue and then mark each spot by clicking on the scalp surface . After marking each location click "Align using fiducials".
  From this point it is an art of getting as many of the digitizer points as possible to lie on the scalp. In the "Viewer Options" dialogue make the scalp transparent and un-check the "HPI and landmarks only" button. This will let you see where each digitized point lies with respect to the scalp. You want each point on the surface but not below it. Blue points are below the surface. Adjust points manually with the arrow buttons and using the ICP algorithm until you are happy.
Once you have aligned everything click "Save Default" in the coodinate adjustment dialogue. This will save out the transform in the subjects folder. Then, make a "trans" folder within the subject's directory and move transform file and rename subj-trans.fif
== Visualizing data in source space
 mne_analyze
 File -> Load Surface -> Select Inflated
 File-> Open
 To adjust sensor plots: Adjust -> Scales
To adjust source visualization: Adjust -> Estimates