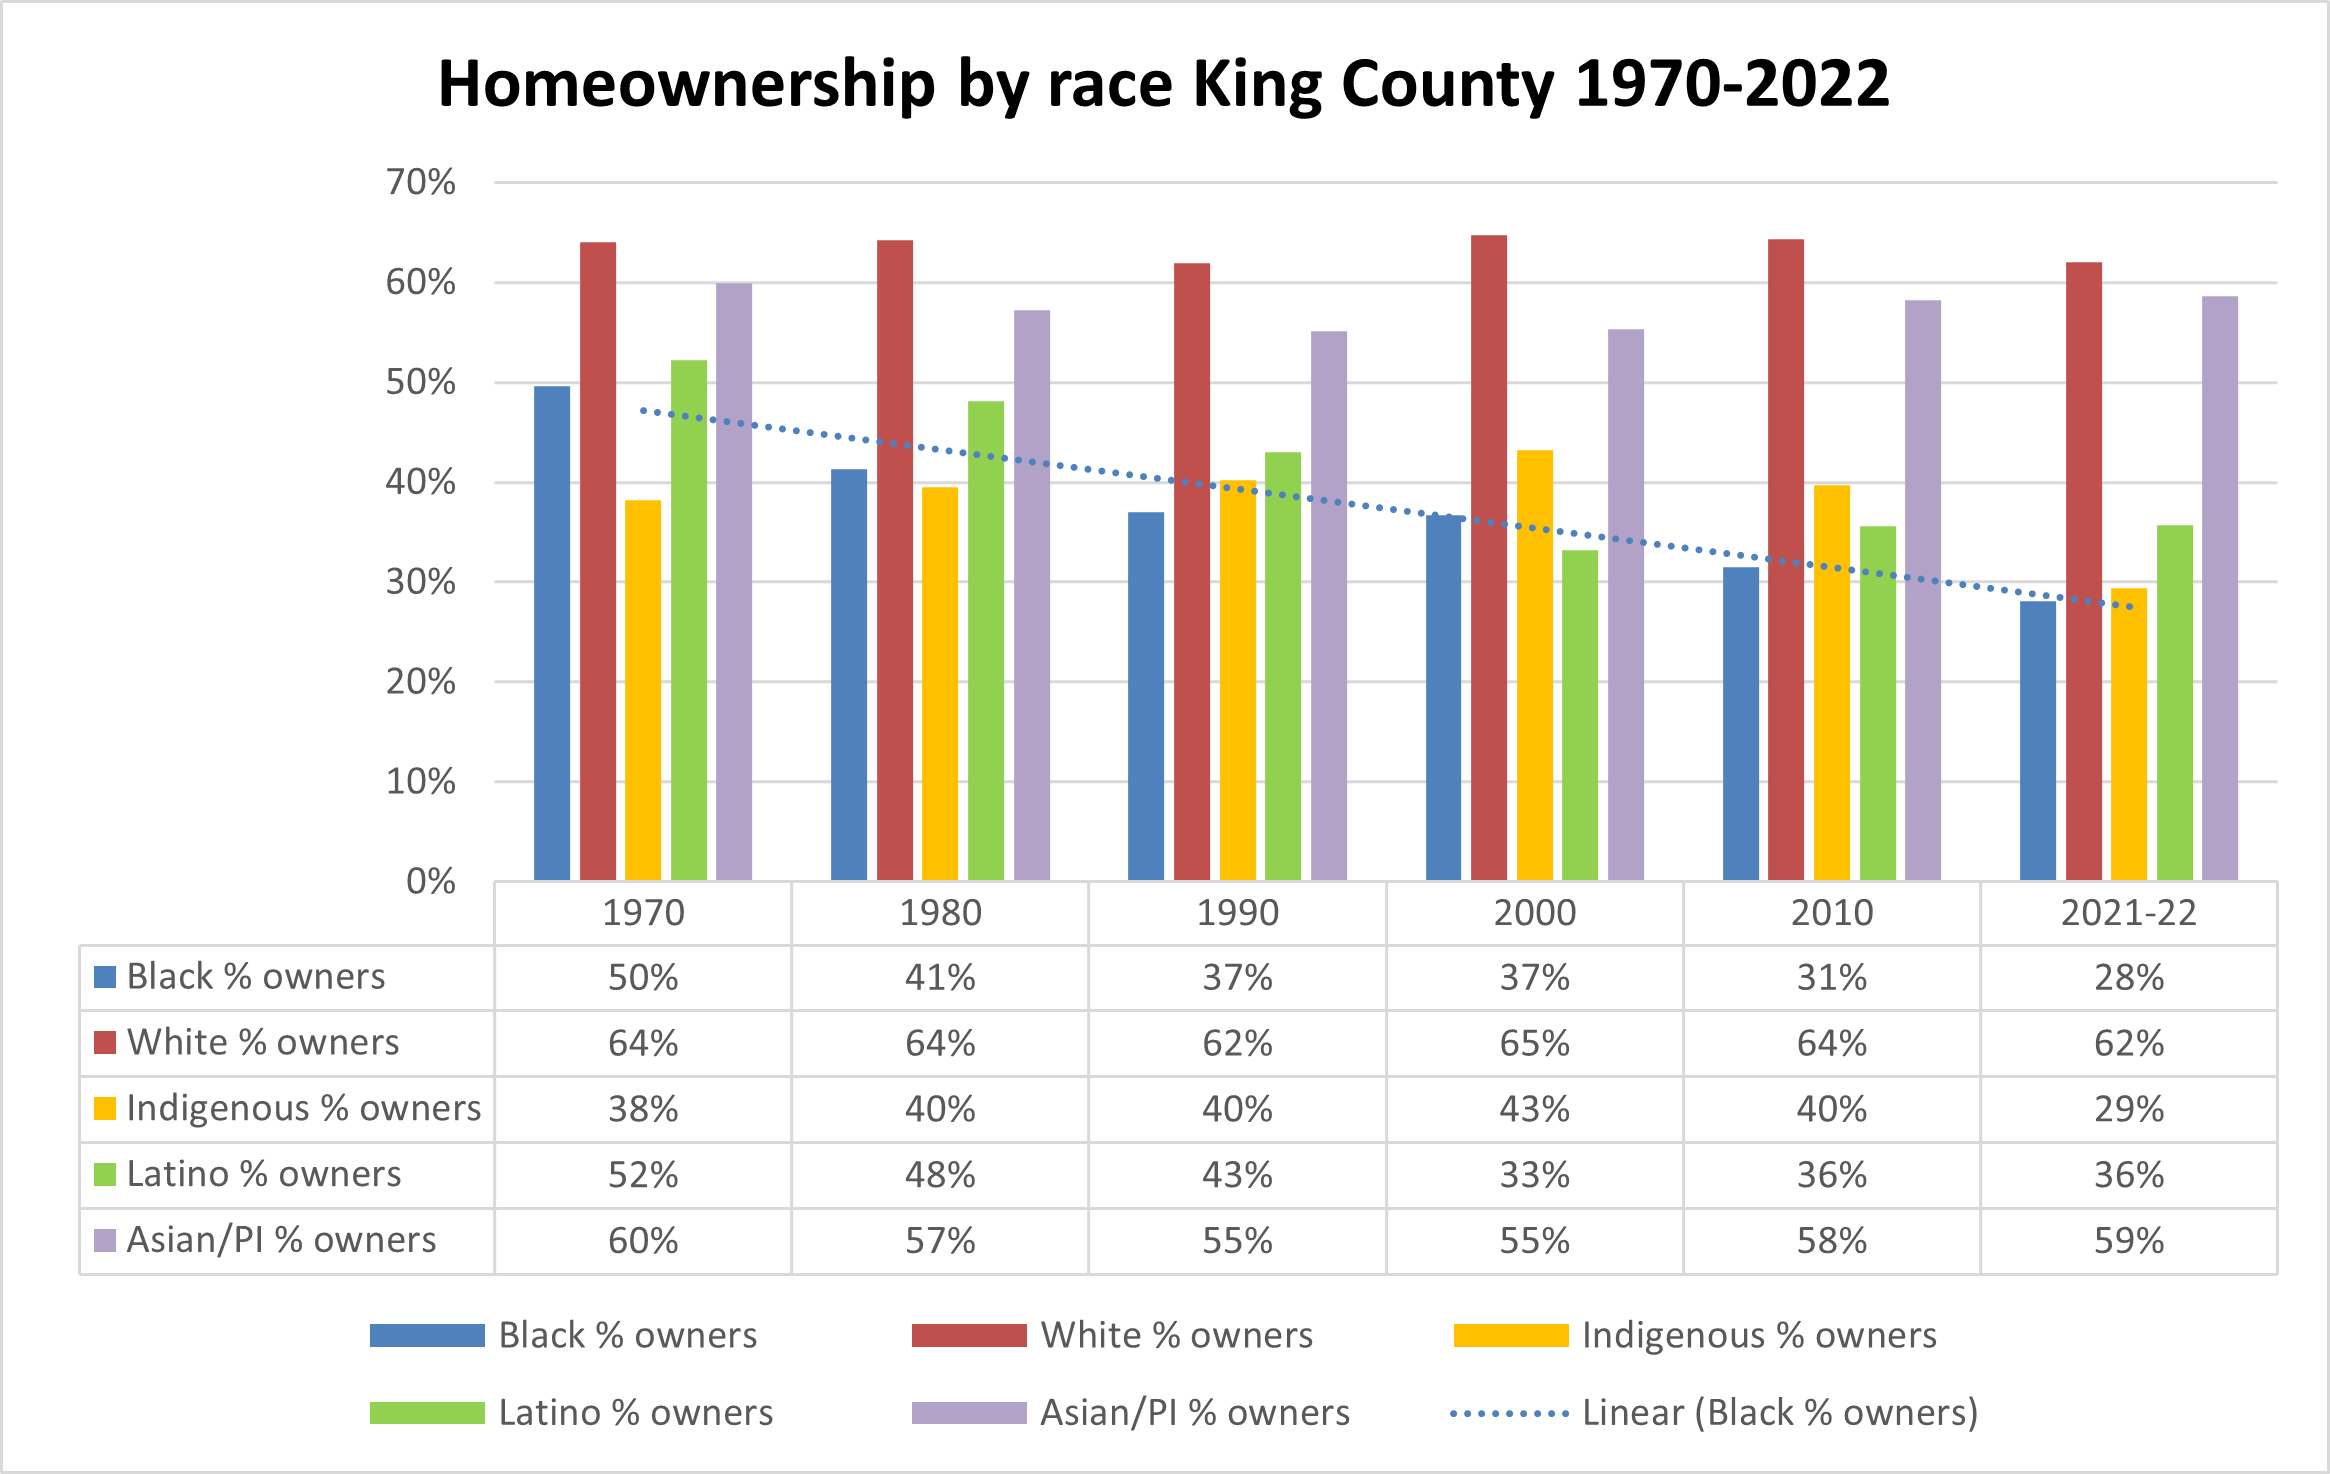
Homeownership in King County is locked in an alarming racialized pattern. While most White families are able to own homes, most Black, Latino, and Indigenous families are not. In the most recent census reports, 62% of White families are homeowners compared to only 28% of Black families. This is one of the lowest rates of Black homeownership in the country, far below the national rate (44%) and lower than other high priced cities (WashDC, New York, Los Angeles, San Francisco). Ownership rates for Latino and Indigenous households are not much higher. The charts below tell the alarming story. Fifty years ago, in 1970, 50% of Black families owned homes. Since then, ownership rates have fallen decade after decade.
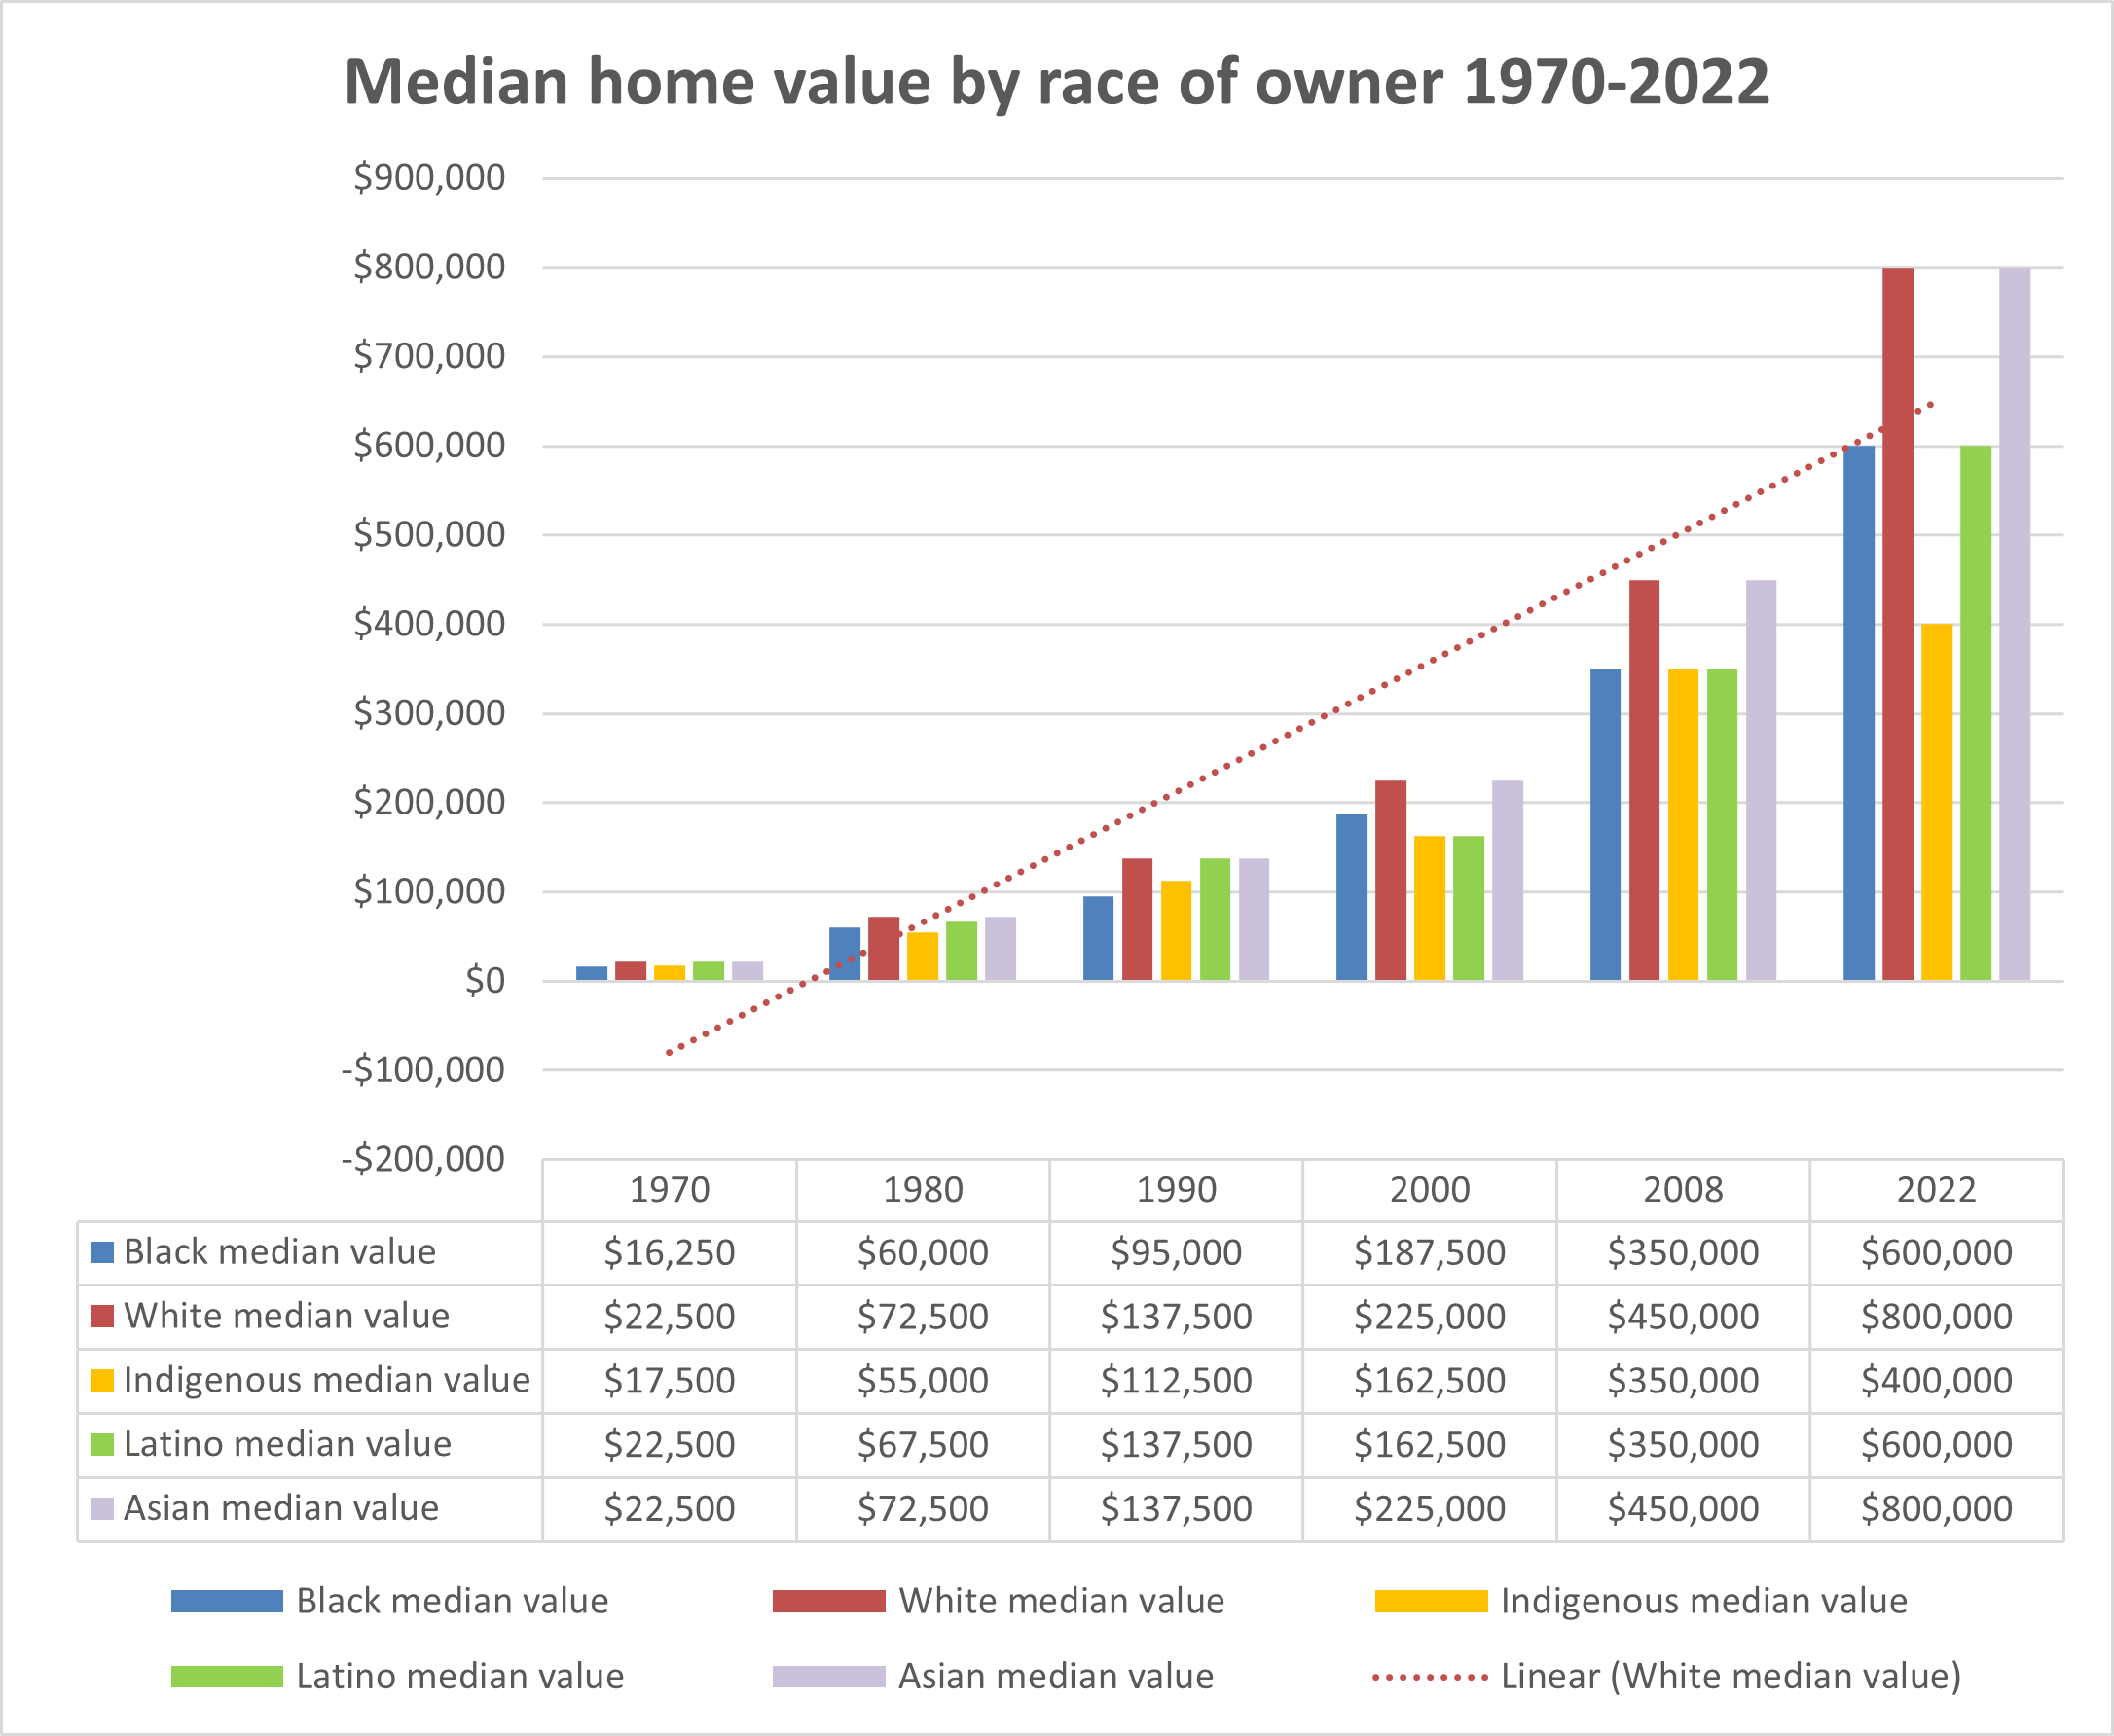
The disparate rate of homeownership is only part of the problem. The homes owned by Black, Indigenous, and Latino families in King County tend to be worth less than those owned by Whites. In the 2022 census ACS report, the small number of Black and Latino families able to purchase a home owned property whose median value was just 75% of the $800,000 median value of White-owned homes. This value disparity is not new. Since 1960 Black-owned homes have always been worth much less than homes owned by Whites.
That fact helps explain the declining ownership rates of Black families. The following chart shows the exponential increase in property values since 1970. That year, the high point for Black homeownership, Black-owned homes were worth 72% of White-owned homes. Think about what that meant for families who had been locked out of the housing market. In 2022, the median home in King County was valued at more than 35 times as much as in 1970 ($790,000/$22,500 = 3511%). This far exceeded overall inflation and the rate of increase in family incomes in the county (927%). A family selling a full-valued home could take advantage of this rocketing market, exchanging one house for another or dispersing housing assets through inheritance. But a family trying to buy for the first time in the post-covenant-restriction decades (and those selling undervalued homes) needed much higher incomes to buy property.
Since then, and especially since the 1990s, home buying has required different resources than it did in the golden age of mass homeownership after World War II (1946-1970) when Federal Housing Authority (FHA) assistance helped most White families become homeowners. Buyers have needed wealth to get started; wealth in the form of inheritance or high-paying jobs. Highly paid business-class and professional-class migrants from California, New York, and across the Pacific have been able to join this pricey housing market, while those with modest incomes and without family property wealth have lost out.
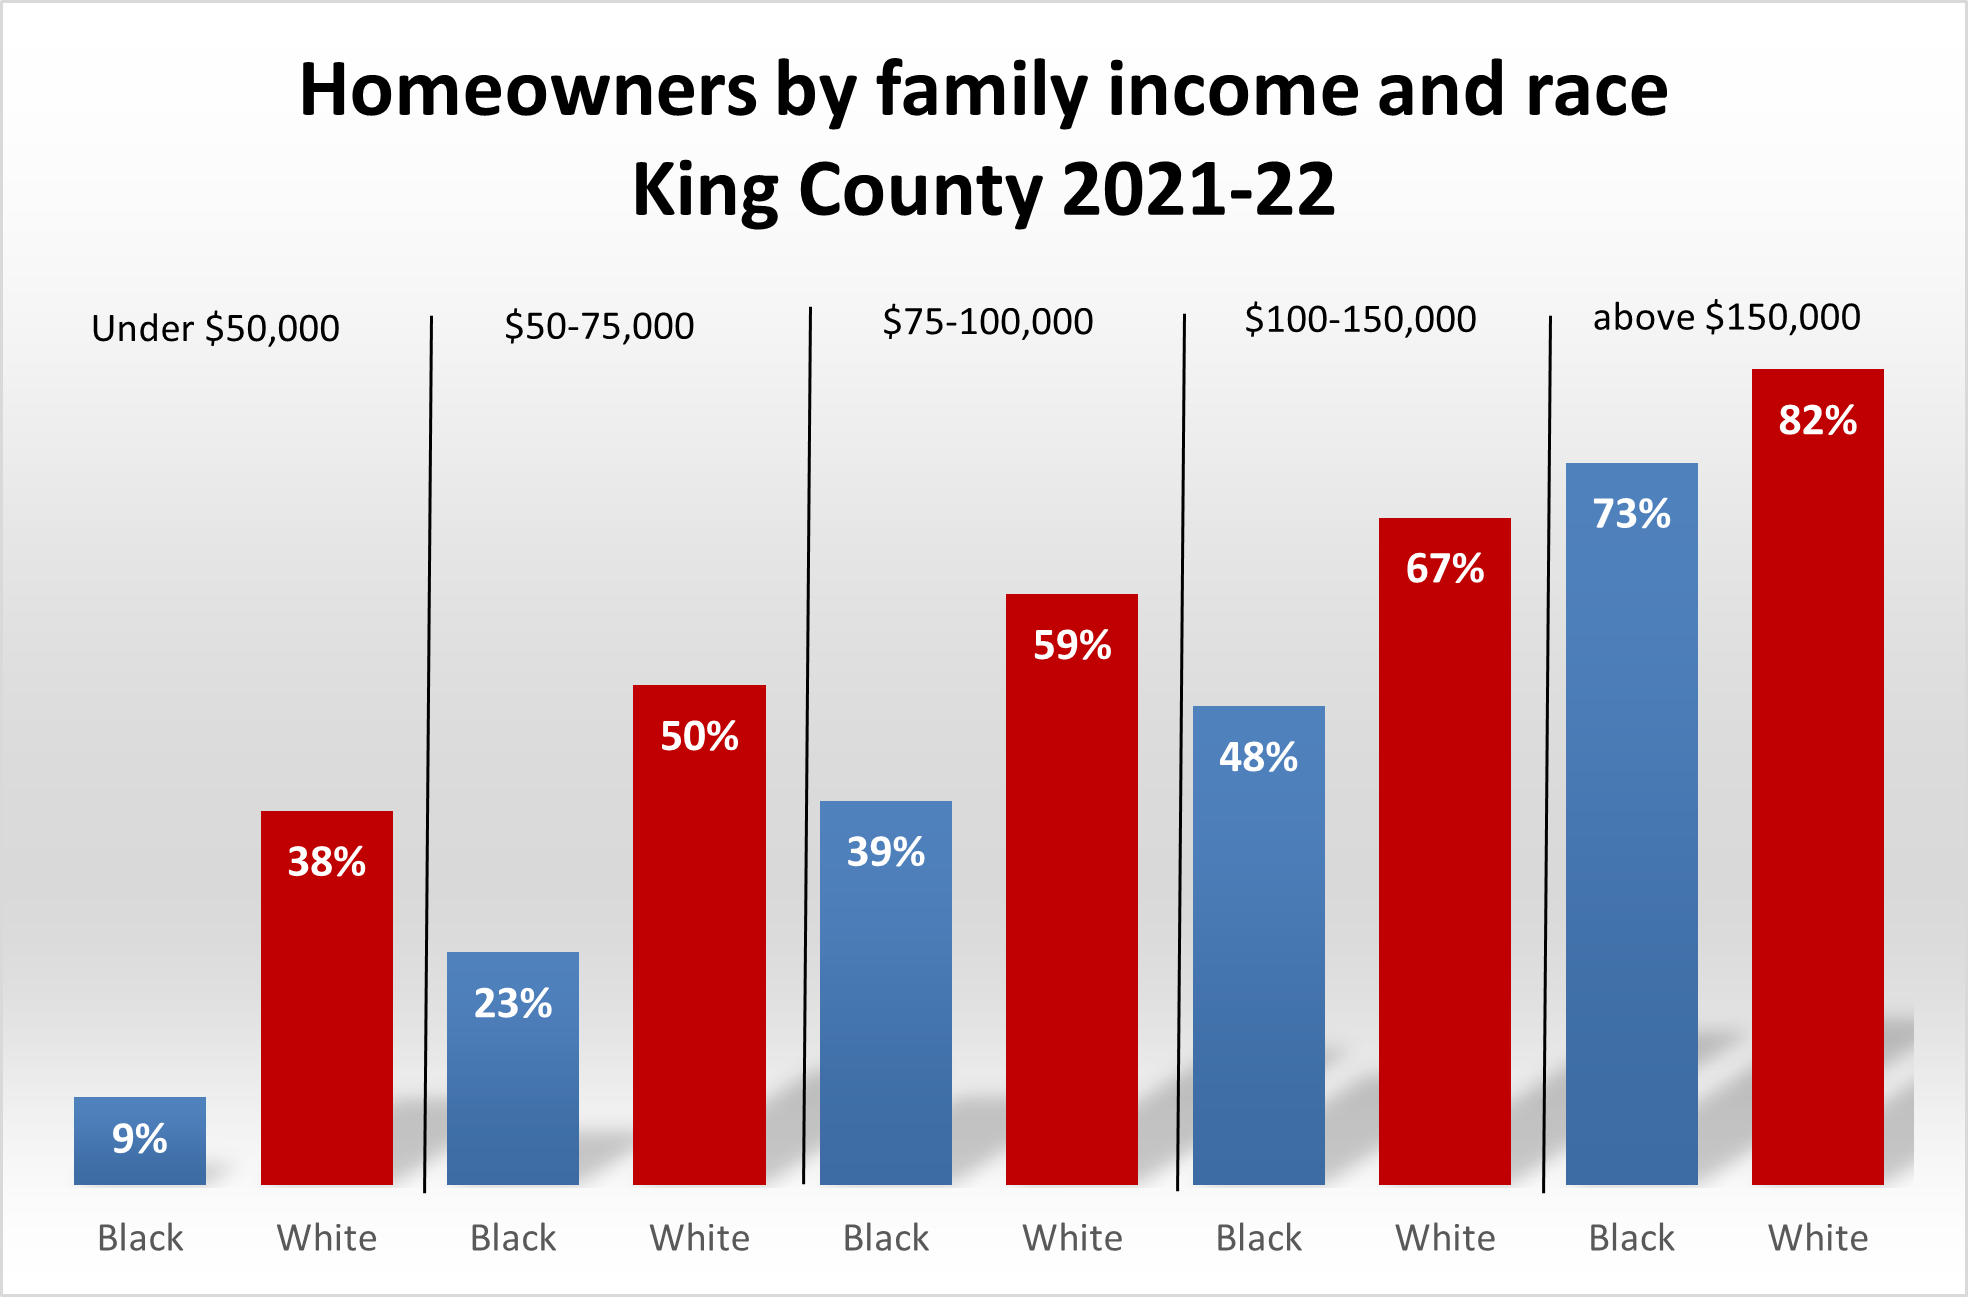
The enormous disadvantage that Black families face in King County is made clearer when we consider income. At every income level, White families are more likely to own homes than Black families. The chart below shows ownership rates in 2022 census ACS counts. Among families earning more than $100-150,000 annually, 67% of Whites were homeowners compared with 48% of Blacks. The gap grew starker at more modest family income levels. For those earning between $50,000 and $75,000 in 2018, 50% of Whites were owners compared with only 23% of Blacks. And look at the difference among those earning less than $50,000. White families were four times more likely to be homeowners than Black families. Remarkably, 38% of White families at this modest income level were able to own homes. Here we see the effects of multigeneration wealth building. At current prices new buyers with modest incomes are shut out of homeownership unless they are converting homes long held in the family or other sources of wealth.
Homes in these calculations include condos as well as houses and ownership can mean buying with a mortgage or owning outright (which is most likely for White homeowners). Home values are not the same as assessed or market values. The Census Bureau asks about home values and families answer this question with little guidance.
The most recent years shown here average the 2021 and 2022 Census bureau American Community Surveys (ACS) which are each 1% samples. The other decades involve 5% samples. Because these are samples, the estimates reported for small populations may not be accurate. This would apply to Latinos before 1990 and the Indigenous population in all decades.
Race categories in these calculations treat Latino as an exclusive category. Thus the labels Black, White, Indigenous, and Asian do not include anyone who indicated Hispanic/Latino heritage. The category Asian, always complicated, includes Pacific Islanders, South Asians, and East Asians. These charts do not include persons who answered with two or more race categories. Only in recent census surveys was this an option and in this six decade report and charts, we were not able to include them.
Sources: These statistics are calculated from weighted samples of U.S. Census data produced by the Minnesota Population Center's IPUMS USA: Steven Ruggles, Sarah Flood, Ronald Goeken, Megan Schouweiler and Matthew Sobek. IPUMS USA: Version 12.0 [dataset]. Minneapolis, MN: IPUMS, 2022. https://doi.org/10.18128/D010.V12.0. The following samples: 1960 5%, 1970 1% Metro FM1, 1980 5% State, 1990 5% State, 2000 1%, 2006-2010 ACS 5yr, 2016-2020 ACS 5yr.