Restrictive covenants were one of the reasons that across many generations people of color found it difficult to live in Thurston County. In 1970, the census counted only 207 Black residents. Asians numbered only 620, while 582 Indigenous Americans remained on or near the county's two reservations. Overall, the county population was 98.2% white. These numbers speak to something other than racial segregation. Exclusion was the issue. And its history plays out today in homeownership rates, family wealth, and other effects of exclusion and inequality.
The links below lead to four resources featuring different kinds of maps, lists, and information showing the neighborhoods impacted by racial restrictive covenants and the history of segregation and exclusion.
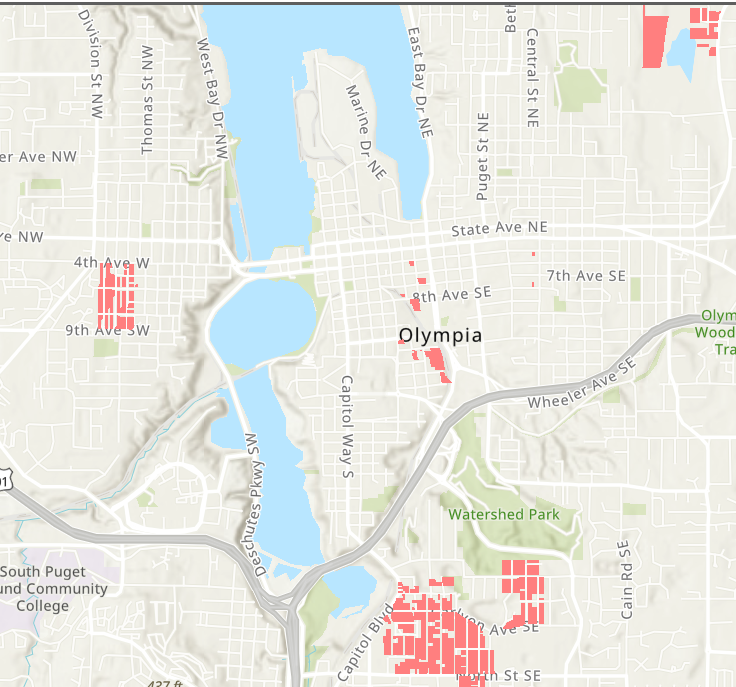
1,700 plus restricted parcels
This interactive map shows the location of properties that carried racial and sometimes religious restrictions. Zoom to see addresses and restriction language.

Olympia's History of Racial Exclusion, Segregation, and Housing
This report details the history of racial exclusion in Olympia and Thurston County.

Homeownership by race
1980-2022
Home ownership rates for families of color have improved in recent decades. While rougly 70% of white households have consistently owned their homes, Asian Americans have recently caught up, and Black homeownership rates have improved from 41% in 1980 to 58% in 2022.
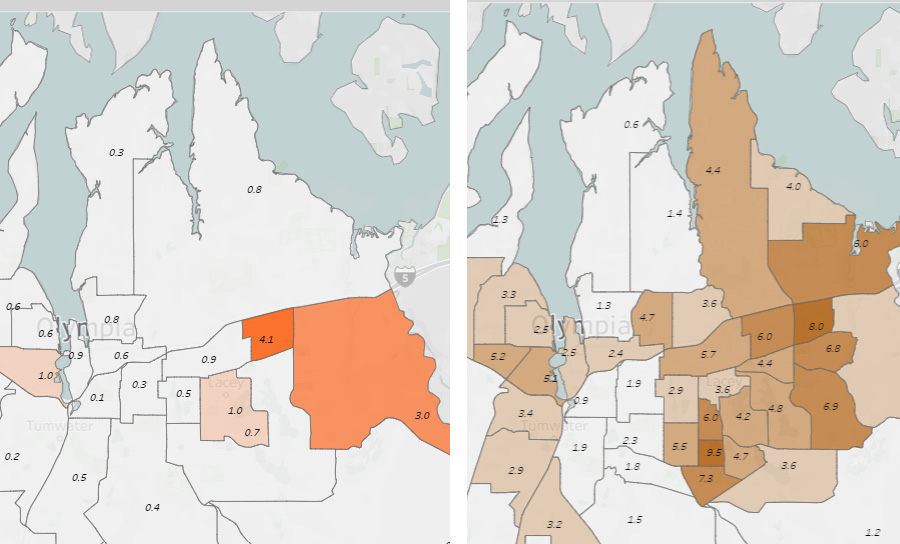
Race and segregation maps
1980-2020
Here we map the neighborhood-by-neighborhood distributions of African Americans, Asian Americans, Indigenous Americans, Latinos, and Whites across four decades.

Restriction data and documents
Downloadable documents for 35 subdivisons with known restrictions. Scroll the list, read the language of restrictions, learn the names of the developers.