Health
and Income Equity
A. Overviews,
reviews
|
Kawachi I, Levine S, Miller M, Lasch K, Amick III B. Income inequality and life expectancy - theory, research, and policy. Society and Health Working Paper Series No. 94-2; Boston: Harvard School of Public Health, 1994. Income Inequality and Life
Expectancy
Prepared by the Inequality Sub-Group* of the Society and Health Working Group. *Ichiro Kawachi
(Dept of Health and Social Behavior, Harvard School of Public Health),
Sol Levine (The Health Institute, New England Medical Center and Dept of
Health and Social Behavior, Harvard School of Public Health), S. Michael
Miller (Commonwealth Institute), Kathryn Lasch (Division of Health Improvement,
New England Medical Center), and Benjamin Amick III (Division of Health
Improvement, New England Medical Center).
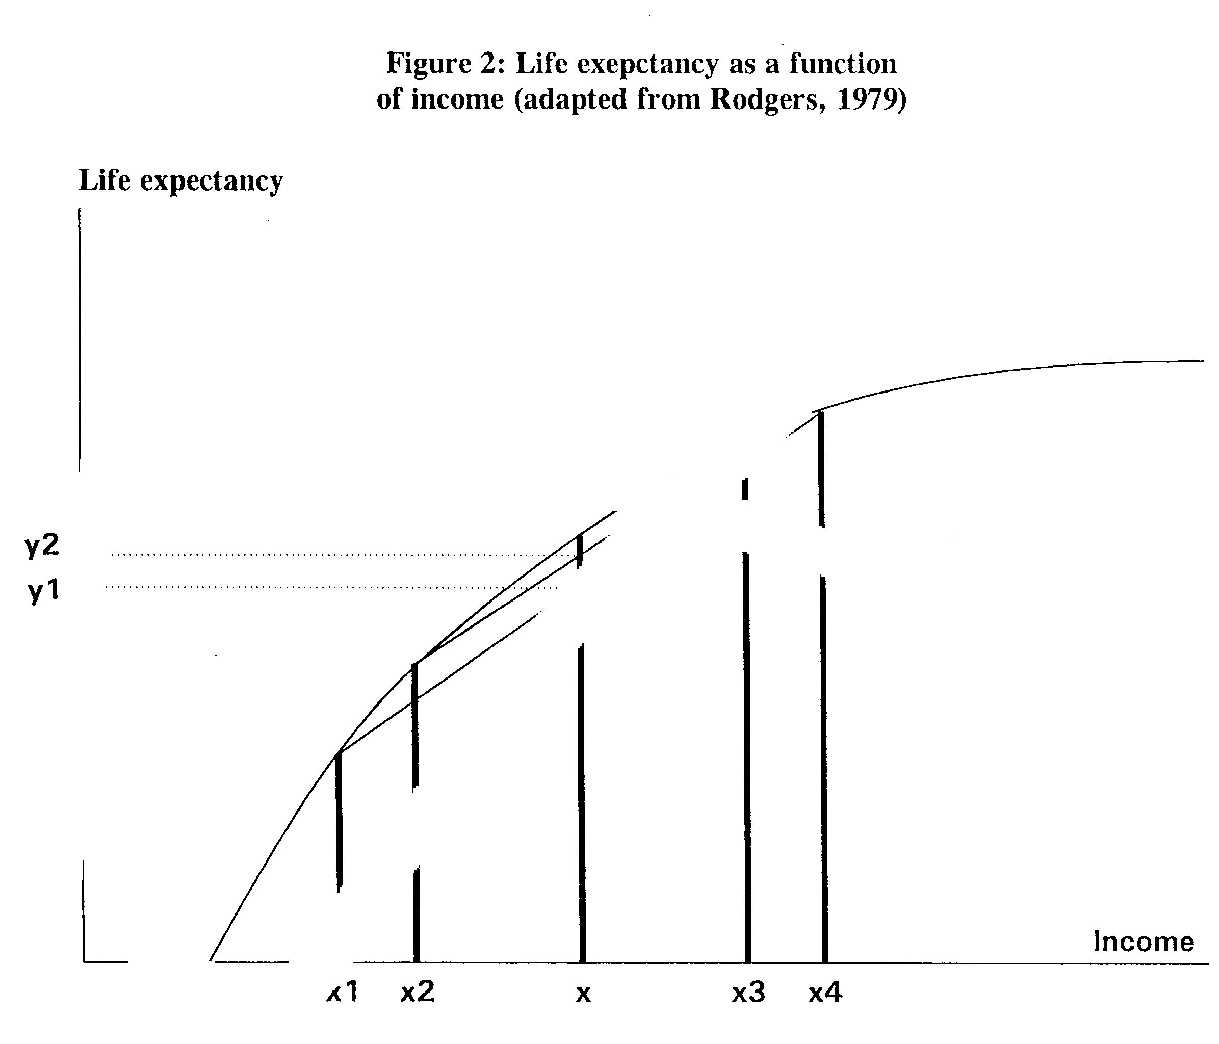
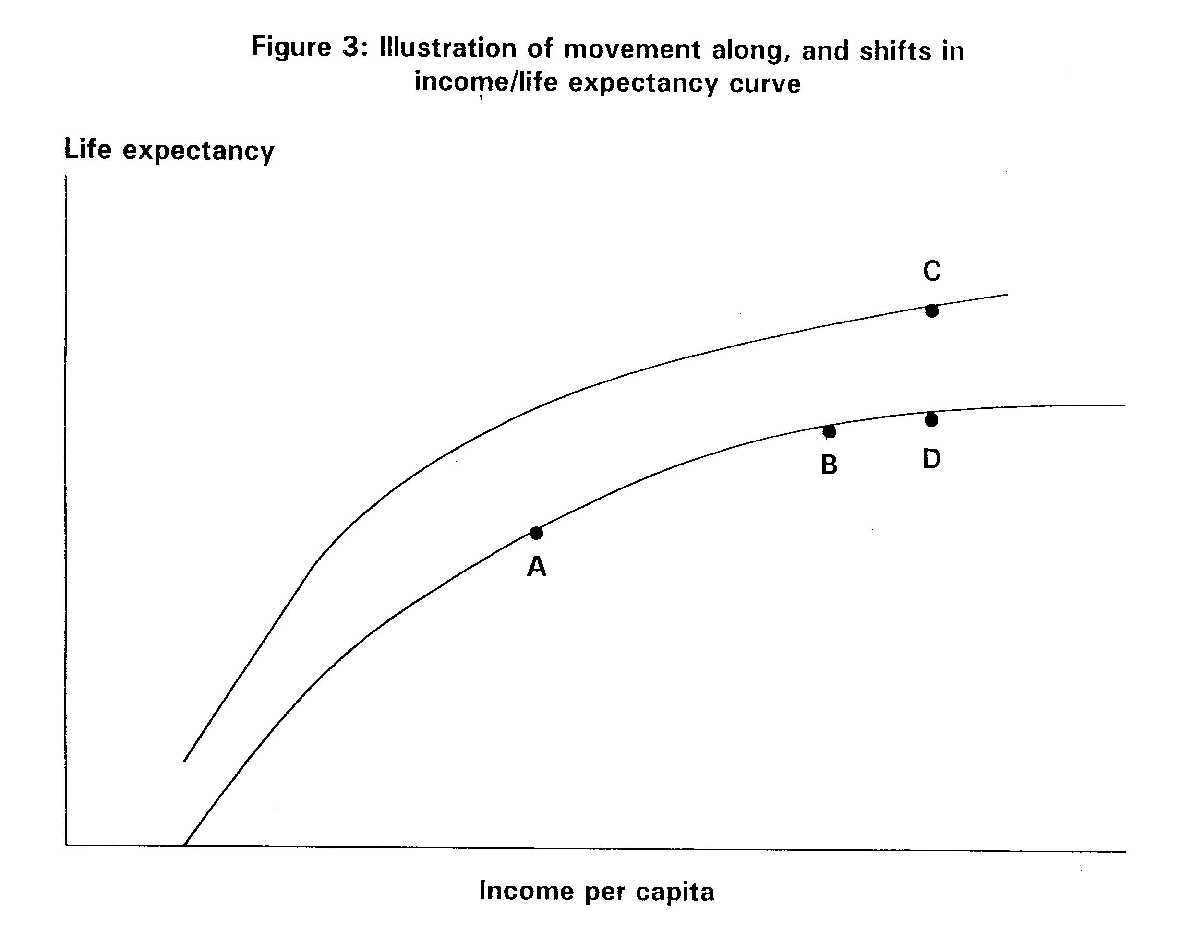
I. THEORY AND RESEARCH Social inequalities in health - statement of the problem. The relationship between socioeconomic status (SES) and health is pervasive, widespread, and persistent over time. Whether SES is measured by income, education, or occupation, much the same picture emerges: those at the bottom generally have the highest rates of death and disease (Dutton and Levine, 1989). This relationship has been replicated within different countries, using virtually every measure of health outcome, including morbidity, mortality, and perceived health status. One apparent inconsistency in the data, however, still deserves closer attention, viz., the fact that mortality rates are strongly related to income differences within developed countries, yet there is little relationship across developed countries in mortality rates and national income levels (Wilkinson, 1992b). This poses something of a paradox, since in epidemiology we expect most "risk factors" to operate similarly within as well as between different populations. For example, serum cholesterol levels are related to risk of coronary heart disease both within and across different countries (Keys, 1980). The international evidence on income and mortality is further complicated by the observation that among less developed countries (LDCs), there appears to be a strong relationship between higher per capita income and lower mortality rates. This relationship holds until countries reach a threshold level of absolute income of around $4000 to $5000 (1984 US dollars) per capita, after which further increases in GNP have much less impact on mortality rates (Preston, 1976). The purpose of this discussion paper is to develop a general theory of income distribution and life expectancy that attempts to accommodate some of these disparate observations. The purposely narrow focus of this paper is not intended to imply that the problem of SES inequalities in health can be reduced to consideration of just the two variables of income and life expectancy (or mortality). In synthesizing the international evidence, these variables merely happened to provide a common metric for comparison. We are in agreement with Dreze and Sen (1989) that the ultimate objective of public action should be to enhance the quality of life - or the capability of people to undertake valuable and valued "doings and beings" - rather than merely to prolong life, or to raise monetary incomes or wealth. The relationship between income and mortality We begin to construct our theory of inequality by examining the basic, empirically-observed relationship between income level and life expectancy. Virtually without exception, every study of socioeconomic status (SES) and health has concluded that as we descend the income (or education, or occupation) hierarchy, rates of ill health increase (Figure 1, from Pappas et al, 1993). Different authors have, however, interpreted this relationship in different ways, often with profoundly different implications for public policy. One approach to social inequalities in health is to view it as a problem of those at the very bottom of the income scale, i.e., the poor. We shall label this the "poverty perspective", or the "absolute deprivation hypothesis". According to this view, the solution to the problem of SES inequalities in health consists of eliminating poverty. Strategies to alleviate the effects of poverty include ensuring access to material goods and services - through income support, food stamps and housing vouchers - as well as access to medical care. The problem with such an approach, as cogently argued by Michael Katz (1989), is that it tends to lead to victim-blaming, with policies that start out as a war on poverty ending up as a war on welfare. The poverty perspective is thus the social policy equivalent of the "high risk" strategy of prevention, as described by Geoffrey Rose (1992) in public health. An alternative interpretation of the curve in Figure 1 emphasizes the gradient between rising incomes and falling mortality. This approach asserts that the mortality disadvantage is not confined to the poor, but is present at every level of income such that persons in the upper middle class are at higher risk than those at the very top of the scale (Haan et al, 1989). The policy implication of this approach - which we shall term the "relative deprivation", or the "gradient" perspective - is that SES inequalities are unlikely to be eliminated simply by abolishing poverty. There are plenty of empirical data to support the assertions of both the "poverty" and the "gradient" perspectives.1 Yet one aspect of the income/mortality relationship that has not received close attention is the finding that the curve is often asymptotic, i.e., there appears to be a ceiling level of income beyond which additional increases have little or no further effect on falling mortality (Rodgers, 1979; Preston 1976; Murray and Chen, 1993). This phenomenon - depicted as an income/life expectancy curve - is illustrated in figure 2 (adapted from Rodgers, 1979). The slope of the curve declines with increasing income, i.e., there are diminishing returns to rising income. This characteristic nonlinear relationship appears to hold true not only for international data on income and life expectancy (Murray and Chen, 1993), but also for within-country comparisons. For example, in the Matched Records Study (Kitagawa and Hauser, 1973), differences in mortality rates were slight among members of families whose incomes were $4,000 or more, but increased sharply among families earning less than $4,000 per year (in 1959 dollars). Pappas et al (1993) used 1986 data to repeat the Matched Records Study, and found that non-linear income/mortality relationships persisted for all population categories examined (Figure 1). In Figure 1, persons earning incomes below the 10th to 20th percentile of the population experienced dramatically higher mortality rates compared to the rest of the population. Similarly, data from the 1970 New Earnings Survey in Britain indicated that at lower levels of income, death rates were high, but that the curve fell rapidly as incomes increased before levelling out to become almost horizontal at higher income levels. Wilkinson (1986) estimated that for every pound (£) of income transferred from people earning £60-70 per week to people earning £10-20, death rates of recipients would be reduced by five times as much as it increased those of the donors. The asymptotic curve is not restricted to the relationship between income and life expectancy/mortality. Similar curves appear to characterize the relationships between income and a range of other health-related outcomes, including disease/disability and self-reported health status. For example, in their analysis of the American' Changing Lives interview survey, House et al (1990; 1992) found that differences in self-reported health status (defined by chronic conditions, functional status, and limitations of daily activities) were slight at successive increments of income above $20,000 per year; but subjects with incomes of less than $20,000 reported markedly worse health than those with higher incomes. Implications of the income/life expectancy curve The implications of the curve shown in figure 2 are three-fold:2 first, the steep portion of the curve explains the persistently observed association between poverty and life expectancy - both within and across countries (the absolute deprivation perspective). However, as the level of income rises, the effect on life expectancy declines. The shape of this portion of the curve helps to resolve one of the inconsistencies stated at the outset of this paper, viz., the strong association between per capita income and life expectancy in less-developed countries (LDCs), but the weakness or absence of such an association in developed countries (Rodgers, 1979; LeGrand, 1987; Preston, 1976; Wilkinson, 1992b). A second implication of the curvature in the income/life expectancy relationship is that the distribution of income must influence the average life expectancy of a country. The tendency for greater dispersion of income to be associated with lower mean life expectancy can be confirmed by considering a population with mean income x in figure 2. If the income dispersion is between x1 and x4, mean life expectancy in this population is y1. If income dispersion in this population is now reduced, by raising x1 to x2 and reducing x4 to x3, then ceteris paribus, mean life expectancy in this population would be raised to y2. In other words, if two countries have the same mean income but different income distributions, the country with the more equitable income distribution would experience a higher average life expectancy than the country with less equitable income distribution. This prediction is the consequence of the downwardly concave relation between income and life expectancy, i.e., redistribution of income would raise the life expectancy of the poor by more than the amount of reduction experienced by the rich. The greater the spread, the larger the net loss suffered by people below the mean income. The algebraic proof of this result can be found in Rodgers (1979). The third implication of the income/life expectancy curve is that both movements along the curve and shifts in the entire curve are possible. For example, as a less-developed country prospered, the curve (figure 3) would predict gains in life expectancy (i.e., a movement along the curve from A to B). With further increases in living standards, however, the country should experience diminishing returns to life expectancy as it entered the plateau portion of the curve (Gwatkin, 1980). Recent data, however, have found little evidence for a slowdown or plateauing of life expectancy (Murray and Chen, 1993). Why, then, has the prediction of Gwatkin (1980) concerning the "end of an era of steep mortality declines" failed to occur? A likely explanation is that shifts occur in the income/life expectancy relationship. An upward shift in the curve, for example, enables a country to experience a higher level of life expectancy for the same level of income (moving from B to C in figure 3, instead of from B to D). Preston (1979) used the term "exogenous" to describe factors that caused shifts in the income/life expectancy curve. Examples of exogenous factors include the introduction of modern health technology and public health campaigns, as well as cultural and behavioral factors. For example, major accelerations in mortality decline in some LDCs have been attributed to the success of malaria control, as well as the dissemination of child survival technologies such as oral rehydration therapy and basic immunizations for tetanus and measles (Murray and Chen, 1993). Caldwell (1986) examined the cultural/behavioral factors responsible for "breakthrough" declines in mortality in three LDCs: Costa Rica, Kerala and Sri Lanka. The unusually low mortality in these countries was attributed to social/cultural factors including: the autonomy accorded to women; a strong public investment in health and education; highly accessible health services; egalitarian distribution of food including policies guaranteeing a minimum nutritional floor; universal immunization; and widespread antenatal and postnatal medical care (Caldwell, 1986). In summary, three broad factors determine the life expectancy and mortality rates of a population: the absolute level of income (the poverty/absolute deprivation perspective); the distribution of income (the relative deprivation perspective); and so-called exogenous factors that lead to shifts in the income/mortality curve. The causes of shifts in income/mortality curves Preston (1975; 1979) examined the relationship between life expectancy (male and female, averaged) and per capita national income (in 1963 U.S. dollars) for over 40 countries in the 1900's, 1930's, and 1960's, and concluded that the income/life expectancy curve had indeed shifted upward during the twentieth century. A striking conclusion reached by Preston (1979) was that factors exogenous to a country's current level of income accounted for 75-90% of the growth in life expectancy for the world as a whole between the 1930's and 1960's. Income growth per se accounted for the remaining 10-25%. Preston noted that it was not inconsistent to claim on the one hand that income has been a trivial factor in recent mortality trends, and on the other that it is still a critical determinant of mortality levels - it just depends upon what portion of the curve one is looking at. One other phenomenon noted by Preston was that, in less-developed countries, a given increment in income was associated with a larger gain in life expectancy in the 1960's than in the 1930's. A potential explanation for this phenomenon may be a country's accumulating health "assets" over time (Murray and Chen, 1993). The health "stock" of a nation includes physical assets, such as the infrastructure of the health care system (hospitals, clinics, equipment), schools, transportation, housing, water supply, sanitation; as well as social assets, including broad-based literacy, education, enhanced status of women, and political stability (Murray and Chen, 1993). Nations which succeed in building up such assets over time are more likely to, and more effectively able to translate a given expenditure for health into life expectancy gains. The most provocative hypothesis that Preston (1979) put forward, but was unable to examine, was that departures from the predicted income/life expectancy relationship were attributable to differences in the distribution of national incomes. Preston noted that three countries widely cited for large income disparities - Mexico, Venezuela, and Colombia - also had the largest negative deviations from the curve. Actual life expectancy in these three countries fell short of predicted life expectancy (based on average national income) by 6.7, 4.8 and 2.1 years, respectively. In the following section, we review the international evidence on income distribution and mortality/life expectancy. Empirical evidence for the income distribution/life expectancy relationship Rodgers (1979) examined cross-sectional data from 56 countries to test the relationship between absolute income, the distribution of income as measured by the Gini coefficient (see Appendix for definition), and three measures of health - life expectancy at birth, life expectancy at fifth birthday, and infant mortality. Both absolute income and income distribution were highly predictive of life expectancy at birth, with R2 over 0.75. The R2 were somewhat weaker for life expectancy at age 5 and infant mortality, nonetheless the income distribution variable remained consistently significant. Rodgers (1979) concluded that the difference in average life expectancy between a relatively egalitarian and a relatively inegalitarian country amounted to as much as 5 to 10 years. In a series of studies, Wilkinson (1986; 1990; 1992) has demonstrated the importance of income distribution as a determinant of population-level mortality. In a study of 11 OECD countries, a strong inverse correlation (r = -0.81, p < 0.001) was found between income inequality - as measured by Gini coefficients of post-tax income standardized for differences in household size - and life expectancy (Wilkinson, 1986). Similarly, a close correlation (r = 0.86, p < 0.001) was found between the life expectancy of 9 OECD countries and the proportion of income going to the least well off 70% of the population (Wilkinson, 1992). Regressing life expectancy on GNP per capita and the proportion of income going to everyone below the 70th percentile in each country produced a correlation coefficient of 0.90 and an adjusted R2 suggesting that three-quarters of the variation in life expectancy was explained by these two variables alone. By contrast, GNP per capita by itself explained less than 10% of the variance in life expectancy in the nine countries examined (Wilkinson, 1992). Finally, Wilkinson (1990) reported that between 8 to 15 percent of the changes in occupational mortality among men and women in Britain between 1971-81 were attributable to changes in the proportion of people in each occupation earning less than 60% of average workforce earnings. LeGrand (1987) studied the relationship between average age-at-death for 17 developed countries, and GDP per capita, per capita expenditure on medical care, and the proportion of national income going to the least well off 20 percent of the population. Average age-at-death was found to be closely related to income distribution (p < 0.01), but not to GDP or medical expenditure per capita. Flegg (1982) examined predictors of infant mortality rates in 46 underdeveloped countries. A regression model that included just GDP per capita and Gini coefficient explained 55 percent of the variance in infant mortality rates between the countries. Both variables were highly statistically significant (p<0.01). Further addition of maternal illiteracy rates, and the number of nurses and physicians per 1,000 persons into the regression model increased the R2 by just 15 percent. The author examined the policy implications of a redistribution of incomes. In order to do this, the coefficient of variation (V) was adopted as the measure of income inequality. V measures the extent to which incomes diverge "on the average" from their mean. According to Flegg, a one percent decrease in V would reduce the infant mortality rate by 0.471 percent (95% confidence intervals 0.169-0.773 percent). In absolute terms, if the value of V for a hypothetical country were reduced from 1.2 (the geometric mean value for the 46 countries studied) to 0.7 - a figure characteristic of relatively egalitarian countries such as Bangladesh, Pakistan and Taiwan - then infant mortality was predicted to decline by 20 deaths per 1,000 live births. Conversely, an increase in V from 1.2 to 1.9 - a ratio representative of highly unequal countries such as Ecuador, Gabon an Kenya - would raise the number of deaths by 25 per 1,000 live births. Methodological critique One of the limitations of the above-cited studies is that data from different countries may not always be comparable in terms of quality or reliability. A more stringent test of the hypothesis that income distribution predicts mortality would be provided by collecting data from within a single country. An example of an analysis utilizing data from one country is the recent report by Merva and Fowles (1993) examining wage inequality and crime rates in 30 metropolitan areas in the United States. Using multivariate regression techniques, the authors reported that a five percent increase in wage inequality (measured by the Gini coefficient) between successive business cycle peaks in 1979 and 1988 was associated with the following increases in criminal activity: violent crime by 2.05 percent, murder/non-negligent manslaughter by 4.21 percent; robbery by 1.79 percent; aggravated assault by 3.10 percent; larceny/theft by 1.95 percent; and motor vehicle theft by 2.21 percent. It should be possible to extend such studies to include health outcomes, and to compare across the experiences of different communities or workplaces (see the next section for further elaboration of this idea). A second limitation of the existing data on income distribution and life expectancy is that they are cross-sectional rather than longitudinal. It is possible that high rates of disease might result in a higher proportion of the population being low income-earners, therefore leading to greater disparities in distribution of income (a variant of the "drift" hypothesis). A test of the drift hypothesis would be to conduct a longitudinal study of changes in income distribution against changes in life expectancy. Wilkinson (1992a) reported that from 1975 to 1985, the annual rates of change in the proportion of the population living on less than half the national average income in each of the 12 member countries of the European Community was closely correlated with the average rate of increase in life expectancy at birth (r = -0.73, P < 0.1). Although suggestive, these results are still cross-sectional, and the ultimate test of the hypothesis may only be provided by a randomized trial of income redistribution. On the other hand, there seems to be general agreement that the "drift" hypothesis explains only a minor part of SES inequalities in health (Townsend and Davidson, 1982; Fox et al, 1985). A third and final limitation of the studies linking income distribution to lifeexpectancy is that the data are ecological. This is perhaps unsurprising, since income distribution is a group characteristic, not an individual attribute. The major difficulty in interpreting ecological data is the lack of information necessary for the control of confounding (Morgenstern, 1982). A potential refinement of existing studies might therefore consist of examining the relationship between income distribution and health outcomes at the level of the individual (with complete ascertainment of confounding variables). We need a measure that somehow captures the individual's experience of inequality, or relative deprivation. This line of reasoning assumes that the pattern of income distribution at the societal level exerts a direct, and measurable effect on the individual such that their subsequent risks of morbidity or mortality are altered. An agenda for future research Studies at the level of communities If Wilkinson's hypothesis is correct that income distribution predicts a nation's level of health (1986; 1990; 1992), then the same association ought to be observable at the level of communities within a particular society. For example, Roseto, an Italian-American town in Pennsylvania has been widely cited as a case study of a community with strong egalitarian values that experienced less than half the coronary heart disease rates of neighboring towns, despite a comparable prevalence of CHD risk factors such as cigarette smoking, physical inactivity, diabetes, and hypertension (Bruhn and Wolf, 1979). Although investigators attributed the health of this community to its close-knit social ties, equally remarkable were the descriptions of the inhabitants' egalitarian values: "Proper behavior by those Rosetans who have achieved material wealth or occupational prestige requires attention to a delicate balance between ostentation and reserve, ambition and restraint, modesty and dignity... The local priest emphasized that when preoccupation with earning money exceeded the unmarked boundary it became a basis for social rejection ... Rosetan culture thus provided a set of checks and balances to ensure that neither success nor failure got out of hand... During the first five years of our study it was difficult to distinguish, on the basis of dress or behavior, the wealthy from the impecunious in Roseto. Living arrangements (houses and cars) were simple and strikingly similar. Despite the affluence of many, there was no atmosphere of "keeping up with the Joneses" in Roseto, no "putting on the dog" (Bruhn and Wolf, 1979). A decade or so into the study, the investigators noted that social taboos against the display of wealth appeared to weaken: "For many years the more affluent Rosetans restrained their inclination toward material indulgence and maintained in their town the image of a relatively classless society. When a few began to display their wealth, however, many others followed. By 1965 families had begun to join country clubs, drive expensive automobiles, take luxury cruises, and make flights to Las Vegas" (Bruhn and Wolf, 1979). Accompanying this breakdown in egalitarian values was a sharp rise in coronary heart disease rates (Egolf et al, 1992). Needless to say, many other factors could have equally accounted for the initially low CHD rates in Roseto - such as the strength of social ties in the community, or the consumption of a Mediterranean diet, and so on. The purpose of citing the Roseto example is to make the point that the field could benefit from further studies rooted at the community level - but incorporating a better set of measures. For instance, measures need to be developed that tap into an individual's perceptions and experience of inequality in that community. Studies at the level of workplaces The work environment is a particularly important source of inequality in people's daily lives. Marmot and Theorell (1988) proposed that social inequalities in CHD are produced partly through the unequal distribution of job conditions that lead to stress. Job stress (for example, as operationalized by the demands/control model) in turn is associated with raised blood pressure, high blood cholesterol, smoking, and other risk factors for coronary heart disease (Karasek and Theorell, 1990). Job conditions - like income - are unequally distributed in different work environments. We hypothesize that the maldistribution of work conditions (such as the degree of hierarchy in the workplace) is just as detrimental to health of workers as the absolute level of job stress. How can inequality in work conditions per se lead to stress and ill-health? This may occur if perceptions of autonomy/control are relative, i.e., if a worker lower in the hierarchy perceives that their manager has not much more autonomy/control than they, this may turn out to be less stressful than the existence of wide disparities in autonomy/control within the workplace. This is not to deny that levels of high stress per se are harmful to health (they are). Nonetheless, job stress models fall short of accounting for patterns of morbidity (e.g., coronary heart disease) among countries with different levels of job stress. For example, consideration of the absolute level of job stress by itself might lead to the erroneous prediction that the Japanese will experience a higher rate of coronary heart disease compared to Americans. In fact, what seems to characterize the Japanese workplace is the relatively equal distribution of control/autonomy within workplaces compared to countries such as the United States. For example, managers in Japan appear to be involved in much more sharing of autonomy and decision-making compared to their American counterparts, while Japanese blue-collar workers appear to have more autonomy/control (in the form of shop-floor democracy and other forms of worker participation). In a paper entitled "Why are the Japanese living longer?", Marmot and Davey Smith (1989) speculated that egalitarian work conditions in Japan were partly responsible for the low rate of coronary heart disease in that country: "Many of the superficial trappings of status are dispensed with in (Japanese) industry; the managers wear the same spotless overalls as the men and there is no executive dining room, although there is never any doubt about who is in charge, who should be deferred to, or who is earning the most". A more equal distribution of control in the workplace is exactly what Karasek and Theorell (1990) advocate in their vision of job redesign: "The inequitable distribution of creative opportunities and decision-making opportunities can partially be resolved by alternative decision structures within existing institutions, by changing responsibilities between occupational groups. The jobs of the professional and manager do not need job enrichment, job enlargement, or additional social interaction. ... Skill requirements are already so high that additional requirements to learn new skills may become a psychological demand rather than a coping opportunity. For those managers at the very highest levels of organization, the primary job demand is to make decisions, so additional decision opportunities are not likely to diminish stress. "Clearly many of these jobs are already so high on our job redesign scales that the appropriate health intervention might be to diminish their demands by reducing their decision latitude and social interactions rather than increasing them. This strategy would off-load some of the ever-increasing decision responsibilities and qualification requirements of those at the top of public and private bureaucracies to lower-level occupations such as our bureaucratized and commercialized service workers, and even the technicians and administrators. Such a policy could diminish the enormous disparities in decision-making opportunity between blue-collar and professional workers from both ends of the occupational spectrum, reducing overload decision demands at the top of the hierarchy and increasing decision opportunities and skill utilization at the bottom end. The result might be a health-promoting double-attack on psychosocial health risk at work." The hypothesis that a more equal distribution of demands/control would result in better health outcomes could be tested by either observational studies conducted within a workplace, or a experimental trial in which the intervention would consist of redesigning the workplace. The anomaly of centrally-planned economies If income distribution is so powerfully related to population mortality - as the foregoing evidence suggests - then the experience of Soviet bloc countries poses something of an anomaly. Preston (1979) noticed that, in spite of the supposedly narrower income dispersion in centrally planned economies (compared to other countries with equivalent average income levels), these nations did not have exceptionally high life expectancies. Life expectancies in these countries actually fell short of that predicted by income levels - by 0.2 years in the USSR; by 1.6 years in Yugoslavia; by 1.3 years in Poland; by 2.4 years in Hungary; by 0.8 years in East Germany; and by 0.5 years in Czechoslovakia (Preston, 1979). Subsequent to Preston's (1979) work, the myth of income equality in the former Soviet bloc countries has been exposed somewhat as a result of the release of reliable time series data on income distributions (Atkinson and Micklewright, 1992). Estimates of income disparities in the Soviet Union and Eastern Europe prior to their collapse indicate a striking similarity to the patterns in Western countries (Samuelson and Nordhaus, 1989). These wage differentials appear to have been the result of deliberate Communist state policies to encourage investment in human capital (e.g., provide incentives for the training of engineers and physicists); to attract workers into occupations with unpleasant conditions; and to move to industries selected for expansion of employment (Atkinson and Micklewright, 1992). A further source of economic inequalities in the former Soviet bloc countries appears to have been the privileges accorded to the political elite (the nomenklatura). The falling life expectancies in Eastern bloc countries during the 1980s (Mezentseva and Rimachevskaya, 1990; Wnuk-Lipinski and Illsley, 1990) thus turn out to be less of an anomaly for our theory when we consider that income inequality on these countries actually worsened during the same period. Summary of macro-level theory To summarize what we have said so far: A number of theories have been put forward to explain the SES gradient in health, among which is the hypothesis that income maldistribution per se is harmful to health (Wilkinson, 1992a). Based on the ubiquitously observed relationship between level of income and life expectancy (figure 2), we have outlined a theory that accommodates both the absolute deprivation (poverty) and relative deprivation (inequality) perspectives. Our theory helps to explain:
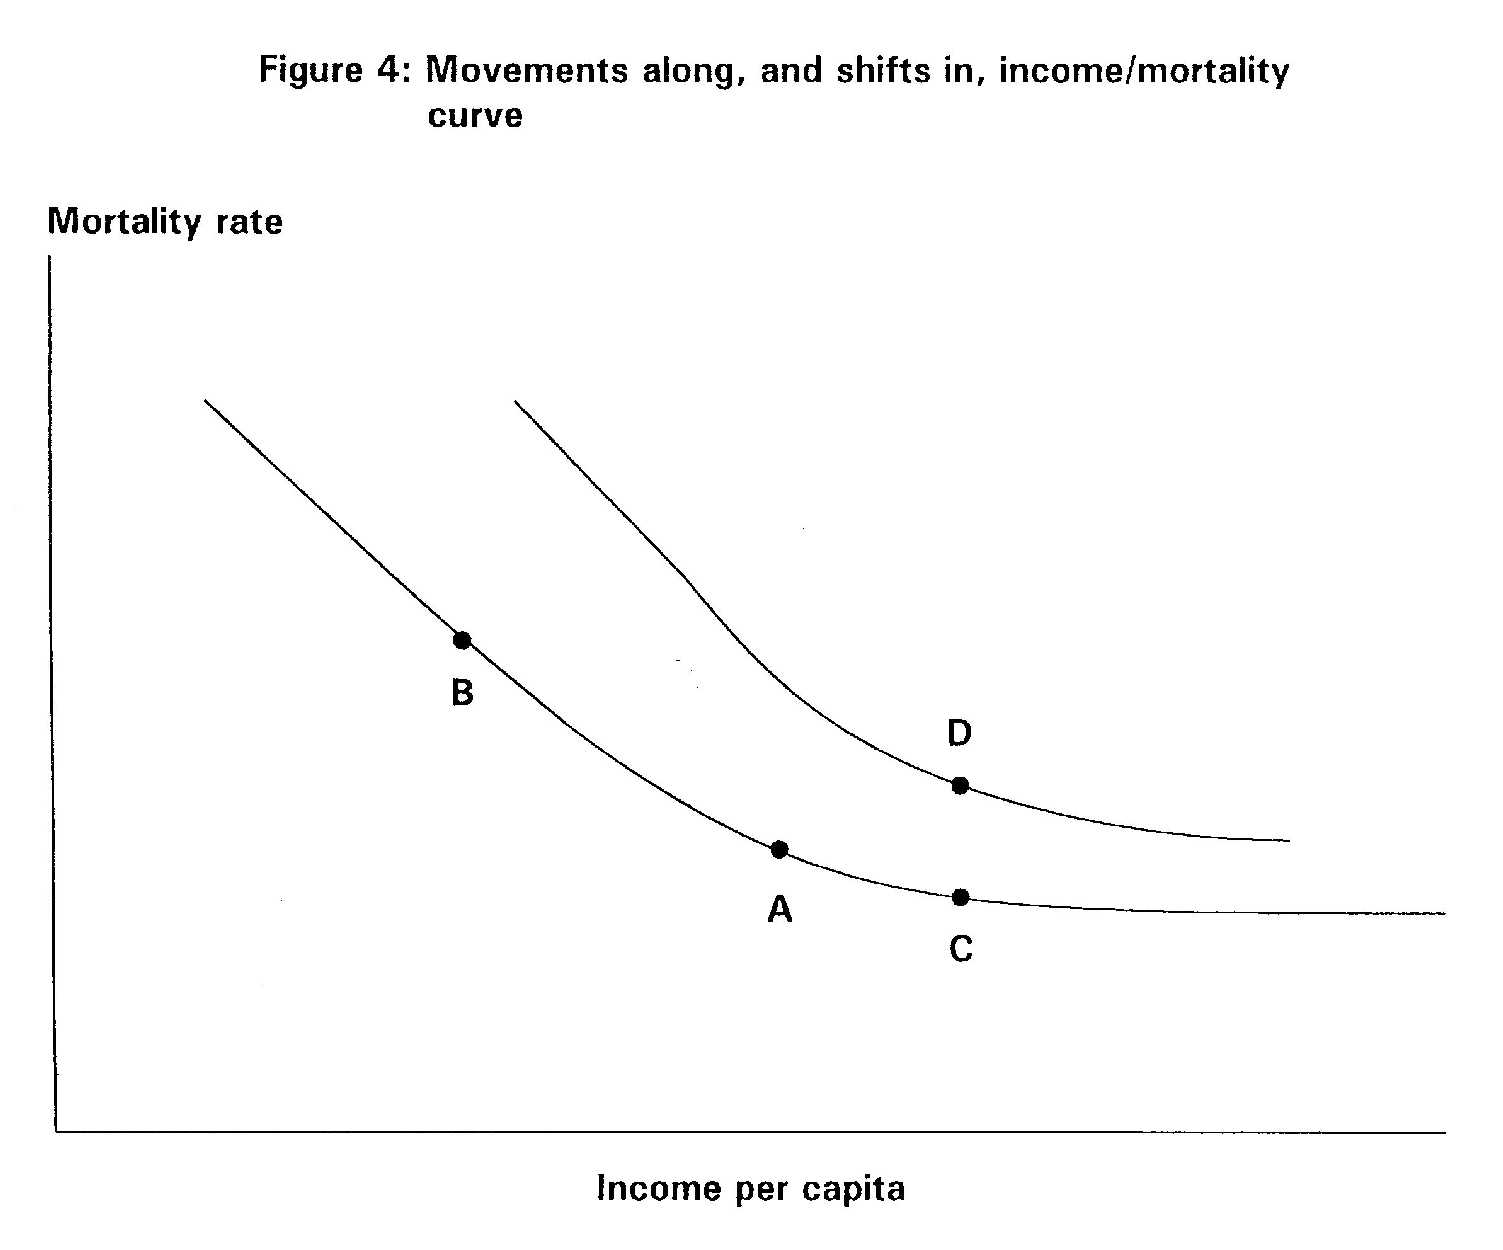
So far our discussions have focused on the macro-level association between income inequality and life expectancy. A micro-level theory is needed to explain the mechanisms through which the experience of inequality translates into poor health. Based on a theory originally developed by Durkheim,3 we hypothesize that a gap between an individual's aspirations (or "appetites" or expectations) and rewards (or material means) is stressful and directly harmful to health. On the health effects of frustrated aspirations Preston (1975) and Rodgers (1976) noted that the existence of a non-linear relationship between income and mortality is a sufficient condition for income distribution to be an independent determinant of life expectancy (we shall hereafter refer to this as the Preston-Rodgers thesis). We shall argue, however, that this is not the most interesting (or even the most important) cause of deviation from the income/life expectancy curve. Instead, we hypothesize that income inequality has an effect on life expectancy by altering people's perceptions of the fairness of their society; and that these perceptions in turn lead to adverse shifts in the income/mortality curve for people living in that society. As described above, shifts in the curve occur as a result of factors exogenous to income - for example, if frustrated aspirations lead to a rise in the prevalence of hypertension (as suggested by studies by Dressler), or to an increased susceptibility of the organism to illnesses (through neuroendocrine or immunologic mechanisms). It has been known for some time that economic recessions are associated with increased mortality (Brenner, 1979). The explanation for this phenomenon seems fairly straightforward: economic recessions are associated with job insecurity and rising unemployment. Especially vulnerable during recessions are those in industries whose goods or services are not essential, the less skilled who are the first to lose their jobs, and those who find that over successive business cycles their skills are no longer needed. For these groups - most often found in the lower socioeconomic groups - the decline in income (i.e., movement along the left of the income/mortality curve - from A to B in figure 4) causes deprivation, both relative and absolute. In turn, the stresses caused by deprivation leads to breakdown of family structures (coping resources); the adoption of inappropriate coping strategies (e.g., smoking or drinking to excess); and to general susceptibility to illness and death. What is more difficult to explain, however, is the finding that certain periods of rapidly rising incomes have also been associated with increased mortality (Eyer, 1980). For example, Brenner has shown rapid economic growth to be associated with suicide, homicide, cardiovascular mortality, and total mortality (Brenner, 1979). This is consistent also with Thomas' finding (1925) in Britain during the late 19th and early 20th centuries that the early phase of business-cycle upturns were positively correlated with mortality rates. In theory, a society with a booming economy ought to experience a reduction in mortality rate (i.e., movement along the right of the income/mortality curve - from A to C in figure 4). So long as everyone's incomes are rising, mortality rates ought to decline, even if economic growth is accompanied by a widening of income disparities. (As a matter of fact, the Preston-Rodgers thesis becomes progressively less relevant for explaining departures from the income/mortality curve as the per capita income of a society increases and it enters the plateau portion of the curve). The fact that mortality paradoxically increases suggests that certain types of economic booms are accompanied by an adverse shift in the income/mortality curve (from A to D in figure 4). To summarize, we hypothesize that gaps between aspirations and rewards - regardless of whether they occur during periods of economic boom or bust - are detrimental to health. It is not sufficient that everyone's standards of living are rising; people will always evaluate their economic progress and well-being in relative terms. Coleman (1991) has reviewed theories of how individuals' frustration levels increase during periods of economic improvement. (The purpose of Coleman's review was to demonstrate their inadequacy in explaining how revolutions occur during periods of economic improvement. However, we are not concerned here about rational choice explanations of the origin of revolutions. Our task is to construct a theory of the impact of perceived inequalities on health). The frustration theories reviewed by Coleman (1991) include:
The frustration theories suggest that the groups in society most vulnerable during times of economic booms are those with high initial expectations, i.e., the high SES groups. This may in turn explain the anomalous SES distribution of coronary heart disease in societies during their phase of rapid industrial development (Eyer, 1980). As coronary heart disease first began to rise in many countries (for example, the U.S., Britain, and New Zealand), it first affected the higher SES groups (Antonovsky, 1967; Marmot et al, 1978; Kawachi et al, 1991). As economic growth stabilized (or even stagnated) in these societies, the SES gradient reversed, so that CHD rates are higher now in lower-SES groups.4 On the other hand, in developing countries and newly-developed countries, higher income groups typically exhibit higher rates of CHD - e.g., Hong Kong (Wong and Donnan, 1992); Puerto Rico (Sorlie and Garcia-Palmieri, 1990); India (Sarvotham and Berry, 1968); and immigrants from Caribbean and African countries to the UK (Marmot, 1982). The changing association between SES and coronary heart disease may partly reflect historical differences in "lifestyle" habits - for example, the higher prevalence of cigarette smoking among high SES groups prior to the crossover of CHD rates. On the other hand, such an interpretation misses our point. Our theory accommodates such differences in "lifestyle" habits by hypothesizing that the increased uptake of cigarette smoking (for example) is an intermediate variable in the pathway between frustrated expectations and adverse health outcomes. The nature of relative deprivation In the preceding section we argued that periods of rapid industrialization are associated with widening gaps between expectations and reality. We further hypothesized that high SES groups were particularly vulnerable to frustrated expectations during periods of rapid economic growth. In this section, we turn our attention to the deleterious health effects of frustrated expectations during periods of stable economic growth. Dressler's studies (1982; 1987a; 1987b; 1990) of "lifestyle incongruity" and blood pressure provide direct evidence for the adverse health effects of frustrated expectations. In a recent study of an African-Americans community in the southern United States, Dressler defined "lifestyle incongruity" as the extent to which adherence to a conventional American standard of living (as assessed by a 23-item scale inquiring about ownership of material goods such as a home, central heating, air-conditioning, car and TV, etc) exceeded an individual's occupational class. In this study, higher lifestyle incongruity was related to higher blood pressure, independent of perceived chronic role stressors, age, sex, and body mass index (Dressler, 1990). Dressler argued that the subjects in his study were not seeking to excel in their lifestyle, but were seeking to live up to what Veblen defined as a "community-defined standard of decency" (Veblen, 1918). Similar conclusions were obtained from studies of lifestyle incongruity and blood pressure in St Lucia, West Indies (Dressler, 1982), central Mexico (Dressler et al, 1987a), and southern Brazil (Dressler et al, 1987b). One of the consequences of economic growth is to transform the material and social environment in ways that raise the real cost of living for most of the population in that society (Wilkinson, 1986). Adam Smith recognized this aspect of relative deprivation in The Wealth of Nations (1776): "By necessities I understand not only the commodities which are indispensably necessary for the support of life, but whatever the custom of the century renders it indecent for the creditable people, even of the lowest order, to be without". More recently, Sen (1992) has alluded to the problem of relative deprivation as a "capability handicap": "Relative deprivation in the space of incomes can yield absolute deprivation in the space of capabilities. In a country that is generally rich, more income may be needed to buy enough commodities to achieve the same social functioning, such as "appearing in public without shame". The same applies to the capability of "taking part in the life of the community"... While the rural Indian may have little problem in appearing in public without shame with relatively modest clothing and can take part in the life of the community without a telephone or a television, the commodity requirements of these general functionings are much more demanding in a country where people standardly use a bigger basket of diverse commodities". According to this view, it is not sufficient that everyone's incomes are rising by a certain amount. What matters is the distance between the rich and the poor in society. Most Americans living in poverty still have access to indoor plumbing, electricity, heat, a television set, and perhaps an old car. In many less-developed countries, the American poor would be considered rich. Yet the poor in America feel poor simply because their reference group consists of other Americans living around them, and in relation to this group they are poor. Poverty must thus be constantly redefined in the light of society's changing living standards. As society becomes more prosperous, the definition of what constitutes poverty has to be revised upwards (Blumberg, 1980). Jencks (1992) elaborates on this theme: "Contrary to what most economists assume, we [cannot] eliminate poverty simply by doubling or tripling everyone's income. This strategy would not work, because people need more goods and services when their society gets richer. Needs increase not just because people think they need more when their neighbors have more, but also for practical reasons. "In 1900, for example, America was organized on the assumption that city residents would get around on foot or by streetcar. Outside the cities, Americans traveled by foot or horse. In such a world an automobile was clearly a luxury. Over the course of the twentieth century, however, most Americans acquired cars. This had two effects. First, public transportation atrophied. Second, most employers and shops moved to areas that were accessible only by car, and most families did the same. Outside a few major cities, therefore, not having a car meant not being able to get to work, to shops, or to friends' homes, making a car a necessity for most Americans. "Many other consumer goods have followed the same trajectory, starting as luxuries but gradually becoming necessities. Telephones were a luxury in 1900, when hardly anyone had one. Today, when almost everyone has a telephone, those without service are cut off from family and friends, who no longer write letters. Indeed, those without telephones often have trouble even keeping a job, both because employers now expect workers to call in if they are sick and because workers without telephones cannot make hasty changes in their child-care or transportation arrangements. "Because changes in the way the average family lives require changes in the way poor families live, economic growth alone cannot eliminate poverty. If a rich country wants to rid itself of poverty ... it must keep the economic gap between those at the bottom of the economic hierarchy and those in the middle relatively small." Survey data confirm that the proportion of the population that report themselves to be satisfied with their economic performance does not rise as that proportion's average income rises (Easterlin, 1973). There appears to be no minimum absolute standard of living above which people will be content. Individual wants are not satiated as incomes rise; and if their income rises less rapidly than someone else's, or less rapidly than they expect, they may even feel poorer as their incomes rise. II. POLICY Choices for policy - trickle-down versus redistribution? A great deal has been written in the economic literature on inequality, but usually with scant regard to the health consequences of various policy options. Broadly speaking, economists have approached the problem of inequality in one of three ways (Atkinson and Micklewright, 1992):
In the trickle-down model of economic growth, the level of social welfare is evaluated according to: per capita income x (1 - Gini coefficient) As an hypothetical example, if the Gini coefficient were to rise from 20 to 30 percent, then a 14 percent rise in per capita income would "compensate" for the loss in social welfare resulting from the 10 percent rise in inequality. The limitation of this approach is that it fails to capture the distributional objectives of society, such as the significance we might place on the gap between the poor and the rich. Which leads us to the third approach:
In American society, the predominant approach taken toward the management of the economy has been based on trickle-down theory. In The Affluent Society, Galbraith described the post-war American answer to inequality: "It has become apparent to conservatives and liberals alike that increasing aggregate output is an alternative to redistribution or even to the reduction of inequality. The oldest and most agitated of social issues [equality], if not resolved, is at least largely in abeyance, and the disputants have concentrated their attention, instead, on the goal of increasing productivity" (Galbraith, 1958). During the Thatcher-Reagen years, trickle-down policies were exported throughout the developing world via the institutions of the IMF and the World Bank (Terris, 1992). As a condition for receiving IMF-World Bank loans, many countries agreed to implement "structural adjustment programs", which typically involved devaluation of currency, cuts in government spending, freeing up domestic and international trade, and turning public enterprises over to private management or joint ventures (Klitgaard, 1990). In the parlance of the World Bank: "The objective of structural adjustment programs is to restore rapid economic growth while simultaneously supporting internal and external fiscal stability... The [microeconomic] objective is to improve efficiency in the use of resources by removing price distortions, opening up more competition, and dismantling administrative controls (deregulation). Such programs include those for government expenditures and the management of public enterprises, including reductions in the government's presence in areas where private enterprise can operate more efficiently" (World Bank, 1988; quoted in Klitgaard, 1990). According to Kanji et al (1991), these are the same policies that are now threatening to reverse the major social gains and reductions in economic inequality achieved by post-independence states in sub-Saharan Africa: "The preoccupation (of IMF-World Bank policies) is with economic growth per se and represents a retraction from any marginal moves in the 1970s towards a Basic Needs approach to development. In the context of adjustment, education, health and other social services that were considered basic needs and basic rights are increasingly seen as commodities for purchase". Between 1980 and 1986, 75% of sub-Saharan African countries had implemented IMF and World Bank-sponsored structural adjustment programs. By the mid-1980s, evidence was beginning to mount on the negative health impacts of adjustment policies. Higher costs of living and restricted government expenditures on social services led to documented declines in infant nutritional status, rising unemployment, and widespread declines in literacy. The authors concluded: "To rely on nebulous concepts of "trickle down" to improve the well-being of the majority is to negate decades of experience which have shown that even in relatively favorable economic conditions, unacceptable levels of poverty and inequality have prevailed" (Kanji et al, 1991). How much inequality is "necessary"? The conservative response to pleas for redistribution is to point out that not all inequality is harmful. For example (it is argued), material rewards and incentives based on hard work, innovation, or merit play an important role in the prosperity of society. As Alfred Marshall (1902) said: "The true danger of socialism lies in its tendency to destroy the constructive force of variation and selection... we cannot afford to diminish suffering by means that appreciably choke up the springs of vigor". The conservative solution to encourage economic growth and productivity has therefore been to "liberate free enterprise", reduce social expenditures, restructure taxes to encourage saving and investment (shift the tax burden from those who save, the rich, to those who consume, the poor), and eliminate government rules and regulations that hinder business. The ideological origins of this view go back to an influential essay published in 1945 by Davis and Moore, in which it was argued that social and economic inequality are both functional and indispensable; and that the elements of social class - money, status, power - were society's prime motivating instruments with which society could, with a minimum of additional coercion, manage to get most people to perform obediently and conscientiously on the job. Yet Thurow (1980) has pointed out that most of America's competitors have not unleashed work effort and encouraged savings by increasing income differentials. Indeed, many countries have done the opposite. For example, examining the earnings gap between the top and bottom 10 percent of the population, the West Germans have 36 percent less income inequality than the Americans, and the Japanese 50 percent less inequality: "If income differentials encourage individual initiative, we should be full of initiative, since among industrialized countries, only the French surpass us in terms of inequality" (Thurow, 1980). The argument that income differentials are needed to provide work incentives is not supported by the empirical evidence. Work incentives are important and it is possible to impose such high taxes that they interfere with work effort; however, the empirical data uniformly suggest that tax rates in the United States are far below levels that create disincentives to work (Thurow, 1980). At prevailing tax rates, income effects (i.e., the need to work more to regain one's living standards) dominate substitution effects (the desire for more leisure because of lower take-home wages). In addition, individuals work for a variety of other rewards, including power, prestige, promotions and satisfaction. The origins of inequality The factors that determine the extent of income inequality in an economy include: market forces (higher earnings commanded by occupations for which workers are in short supply); the nature of the work (higher rewards for occupations requiring more training, greater skill, or greater responsibility); government policies (taxes and transfers); and ideas about distributive justice (the normatively acceptable top and bottom levels of earnings, as well as norms about fair income distribution). Of these factors, the role of public perceptions appear to be particularly important. Verba et al (1987) sought the opinions of "stakeholders" of three countries - Sweden, the USA, and Japan - on the issue of equality. The stakeholders included representatives of the "establishment" (business, labor, and farm leaders), "mediating groups" (intellectuals, the media, and politicians from the left and right), and so-called "challenging groups" (consisting of feminist groups, minority activists, and students). The three countries were chosen for comparison because of the contrasts in income distribution patterns: the pre-tax Gini coefficient in Sweden is 0.471 - higher than both the USA (0.446) and Japan (0.365). However, due to the active redistributive policies of the Swedish Social Democratic government, the post-tax Gini coefficient in Sweden is 0.303 - lower than either Japan (0.318) or the United States (0.383). The results of the international survey indicated that on issues of economic equality, there was virtually no common ground between the United States on the one hand, and Sweden and Japan on the other. For example, in answer to the statement "The government should work to substantially reduce the income gap", no American group (including labor leaders and Democrats) positioned themselves to the left of groups in Sweden or Japan. On the other hand, no Japanese or Swedish group (including business leaders and conservative politicians) positioned themselves to the right of American groups (Verba et al, 1987). The authors concluded that: "The U.S. Government is weak; it would have trouble launching an ambitious redistributive effort, and few people appear to want it to do so. Americans endorse equality of opportunity" - though not outcomes - "an ideal that fits well with the individualistic, achievement-oriented principles of free-market capitalism" (Verba et al, 1987; p. 55). Reflecting on the American "cult of individualism", Bellah et al (1985) pronounced: "Our society has tried to establish a floor below which no one will be allowed to fall, but we have not thought effectively about how to include the deprived more actively in occupational and civic life. Nor have we thought whether it is healthy for our society to give inordinate rewards to relatively few. We need to reach common understandings about distributive justice - an appropriate sharing of economic resources - which must in turn be based on conceptions of a substantively just society. Unfortunately, our available moral traditions do not give us nearly as many resources for thinking about distributive justice as about procedural justice, and even fewer for thinking about substantive justice". Inequality and public action Although people's preferences undoubtedly have an impact on the policies pursued by Government (as argued in the previous section), we would also add that a more inegalitarian society is inherently less capable of launching effective public action to enhance the well-being of its members. This is because in an inegalitarian, compartmentalized society, it is more difficult to mobilize the population to accept collective "ownership" of a problem, compared to a "classless" society where everyone finds themselves in the same boat. Kuttner (1984) refers to the benefits of universalism: "The idea is that universal entitlement to [basic social services] is not only decent social policy, but serves to reinforce a sense of community an solidarity. Being treated in the same medical clinic or sending one's children to the same day-care center or school - regardless of one's personal resources - is inherently egalitarian. When the middle class shares basic public services with the poor, the middle class demands high quality and dignified treatment; the middle class is also reminded that poor people are human. Thus does universalism in public services cement the political constituency for egalitarian social policy". Kaus (1992) echoes this sentiment when he calls for an expansion of the public sphere (or what he terms "civic liberalism") - for example, by providing universal health care and day-care - as the solution to widening social inequalities. Finally, Sen (1993) illustrates the importance of collective action in the context of averting famine in the Third World. In the Indian State of Maharashtra, a series of severe droughts led to a drastic reduction in the amount of food produced. The response to this famine was to institute public works programs - for example, the building of roads and wells. Such policies, as Sen points out, actually raise the price of food by escalating total demand. However, their net effect is to distribute the food shortage more equitably, since higher food prices leads to a reduction in consumption by groups less affected by the shortage. Although the average amount of food available per person in Maharashtra was much lower than in the Sahel countries (Burkina Faso, Mauritania, Mali, Niger, Chad and Senegal), there was little starvation in Maharashtra. By contrast, the Sahel experienced widespread famine due to their inability to distribute the food shortage more equally. The question is: would a more equitable redistribution of income lead to a type of society that is more capable of ensuring full childhood immunization coverage; ensuring universal access to health care; providing full employment; ending gender and race discrimination - in short, implementing the kinds of policies that push the income/life expectancy curve outwards? Footnotes 1There is yet a third hypothesis concerning the shape of the relationship between income and mortality - what we call the "the U-shape hypothesis". This is illustrated by data from the British Health and Lifestyles Survey (Wilkinson, 1990). Three measures of health were examined: self-reported disease/disability (ranging from "no disease or impairment" to "unable to walk and requiring help with the activities of daily living"); self-reported illness during the last month (based on the number of illness symptoms selected from a checklist of 16); and psycho-social health (based on answers to questions about a range of symptoms including depression, worry, difficulty sleeping, etc). The results indicated a clear tendency for ill health to decline very steeply over the first few income increments, bottoming out, and then beginning to rise again at the highest income levels. Relatively few studies have been able to address this hypothesis. However, the U-shape hypothesis does not invalidate the rest of our discussion; rather, it strengthens the case for redistributing income from the top to the bottom group as a way of improving the overall health of the population. 2In the following discussion, the exact level of income at which life expectancy curve flattens out is not critical, though this is an important question for empirical investigation. 3Durkheim (1897) made explicit the connection between frustrated aspirations and suicide: "At every moment of history there is a dim perception, in the moral consciousness of societies, of the respective value of different social services, the relative reward due to each, and the consequent degree of comfort appropriate on the average to workers in each occupation... A genuine regimen exists, therefore, although not always legally formulated, which fixes with relative precision the maximum degree of ease of living to which each social class may legitimately aspire. However, there is nothing immutable about such a scale. It changes with the increase or decrease of collective revenue... Thus what appears luxury to one period no longer does so to another; and the well-being which for long periods was granted to a class only by exception and supererogation, finally appears strictly necessary and equitable... "In the case of economic disasters... something like a declassification occurs which suddenly casts certain individuals into a lower strata than their previous one. Then they must reduce their requirements, restrain their needs, learn greater self-control... It is the same if the source of the crisis is an abrupt growth of power and wealth. Then, truly, as the conditions of life are changed, the standard according to which needs are regulated can no longer remain the same... Some particular class especially favored by the crisis is no longer resigned to its former lot, and, on the other hand, the example of its greater good fortune arouses all sorts of jealousy below and about it" (pp. 249-253). 4The differential impact of environmental stressors (in this case, economic instability) on different social status groups has an analogy in non-human primate models (Clarkson et al, 1987). In a study of 30 male cynomolgus monkeys fed on a high-fat diet (consisting of 43% calories derived from fat), one half were randomized to "experimentally-induced social instability", which consisted of repeated reorganization of group membership. The other half were kept in socially stable configurations throughout the 22 months of the experiment. At the end of the experiment, the animals were sacrificed and their extent of coronary atherosclerosis measured in mm2 of cross-sectional intimal thickness. In the socially unstable environment, it was found that the dominant, highly aggressive and competitive monkeys had more severe coronary atherosclerosis compared to the subordinate monkeys; whereas the exact reverse was true in the socially stable environment (Kaplan et al, 1982). References Antonovsky A. Social class, life
expectancy and overall mortality. Milbank Mem Fund Q 1967; 42:
Antonovsky A. Social class and the major cardiovascular diseases. J Chron Dis 1968; 21: 65-106. Atkinson AB and Micklewright J. Economic
transformation in Eastern Europe and the distribution of
Bellah RN, Madsen R, Sullivan WM,
Swidler A, Tipton SM. Habits of the Heart. New York: Harper
Blumberg P. Inequality in an Age of Decline. Oxford: Oxford University Press, 1980 (page 101). Brenner MH. Mortality and the national
economy. A review, and the experience of England and Wales,
Bruhn JG and Wolf S. The Roseto Story. Norman: University of Oklahoma Press, 1979. Caldwell JC. Routes to low mortality in poor countries. Pop Development Review 1986; 12: 171-220. Clarkson TB, Kaplan JR, Adams MR,
Manuck SB. Psychosocial influences on the pathogenesis of
Coleman JS. Foundations of Social Theory. Cambridge, MA: Harvard University Press, 1990. Davis K, Moore WE. Some Principles of Stratification. Am Sociol Review 1945; 10: 242-49. Dressler WW. Hypertension and Culture
Change: Acculturation and Disease in the West Indies. South
Dressler WW, Alfonso M, Chavez A,
Viteri FE. Arterial blood pressure and individual modernization in
Dressler WW, Santos ED, Gallagher
PN, Viteri FE. Arterial blood pressure and modernization in Brazil.
Dressler WW. Lifestyle, stress and
blood pressure in a Southern Black community. Psychosom Med
Dreze J and Sen A. Hunger and Public Action. Oxford: Clarendon Press, 1989. Durkheim E. Suicide. Spaulding JA, Simpson G (trans.). New York: Free Press (1897), 1951. Dutton DB, Levine S. Overview, methodological
critique, and reformulation. In: JP Bunker, DS Gomby,
Easterlin R. Does Money Buy Happiness? The Public Interest 1973 (Winter); 30: 3. Egolf B, Lasker J, Wolf S, Potvin
L. The Roseto effect: a 50-year comparison of mortality rates. Am J
Eyer J. Social causes of coronary heart disease. Psychother Psychosom 1980; 34: 75-87. Flegg AT. Inequality of income, illiteracy
and medical care as determinants of infant mortality in
Fox AJ, Goldblatt PO, Jones DR. Social
class mortality differentials: artefact, selection or life
Galbraith JK. The Affluent Society. Boston: Houghton Mifflin, 1958 (page 97). Gwatkin DR. Indications of change
in developing country mortality trends. The end of an era? Pop Dev
Haan MN, Kaplan GA, and Syme SL (1989).
Socioeconomic status and health: old observations and
House JS, Kessler RC, Herzog AR,
Kinney AM, Mero RP, Breslow MJ. Age, socioeconomic status,
House JS, Kessler RC, Herzog AR,
Mero RP, Kinney AM, Breslow MJ. Social stratification, age, and
Jencks C. Rethinking Social Policy.
Race, poverty, and the underclass. Cambridge, MA: Harvard
Kanji N, Kanji N, Manji F. From development
to sustained crisis: Structural adjustment, equity and
Kaplan JR, Manuck SB, Clarkson TB,
Lusso F, Taub DM. Social status, environment and
Katz MB (1989). The Undeserving Poor. New York: Pantheon Books. Kaus M. The End of Equality. New York: BasicBooks, 1992. Kawachi I, Marshall S, Pearce N.
Social class inequalities in the decline of coronary heart disease
Keys A. Seven Countries: A multivariate
analysis of death and coronary heart disease. Cambridge:
Kitagawa EM, Hauser PM. Differential
Mortality in the United States: A study in socioeconomic
Klitgaard R. Tropical Gangsters. New York: Basic Books, 1990. Kuttner R. The Economic Illusion.
False choices between prosperity and social justice. Philadelphia:
LeGrand J. Inequalities in health. Some international comparisons. Eur Econ Review 1987; 31: 182-191. Marmot MG, Adelstein MM, Robinson
N, Rose GA. Changing social class distribution of heart disease.
Marmot MG. Socio-economic and cultural
factors in ischaemic heart disease. Adv Cardiol 1982; 29:
Marmot MG, Theorell T. Social class
and cardiovascular disease: the contribution of work. Int J Health
Marmot MG, Davey Smith G. Why are the Japanese living longer? Br Med J 1989; 299: 1547-1551. Marshall Alfred (1902). Correspondence
to Benjamin Kidd. Quoted in: Robert Skidelsky. John
Merton RK and Rossi AS. Contributions
to the theory of reference group behavior. In: Continuities in
Merva M, Fowles R. Effects of Diminished
Economic Opportunities in Social Stress. Heart attacks,
Mezentseva E and Rimachevskaya N.
The Soviet country profile: Health of the U.S.S.R. population in
Morgenstern H. Uses of ecologic analyses
in epidemiological research. Am J Public Health 1982; 72:
Murray CJL, Chen LC. In search of
a contemporary theory for understanding mortality change. Soc Sci
Pappas G, Queen S, Hadden W, Fisher
G (1993). The increasing disparity in mortality between
Preston SH. The changing relationship
between mortality and level of economic development. Pop
Preston S. Mortality Patterns in National Populations. London: Academic Press, 1976. Rodgers GB. Income and inequality
as determinants of mortality: an international cross-section analysis.
Rose G (1992). The Strategy of Preventive Medicine. Oxford: Oxford University Press. Samuelson PA and Nordhaus WD. Economics (13th edition). New York: McGraw-Hill, 1989. Sarvotham SG, Berry JN. Prevalence
of coronary heart disease in an urban population in northern India.
Sen A. Inequality Re-examined. Cambridge, MA: Harvard University Press, 1992. Sen A. The economics of life and death. Scientific American, 1993 (May): 40-47. Smith A. The Wealth of Nations. New York: Random House, Modern Library, 1937 (1776). Sorlie PD, Garcia-Palmieri MR. Educational
status and coronary heart disease in Puerto Rico: The
Stouffer AE, Suchman EA, DeVinney
LC, et al. The American Soldier, vols. I and II. Princeton:
Terris M. Budget cutting and privatization:
the threat to health. Journal of Public Health Policy, Spring
Thomas DS. Social aspects of the
business cycle. London: Routledge, 1925 (quoted in Brenner, 1979,
Thurow LC. The Zero-Sum Society. New York: Basic Books, 1980. Townsend P and Davidson N (eds).
Inequalities in health: the Black Report. Hammondsworth, England:
Veblen T. The Theory of the Leisure Class. New York: BW Huebsch, 1918. Verba S, Kelman S, Orren GR, et al.
Elites and the Idea of Equality. Cambridge, MA; Harvard
Wilkinson RG. Income and mortality.
In: Class and Health: Research and Longitudinal Data. (ed.) R.G.
Wilkinson RG. Income distribution
and mortality: a 'natural' experiment. Sociology of Health & Illness
Wilkinson RG. Income distribution and life expectancy. Br Med J 1992a; 304: 165-168. Wilkinson RG. National mortality
rates: the impact of inequality? Am J Public Health 1992; 82:
Wnuk-Lipinski E and Illsley R. International
comparative analysis: main findings and conclusions. Soc
Wong SL, Donnan SPB. Influence of
socioeconomic status on cardiovascular disease in Hong Kong. J
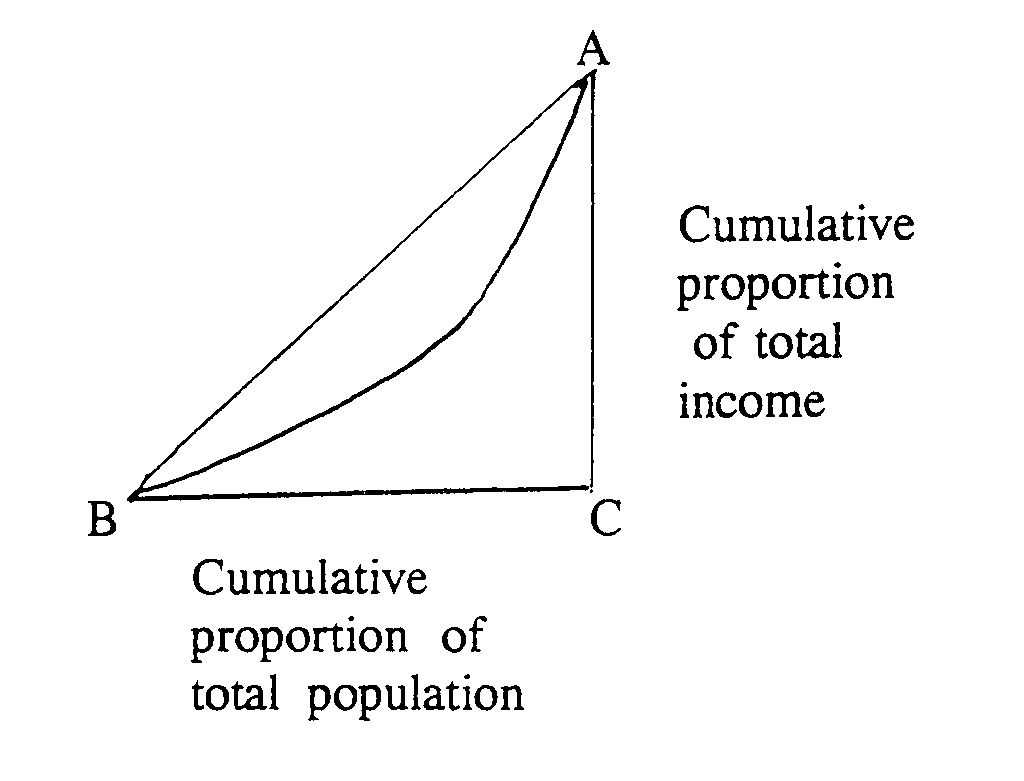
Figure 1: The relationship between income level and mortality (from Pappas et al, 1993) Figure 2: Life expectancy as a function of income (adapted from Rogers, 1979) Figure 3: Illustration of movement along, and shifts in income/life expectancy curve. Figure 4: Movements along, and shifts in, income/mortality curve. Appendix: Derivation of the Gini coefficient The Lorenz curve is a graphic device for representing the degree of inequality. It is constructed by imagining everyone lined up in order of their income (starting with the lowest income) and calculating their cumulative share of total income, as shown below: Figure: Gini Coefficient Graphic The curve shows the share of the bottom 10 percent, the share of the bottom 20 percent (which includes the bottom 10 percent) and so on. If all incomes were equal, the Lorenz curve would follow the diagonal. The Gini coefficient is a single summary measure of income distribution. It is given by the area between the Lorenz curve and the diagonal line of equal incomes: the coefficient is equal to the ratio of this area to the area of the whole triangle ABC. The mathematical interpretation of the Gini coefficient is as follows: twice the Gini coefficient is equal to the expected absolute difference in incomes, relative to the mean, between any two persons drawn at random from the population. A Gini coefficient of 20 percent, for example, implies that the absolute difference, on average, between the incomes of two randomly selected people is equal to 40 percent of mean income in the population. |
| Home | Overview and making causal inferences | Glossary | Papers/Readings |