
NOAA Tide and Weather at FHL
by Erin Dodge
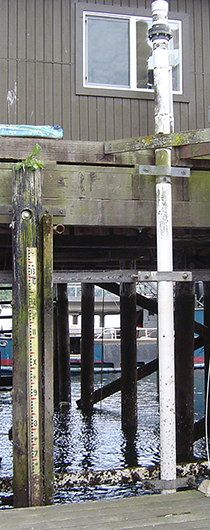
Fig. 1: The water level station located at the FHL pier.
I work for the National Oceanographic and Atmospheric Administration (NOAA) National Ocean Service (NOS) as a Physical Scientist for the Center for Operational Oceanographic Products and Services (CO-OPS). We are part of the Pacific Operations Branch team based in Seattle, WA. We collect data from as far north as the Arctic Ocean, as far west as Guam and as far south as American Samoa, including coastal Alaska, the U.S. West Coast, Hawaii, and the Pacific Trust Territories. Products and services derived from CO-OPS data are used to: produce tide and current predictions and forecasts, support nautical charting and shoreline mapping, improve GPS accuracy, support coastal and emergency managers with storm surge warnings in hurricane and storm-prone coastal areas, support tsunami warnings, help scientists, coastal managers, and engineers understand sea level trends, forecast harmful algal blooms, provide critical decision making information to commercial shipping ports and pilots, provide useful information to coastal recreation users, and many other uses. Our Seattle team focuses on installing, maintaining, and repairing our oceanographic and meteorological observing systems within these areas. I am personally in charge of monitoring and maintaining the Washington and Oregon observing systems and stations.
The UW Friday Harbor Labs hosts a National Water Level Observation Network (NWLON) Station as well as a remote, stand-alone meteorological station. Established in 1932, this station continues to operate as part of a nationwide network of 210 long-term, continuously-operating water level stations throughout the U.S. and its territories that provide crucial data for government and commercial sector navigation, recreation, and coastal ecosystem management. The station has existed in its current location since 1989, on the pier at the FHL. The remote meteorological station was added on nearby Cantilever Point in 2008.
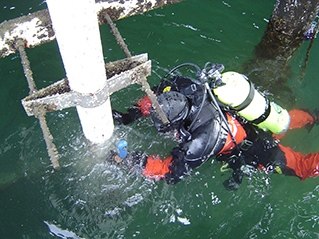
Fig. 2: A NOAA diver scrubs the Aquatrak's PVC enclosure during annual servicing.
The water level station on the pier (Figure 1) hosts two water level sensors. The primary is an acoustic sensor called an Aquatrak. This sensor operates by sending a sonic pulse down a 1/2-inch PVC sounding tube. The pulse bounces off the water’s surface and returns back to the sensor. This distance, computed from the time for the pulse to return to the sensor, is converted to a tidal value in meters. Our product displays this tide height above Mean Lower Low Water (MLLW). The Aquatrak sounding tube is protected by a 6 inch PVC pipe enclosure that contains parallel plates at the bottom as well as a copper tube insert to dampen wave action, reduce effects from currents, and prevent marine growth (Figure 2). The backup sensor is a pressure transducer: a pump purges air out of an orifice installed at a known depth. This pressure sensor measures the pressure required to force the air out of the orifice, which is relative to the depth of seawater over the orifice (Figure 3). This measured pressure is then converted to tide height in meters.
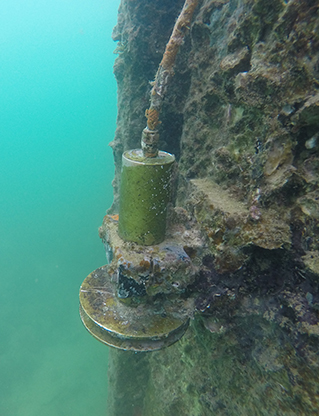
Fig 3: The pressure sensor orifice.
Other data observations provided by the water level station are water temperature and barometric pressure. The thermistor that provides water temperature is located near the bottom of and inside the protective 6-inch PVC Aquatrak well. The barometer is located within the instrumentation enclosure in the pier office.
Another component of this water level station is the benchmark network. Benchmarks can be of two different types: the first is a 1/2-inch diameter stainless steel rod driven to refusal into the ground (“refusal” is typically when the rod hits bedrock). The second benchmark type is a small brass disk set into bedrock or another structurally sound foundation (Figure 4). Each NWLON water level station has a network containing ten benchmarks, one of which is the primary benchmark. The primary is usually the most stable benchmark that is closest to the water level sensors. Based on our water level data and surveying, our office assigns the primary benchmark a known elevation relative to MLLW. This elevation is referenced during survey runs conducted during maintenance visits to compare to the elevation of our water level sensor, to ensure little to no vertical movement has occurred to the sensor. This ensures our calculated water level values are accurate.
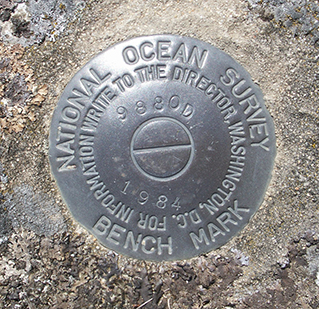
Fig. 4: One of the brass disk benchmarks at FHL.
The meteorological station consists of three sensors: two anemometers and an air thermistor. The anemometers, or wind birds, are located on top of a 25 ft. tall mast and gather both speed and directional data (Figure 5). Air temperature data is gathered via a thermistor mounted just below the wind birds. Often, these meteorological sensors are installed adjacent to the water level station but, in the case of Friday Harbor, ideal conditions could not be achieved at that site therefore a remote meteorological station was necessary.
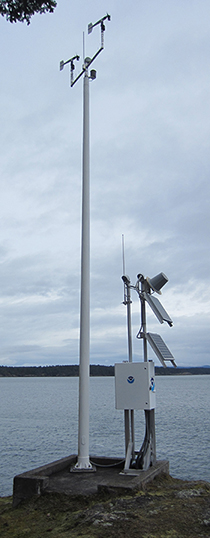
Fig. 5: The NOAA meteorological station near FHL's pumphouse.
Both the water level station and remote meteorological station operate autonomously. At the water level station, data from the primary sensor is collected and logged, recording both 6-minute and 1-minute data. In contrast, data from the backup sensor are collected and logged recording both 6-minute and 15-second data. 15-second data are used for internal tsunami research and are not readily available to the public. Both water level data and water temperature are transmitted every 6 minutes via GOES Satellite and populated online at https://tidesandcurrents.noaa.gov/. The meteorological station data transmits via GOES Satellite hourly and is populated alongside the water level data.
These real-time measurements and transmissions mean public access to these data. You can find the station page for the FHL observations at https://tidesandcurrents.noaa.gov/stationhome.html?id=9449880. The meteorological station out on the point reported 45-knot gusts last week during the gale that caused a power outage, and it's interesting to note when low pressure systems cause tidal anomalies by checking this page.
Look for Tide Bites in your inbox at the start of each month! To view previous Tide Bites, visit the FHL archive page located on the FHL website.