 Project Overview: Large online communication and social media datasets are increasingly used by researchers in many disciplines, but the size, complexity, and volatility of these datasets presents a challenge. We are designing and building visual analytics tools, combining interactive visualizations with computational modeling, to help researchers explore and understand these datasets more easily. Challenges include effectively summarizing and slicing large amounts of text-based data, surfacing contextual information, and integrating different kinds of metadata. Through our human-centered design approach, in which we work closely with practitioners of social media research, we have prototyped and tested several new social media analysis systems, and uncovered opportunities and implications for design.
Lariat: Visual Analytics for Exploring Social Media Data
Lariat is a tool for social media research to explore twitter data. The design stemmed from a series of interviews with social scientists and a participatory design session. One key feature of the tool allows users to generate plots on the fly and use them as a way to drill down into a specific subset of tweets, supporting the sense-making process.
The tool has not yet been officially released, but the current prototype can be found on GitHub.
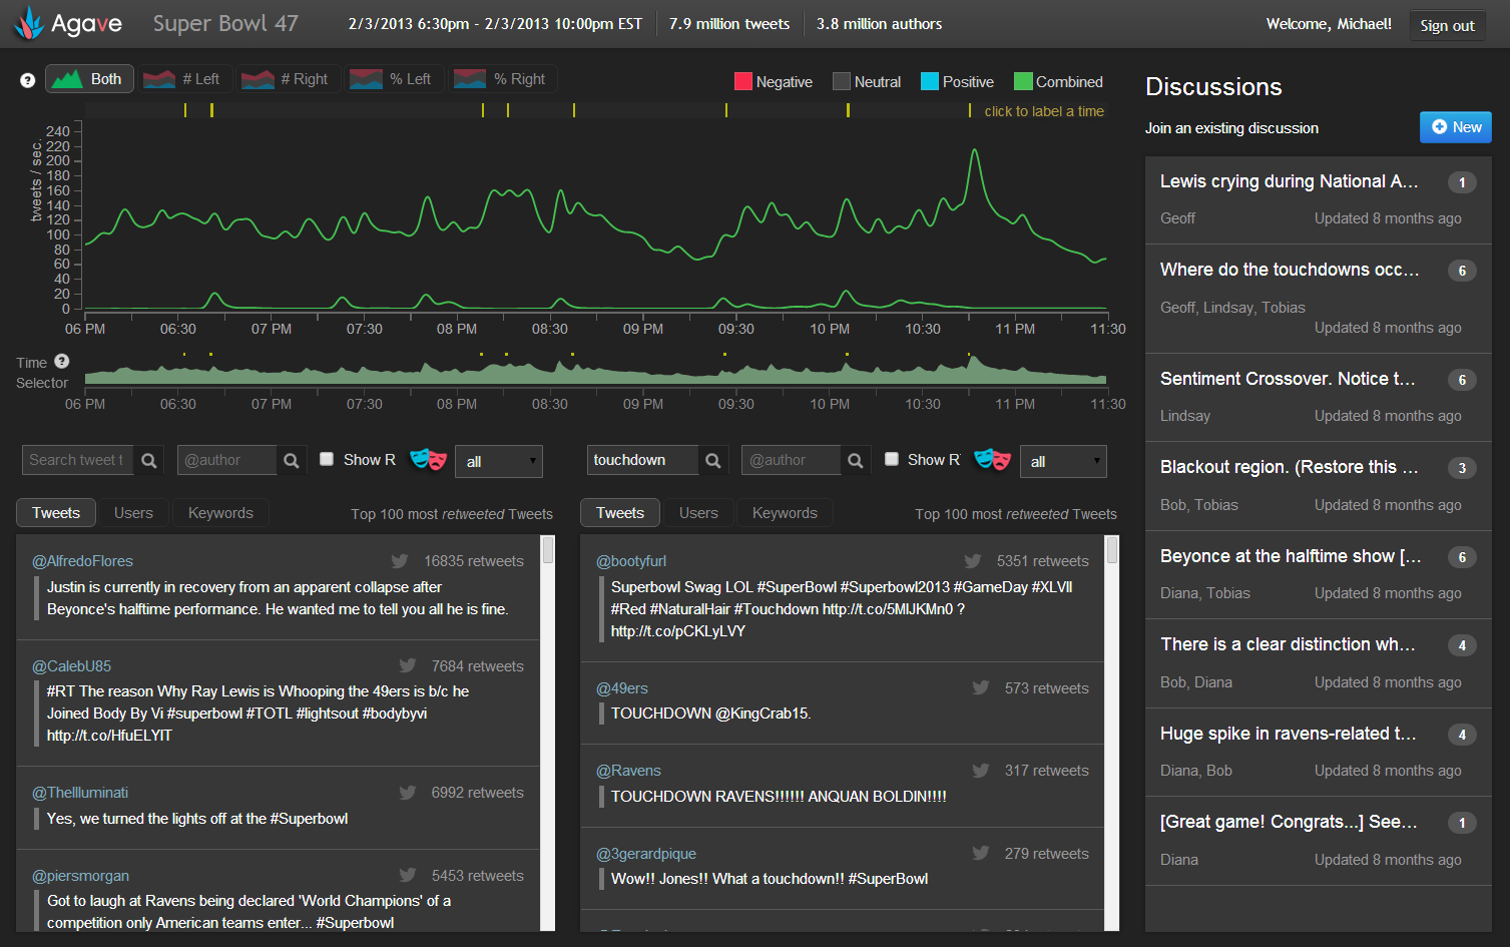
Agave: Collaborative Visual Exploration of Twitter Data
Social media datasets have many facets and include highly diverse content, which makes getting an initial understanding of the dataset difficult. Agave is a web application that we built to help groups of researchers explore datasets of millions of tweets. Agave’s main features include an interactive timeline showing changes in tweet rate and sentiment over time, searching and filtering controls, and built-in annotation and discussion with others (requires Twitter sign-in). You can visit Agave to see how it works on Twitter data that we have collected.
We conducted a qualitative evaluation of Agave with several researchers who work with social media data, and found that Agave’s interactive visualizations effectively promoted exploratory analysis, while the discussion posts and annotations of other users helped stimulate ideas and deeper exploration. Our system and findings were published at CDVE 2014.
Research Team
Michael Brooks, University of Washington, Human Centered Design and Engineering, PhD
Nan-Chen Chen, UW, HCDE, PhD Student
Ray Hong, UW, HCDE, PhD Student
Meg Drouhard, UW, HCDE, PhD Student
Rafal Kocielnik, UW, HCDE, PhD Student
Cecilia Aragon, UW, HCDE, Associate Professor
Vanessa Peña-Araya, University of Chile, CS, PhD Student
Publications
Brooks, M., Robinson, J.J., Torkildson, M.K., Hong, S., Aragon, C.R. Collaborative visual analysis of sentiment in Twitter events. International Conference on Cooperative Design, Visualization, & Engineering (CDVE) (2014). doi: 10.1007/978-3-319-10831-5_1 PDF
Chen, N., Brooks, M., Kocielnik,R., Hong, R., Smith, J., Lin, S., Qu, Z., Aragon, C. Lariat: A visual analytics tool for social media researchers to explore Twitter datasets. Proceedings of the 50th Hawaii International Conference on System Sciences (HICSS), Data Analytics and Data Mining for Social Media Minitrack (2017). PDF
Posters
Brooks, M., Kuksenok, K., Torkildson, M.K., Robinson, J.J., Berry, A.B.L., Hong, S., Zukowski, A., and Aragon, C.R. Visualizing emotion and influence in Twitter. HCDE Corporate Affiliates Day (2013). PDF
