|
|
|
Division of Nuclear Medicine SimSETAppendix IV: |
|
This document describes the main data structures managed by the "Sub-Object" module of the PHG. It assumes you are familiar with the design and concepts of the PHG. It is intended to explain implementation details to those concerned with maintaining and modifying the PHG.
Note that the pre-design, and parts of the design documents may refer to "sub-objects" while this document will refer only to "objects". The Activity Sub-Object and Attenuation Sub-Object are referred to as Activity Object and Attenuation Object.
The 'Activity Object' is represented as a three dimensional array. The diagram below illustrates the Activity Object data structures.
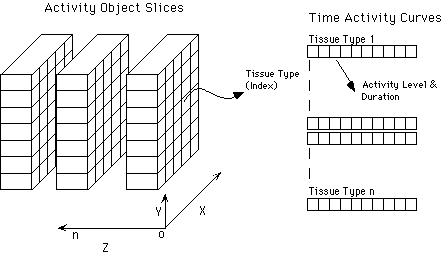
The two-dimensional component of the object represents a 'slice' through the object in x-y space. Each element in the slice contains an index representing a 'Tissue Type'. The third dimension is used to hold a stack of slices in the z direction (tomograph axis).
Each Tissue Type is actually an index into a set of 'Time Activity Curves' (TAC). The current implementation only supports constant activity levels, but the data structures in place support time-varying activity.
The Activity Object is used to build a 'Decay Table'. This table represents the number of decays that occurred within each voxel of the Activity Object. The difference between the Activity Object and the Decay Table is that the voxels of the Decay Table contain the number of decays that should start from that location. The Decay Table is described later in this document.
In order to understand the Productivity Table, you must understand the geometry of Stratified Sampling. The diagram below illustrates the pertinent geometry of Stratified Sampling.
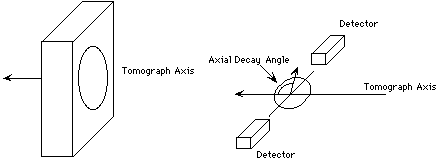
The tomograph is a ring of detectors. When a decay occurs within the activity object, the resulting photon(s) will have a direction angle with respect to the tomograph axis. If the photon were to leave the object without interacting, this angle would determine whether the event would reach the detectors or escape out of the field of view.
In order to prevent wasting time simulating events whose starting angles make their detection very unlikely the event will be detected, we use a 'Productivity Table' to tell us where we should concentrate our effort.
We define an 'Acceptance Angle' as the angle at which a photon must strike the target cylinder in order to be detected. The Productivity Table stratifies the possible angles and assigns "productivities" for each angle bin. The diagram below illustrates the stratification of the 'emission angles'.
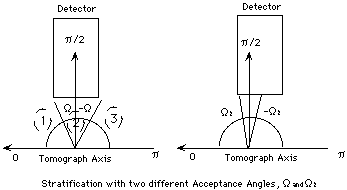
The stratification divides the potential starting angles into three areas (1) from zero to omega, (2) omega to -omega, and (3) -omega to pi. We then subdivide these areas into potential starting angles. The non-productive areas 1 and 3 are subdivided into 6 angles each. The productive area, 2, is divided into 12 potential angle ranges These ranges are then assigned a productivity value which is used in determining the number of events that will be simulated with that particular starting angle.
The productivity table is organized by angle cosines, not angles, so the stratification of the cosines runs from 1 to -1. For each slice in the Activity Object, there is a corresponding Productivity Array. The productivity Array is diagrammed below.
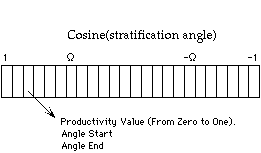
Productivity Array
Each simulation has its own productivity response based on the geometry, attenuation and activity distributions of the object being simulated. The PHG records the starting angle for all detected photons and thus computes the productivity for those angles. This, in turn, can be used as a starting productivity table to perform longer yet more efficient simulations.
The Activity Object defines all of the voxels and their corresponding activity level, and the Productivity Table defines the productivity for all possible emission angles in all slices. From this, the number of decays that should occur for all emission angles at each voxel can be calculated. This information is stored in the Decay Table.
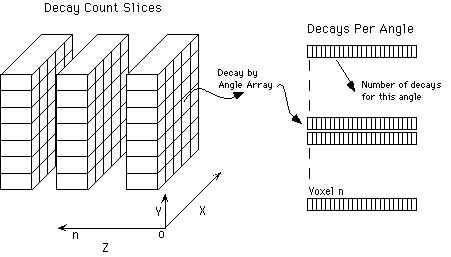
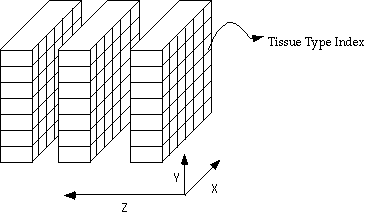
The 'Attenuation Object' is very similar to the Decay and Activity Objects. However, each voxel within the Attenuation Object contains an index representing a tissue type. The tissue type defines the "attenuation" characteristics of the voxel. The diagram below illustrates the Attenuation Object data structure
Expanded view of attenuation object
The two-dimensional component of the object represents a 'slice' through the object in x-y space. Each element in the slice contains an index representing a 'Tissue Type'. The third dimension is used to hold a stack of slices in the z direction (tomograph axis).
The 'Tissue Type Index' is used to obtain the attenuation value of the given voxel from the Attenuation Table.
Last revised by: Steven Vannoy Revision date: 08 Feb 1999