Session 3: How to Coach on Setting Aims and Measures
In this session you will review coaching on setting aims and measures, as well as tracking progress towards your aim using a run chart.
Getting Ready For This Session
- Remember to have your workbook and a pen or pencil handy.
- You will need about 60-70 minutes to complete the session.
Learning Objectives
At the end of this session, learners will be able to:
- Coach a team in how to write a SMART aim for a QI project
- Coach a team in identifying three types of measures that are useful for tracking progress in a QI project
- Identify additional process measures that could be tracked for a test of change (PDSA)
- Describe a time-series graph (run chart) to track progress towards an aim
Learning Activities
-
Introduction (2 min)
This session will help you coach your team by setting aims and measures for your project. You will also learn how to create and use a run chart to track progress on the measures for your QI project.

-
Pre-test Self-Assessment (10 min)
Let’s begin this session with a brief pre-check of your knowledge of setting aims and measures. Each question will have a score for you to track in your workbook. Please track your scores as you go through this assessment, and make note of any content areas that you answered incorrectly.
-
Aim Statements (5 min)
Writing an aim statement and identifying measures to track are two of the foundational activities for your QI project. The aim statement:
- Provides a common purpose for the team
- Communicates the work clearly to others
- Maintains the team’s focus over time
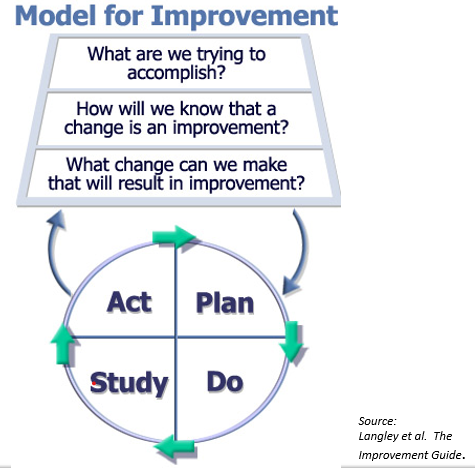
As we have mentioned, our programme applies the Model for Improvement to QI work. These steps of writing an aim statement and identifying measures are directly related to the Model for Improvement’s key questions:
- What are we trying to accomplish? (the aim)
- How will we know that a change is an improvement? (the measures)
Model for Improvement to QI work
-
Writing an Aim Statement and Setting Measures (3 min)
Let’s watch a short clip from a recorded QI lesson that focuses on setting aims and measures. Please note that this is a video, so you will not be able to tap on links or buttons on the screen.
-
Coaching on Setting Aims (7 min)
Let’s listen to Tendai as she talks about setting aims with teams in Zimbabwean facilities.
Transcript

When I coach a team on writing an aim, I remind them what SMART stands for—Specific, Measurable, Actionable, Realistic and Time-bound. And then we go through the template together, where it shows, ‘by a certain time, we will improve whatever we’re working on from baseline X to our goal Y.’ And we think about whether our aim is realistic and something we can actually take action on…
For some of our QI projects, the aim has been assigned—such as with the viral load project, where we have been given three aims on coverage, documentation and management of high VL patients. On the other hand, sometimes we have the opportunity to identify a problem that we want to address and write an aim statement for it. This takes a bit of time—writing a good SMART aim statement can require discussion and reflection. It is important to keep that in mind as you get started so you allocate enough time for the process.
Tendai -
Types of Measures (5 min)
To recap, as mentioned in the video we watched, there are several types of measures that help the team track progress towards its aim. Tap each tab to learn more.
Outcome measures
Outcome measures are the main measures you are tracking to see if you are making progress towards your aim—for example, the proportion of eligible patients who are VL tested and receive their results.
Process measures
Process measures are intermediate steps that you track during the course of your project—for example, the number of eligible clients contacted by phone to come to the clinic for their VL test.
Balancing measures
Balancing measures are indicators of possible ‘side effects’ of the improvement project—for example, clinic wait times for patients to get blood taken.
PDSA measures
PDSA measures are technically also process measures, but we are calling them out separately because they are important. These are the ways that the team tracks how the change idea is working out. For example, if the team is testing an idea to use a sticker system for documentation, the PDSA measure could be the number of records with the sticker correctly used.
-
Planning for Collection and Documentation (5 min)
Remember, documentation is essential!
If it wasn’t documented, it didn’t happen.
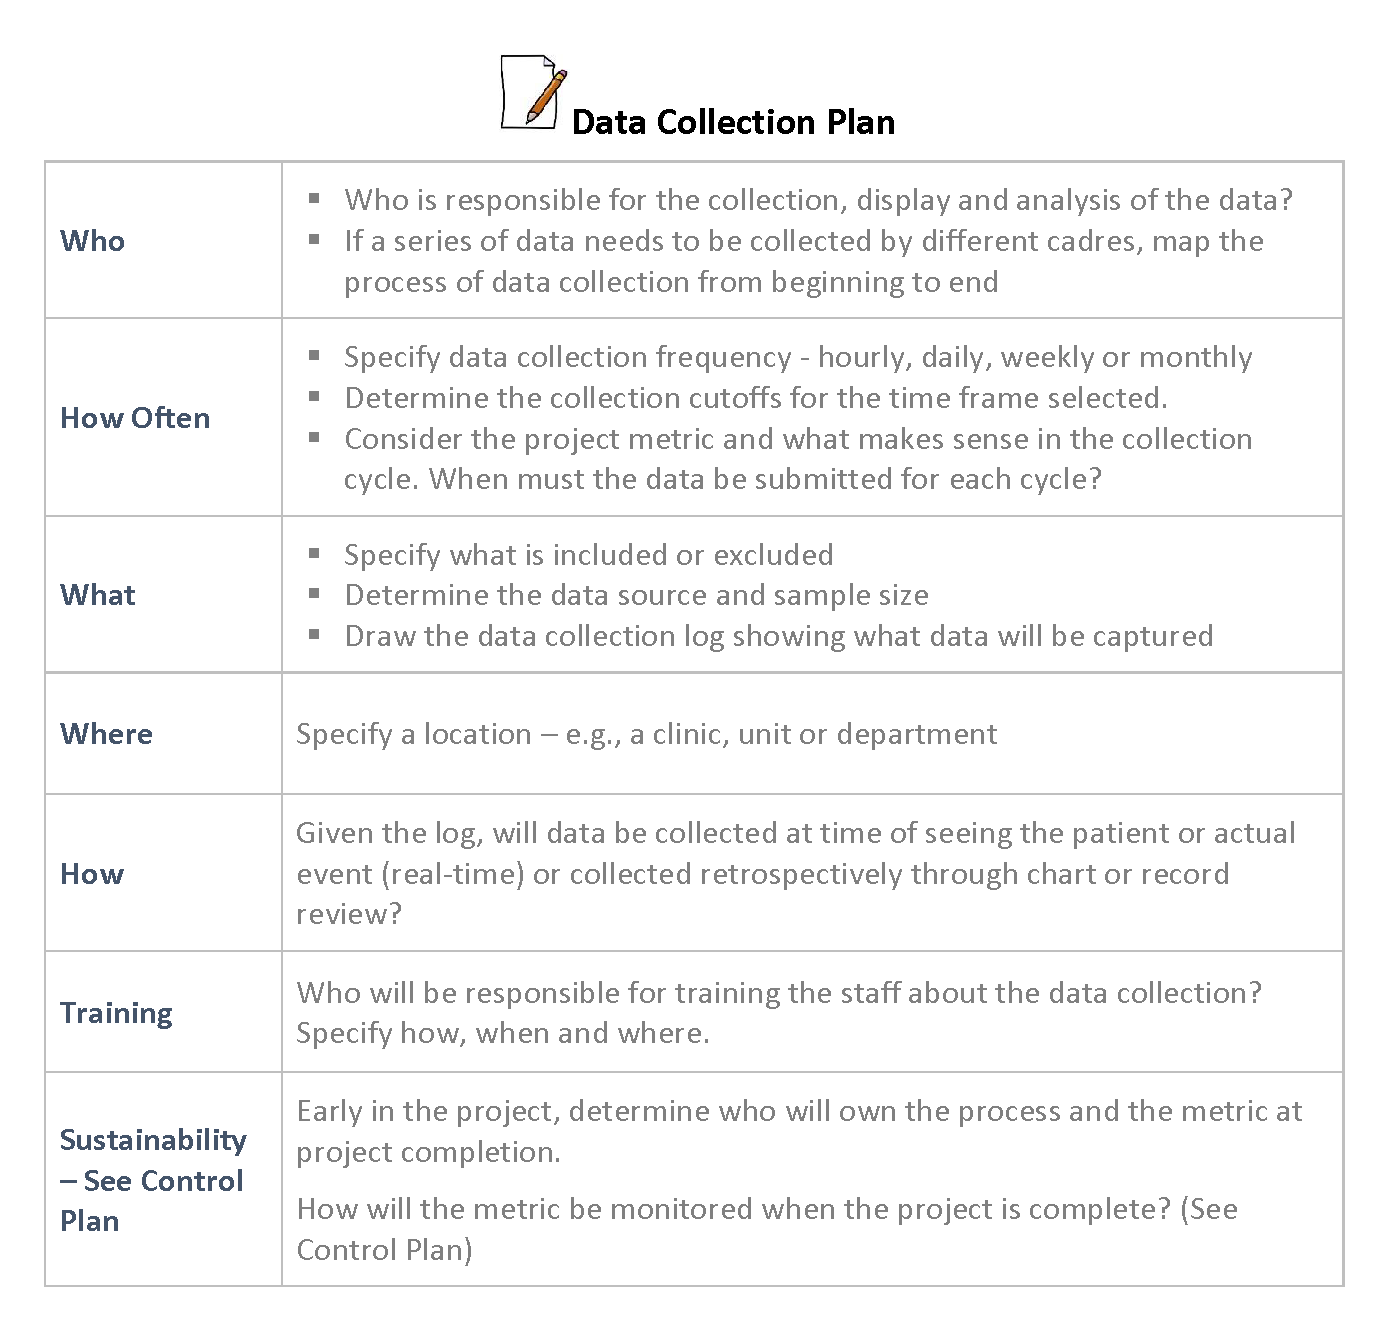
It is helpful to meet as a team to plan for the collection and tracking of the data for these measures. LARC has developed a useful list of the components to help your team plan who will track this information and how it will be tracked. Tap on the image to see the plan.
-
Quiz (5 min)
In the pre-test, we used an example of a facility that wanted to reduce clinic-acquired infection rates by increasing hand-washing among health care workers. See if you can match the different measures listed below to the type of measure.
-
Run Charts (2 min)
One of the most important uses of measures in QI is the run chart. A run chart is a graphic illustration of the progress being made towards the aims of the QI project.
Let’s return to our video to hear how Shay explains using run charts.
Note what Shay says about the frequency of data collection. Remember that for QI we track progress on a regular basis—for example, daily, weekly, or monthly—depending on the nature of the project and the data.
-
Elements of a Run Chart (3 min)
We will discuss the run chart further in Session 4, but for now we are introducing this important documentation element. Tap on the elements in the run chart to see brief descriptions of each.
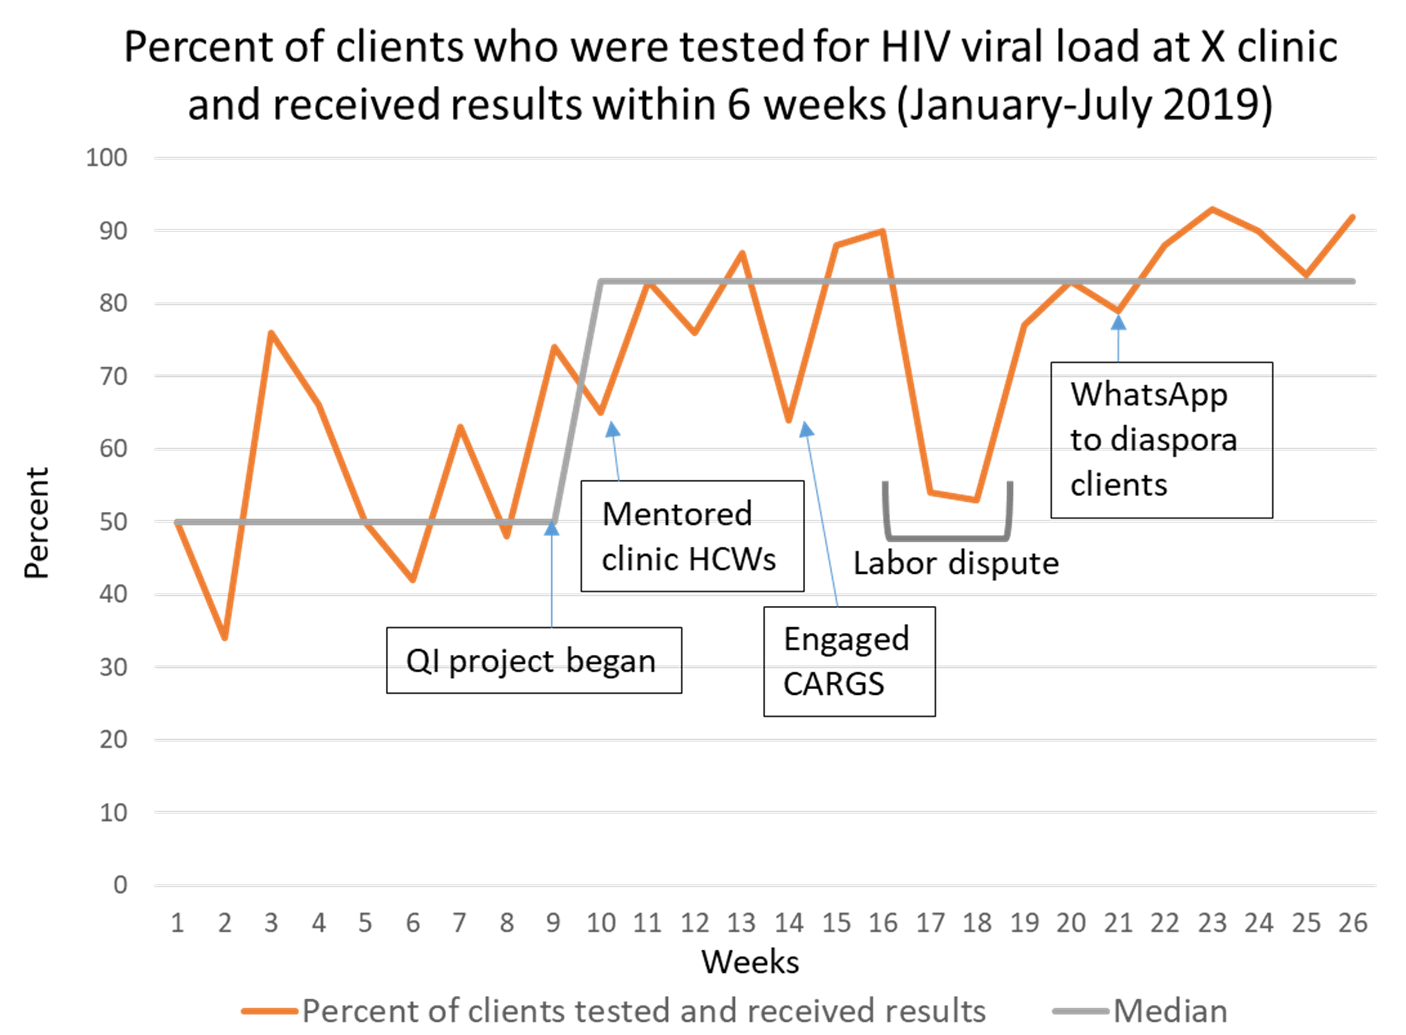
Title
Include specific information about what is displayed in the chart.
Annotations
Display notes that indicate at what points the QI efforts were initiated, and any other important information that may help understand the results shown in the graph. In this graph, the beginning of the project was annotated, and 3 different QI change ideas were implemented. An event (labor dispute which resulted in a nursing shortage) was also displayed to help explain the dip in results seen.
X-axis values
In a run chart, the X (horizontal) axis always is representing time, moving from left to right.
X-axis label
Indicates what the numbers represent. In this case the data was collected weekly.
Y-axis values
In a run chart, the Y (vertical) axis displays the range of numbers for your measure. This graph is displaying percentages, so the range is from 0 to 100.
Y-axis label
Indicate what the numbers represent, in this case percent of clients.
Graphed Data
The lines shown on the graph are the data that you have been collecting, and are shown in the legend along with the color of the line. In this graph, the orange line represents the percentage of clients tested and received results. The gray line represents the median over 2 time periods. The median is similar to the average; it shows the point in the middle of a range of points. To give a visual image of changes that result from the QI project, show two median lines: one for at least 6 data points before the QI project began, and one for at least 6 data points after the QI project began. In this graph, the median line before QI was 50; and the median line after the QI project was 83, suggesting a positive effect from the QI efforts.
-
Setting Measures for the Omega Clinic QI Project (8 min)

In our fictional case study of the Omega Clinic, the QI team had decided to work on index testing, and chose the previous month’s data as the baseline. The target for index testing was that at least 30% of the facility positives should come from index testing. Some of the data that the team reviewed are shown below.
Total index clients Total contacts line-listed # contacts per index client # of contacts tested # of contacts diagnosed HIV positive % HIV positive % positive HIV tests from index testing Oct 34 30 0.9 15 4 0.27 7 Nov 34 32 0.9 17 2 0.12 9 Dec 18 18 1.0 14 4 0.29 5 Jan 18 15 0.8 13 3 0.23 6.5 Feb 19 28 1.5 25 5 0.20 4.8 March 19 35 1.8 22 6 0.27 5.5 April 22 29 1.3 20 5 0.25 7 May 22 34 1.5 30 7 0.23 12 June 19 39 2.1 29 9 0.31 11.2 July 19 36 1.9 24 10 0.42 9.8 The QI team then set an aim:
- Increase the proportion of newly diagnosed clients who were identified via index testing at Omega clinic from 5.5% to 14% by 30 July 2019
- Increase the number of contacts listed per index client from 1.4 to 2.2 by 30 July 2019
-
Post-test (10 min)
Now that you have completed this session, let’s finish with a quick check of your knowledge and comfort around how to coach on setting aims and measures. Each question will have a score for you to track in your workbook. Please track your scores as you go through this assessment, compare them with your pre-test scores, and make note of any content areas where you answered incorrectly.
How did your post-test score compare to your pre-test score? If you found that you had some gaps in your knowledge or understanding, think about what you can do to fill in those gaps for yourself, and what resources you can access.
-
Summary (2 min)
Well done! You have completed the content in Session 3. In this session, we covered how to coach a team in writing SMART aims, and in identifying measures that are useful for tracking the progress of a QI project. We discussed several types of measures for the project, as well as how to identify measures that could be tracked for a test of change (PDSA). We spent some time looking at time-series graphs (run charts) to track progress towards an aim. We applied these concepts to our case example. And as always, we emphasised the importance of documentation and provided a tool for your team to use for planning data collection and tracking.
Take a few minutes to fill in the next section on the Action Plan. List some of the activities that you will conduct as you are working with the QI team to establish the baseline and aims of the QI project.
-
Resources
Refer to the Resources section for more full videos and tools.
Remember, if you need additional support or information, contact your supervisor or QI coordinator.
Title/Source File Model for Improvement Click to open file. LARC data collection Plan Click to open file. Action Plan Template Click to open file.