Session 4: How to Coach on Problem Analysis
In this session you will review coaching using different problem analysis tools.
Getting Ready For This Session
- Remember to have your workbook and a pen or pencil handy.
- You will need about 75–85 minutes to complete the session. You may want to break it up into smaller chunks of time.
Learning Objectives
At the end of this session, learners will be able to:
- Use QI tools to help the QI team understand the problem being addressed
- Describe how problem analysis leads to generating change ideas for quality improvement
- Explain the importance of documenting problem analysis
- Access available problem analysis tools and provide to QI team as appropriate
Learning Activities
-
Introduction (5 min)
This session will help you guide your team through the process of analysing the problem that is being addressed in the quality improvement project.
Once the team has identified the problem, it is important to understand the problem and its possible causes so that the team can develop ideas on how to make improvements.
There are many different problem analysis tools available. In this session we will review the three tools we use most widely in our programme.
-
Pre-test Self-assessment (5 min)
Let’s begin this session with a brief pre-check of your knowledge of problem analysis. Each question will have a score for you to track in your workbook. Please track your scores as you go through this assessment, and make note of any content areas that you answered incorrectly.
-
Problem Analysis (3 min)
Problem analysis involves thinking and learning about the details surrounding a problem, and the system in which it operates—that is, thinking about these things in a structured way.

Epworth team To start problem analysis, review the baseline information that is available about the problem, and then consider what additional information will help guide improvement. QI teams can work with a number of tools to help gather this additional information.
In this session, we will look at the three problem analysis tools most commonly used in our programmes: the 5 Whys, Fishbone Diagrams, and Process Mapping.
When using these tools, remember that a lack of resources—including staffing, space, training, and materials—is often identified as a contributing factor in problems identified. Despite this, improvement can often be achieved by adjusting or simplifying systems and processes. It is important for problem analysis to focus on finding possible causes that can be attributed to systems and processes instead of, or in addition to, the challenges posed by limited resources.
When facilitating a problem analysis activity, it may be helpful to have a notetaker filling in the diagram while you are conducting the discussion.
-
Three Problem Analysis Tools (5 min)
The three problem analysis tools that we will cover in this session all guide the user in more deeply understanding the problem. Each tool has a different focus:
The 5 Whys
Use this tool when you want to get below the surface to look for the possible root cause(s) of a problem.
This content scrolls across in smaller visible areas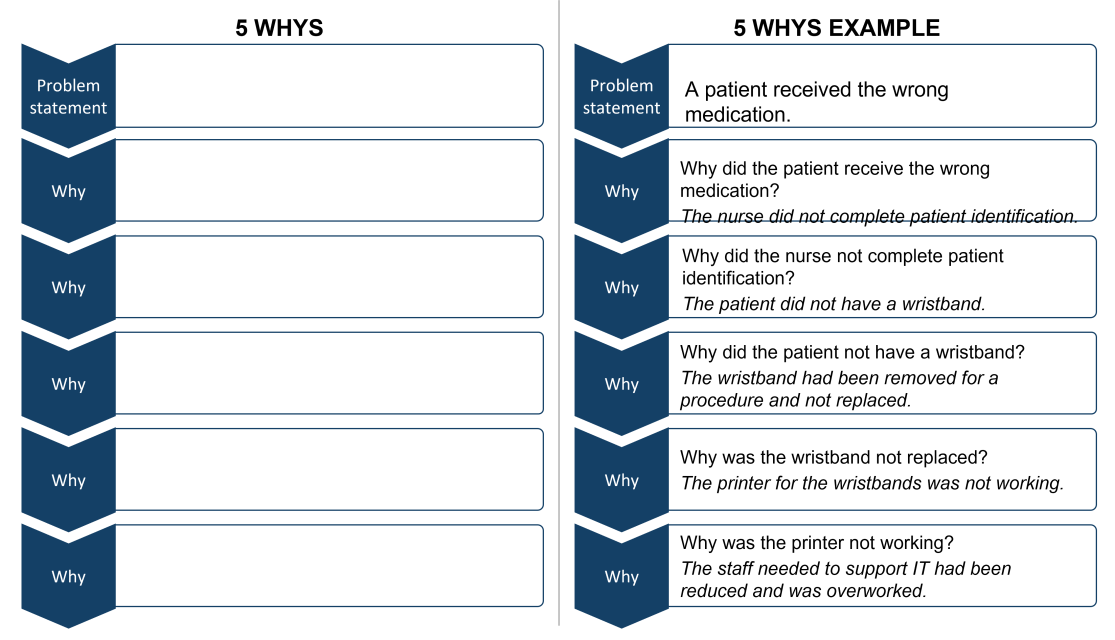
Process Mapping
Use this tool when you want to understand the steps involved in a situation.
This content scrolls across in smaller visible areas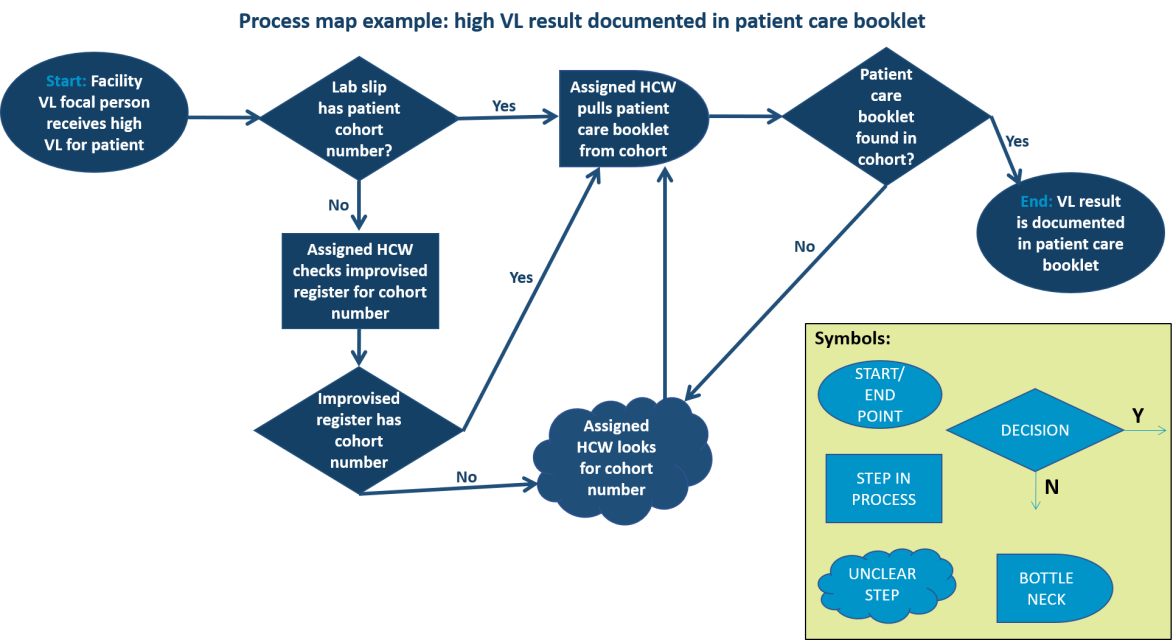
Fishbone Diagram
Use this tool when you want to look at several factors and circumstances that may be causing a problem.
This content scrolls across in smaller visible areas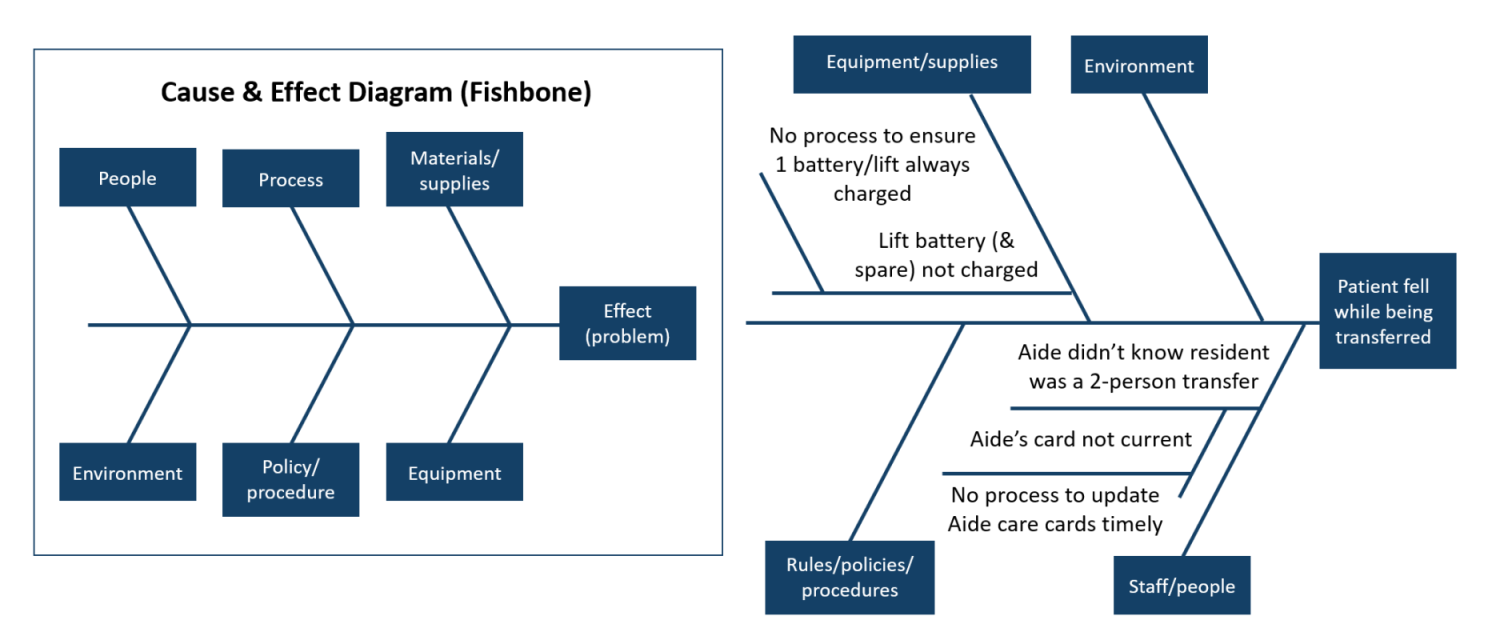
-
The 5 Whys Tool (2 min)
The 5 Whys tool is the simplest of the three tools we will be discussing. The process involves asking ‘why’ five times.
- First: Describe the problem as an event or process. What happened? What has been happening?
- Then ask why it happened or has been happening.
- After completing the 5 Whys, consider: What are the implications of this information? What might we do to change the result?
This content scrolls across in smaller visible areas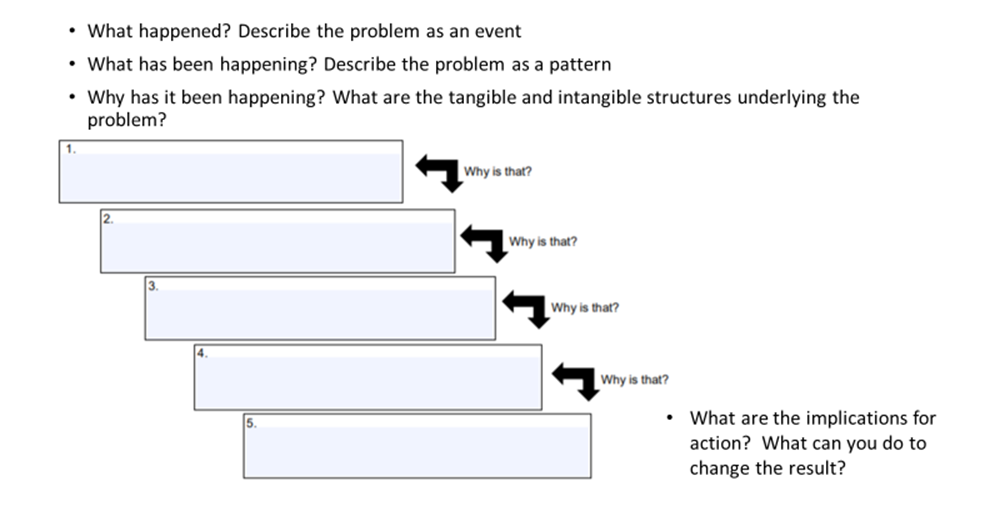
The principle underlying this simple tool is that often the perceived cause of a problem is actually just another symptom. This technique is attributed to the QI method known as Lean.
-
Coaching the Team on the 5 Whys Tool (3 min)
Let’s listen to Sonia as she talks about using the 5 Whys tool as part of coaching. Abbreviation referenced by Sonia is: CLI - clinic-laboratory interface project.
Transcript

When I coach a team through the 5 Whys tool, I remind them that the point of this is to look at a narrowly focused problem, and to find something in the process or system that contributes to this problem—something we can change to make an improvement. For complex questions and systems, we use other tools, like Fishbone and Process Mapping. [The] 5 Whys is great in our CLI project if we want to ask questions like,
SoniaWhy are clients who are due for VL collection not having their blood drawn when they come for medicine re-supply?
5 Whys example
Here is how one team approached the question of missing clients due for VL collection:
- Why are clients who are due for VL collection not having their blood drawn when they come to pick up their medications?
- Because the staff at clinic sometimes do not know the clients are due for VL when they come in.
- Why?
- Because there is incomplete documentation in the appointment diary and patient records.
- Why?
- Because no staff have been assigned responsibility for tracking and documentation of clients due for VL.
- Why?
- Because several staff are responsible for VL, each may assume others will perform the task.
- Why?
- Because morning meetings lack a procedure for delegating tasks, assignment of this VL tracking and documentation task sometimes gets overlooked.
This final Why identified a possible action that could be taken to improve the situation.
- Why are clients who are due for VL collection not having their blood drawn when they come to pick up their medications?
-
Practicing the 5 Whys (5 min)
In your workbook take the following question through the 5 Whys and see what you come up with:
-
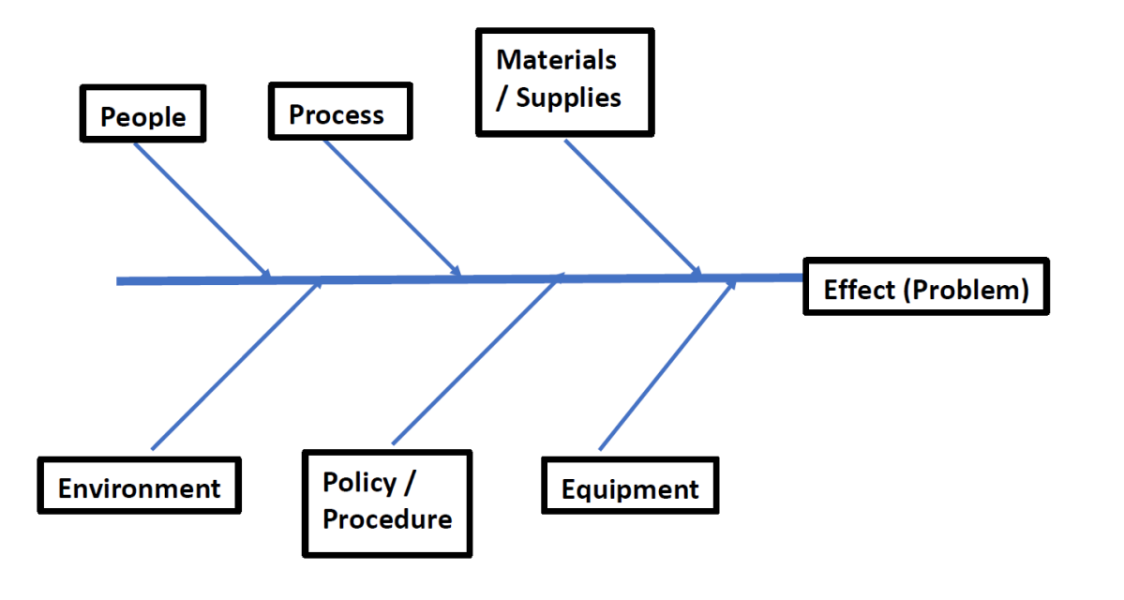
Fishbone (Ishikawa) Diagram (5 min)
The next tool we will review is the Fishbone (or Ishikawa) Diagram. This is another structured way to facilitate a discussion around the possible causes of a problem or undesirable situation. Using this tool allows teams to think more broadly than with the 5 Whys, and helps them to look at more complex contributions to a problem.
Click here to open a new window that shows an example of a team meeting to conduct a Fishbone activity. Scroll through the pages and note that the categories become fleshed out as the team comes up with ideas. You will see the parking lot getting filled in along the way, this will allow the team to save ideas for later discussion and testing.
-
Coaching the Fishbone (3 min)
Here are some suggestions to help facilitate a team session using the Fishbone Diagram:
- At the beginning of the session, explain the purpose of the Fishbone exercise—to look at a variety of possible contributors to a problem and determine which of those might lead to an improvement idea.
- Set some ground rules for participants—for example, raising hands to ask questions or make comments, respecting each other’s contributions (there are no ‘wrong’ answers), no blaming individuals. Ask team members to suggest ground rules and agree on them by consensus. Remind the team that their ideas are welcome, and that the focus is on the system, not on individual performance.
- State the problem or undesirable situation that the tool is being used to analyse. Write it at the head of the fishbone.
- Invite the team to brainstorm possible causes of that problem or situation.
- Group the possible causes into categories—human resources, processes, materials, documentation, equipment, etc. Some Fishbone templates begin with these. If you prefer, you can give the team some categories to start with.
- Change, drop, or add categories as needed.
As the Fishbone is filled in, team members will often come up with ideas for changes to try. It is a good idea to keep track of these ideas, listing them as the diagram is fleshed out. Later, when you come back together as a team to brainstorm ideas to test, you will have this list and diagram to jump-start your brainstorming.
-
Fishbone Exercise (10 min)
In Session 3, you wrote a SMART aim statement in your workbook for what you would like to improve. Please look at your aim statement and use the Fishbone template to analyse the problem related to your aim.
Start by writing the problem at the head of the fish, and then begin to flesh it out with some possible causes, breaking them down into various categories. Spend 10 to 15 minutes on this activity. If you choose to, you can bring in a partner to work with you on this.
You may want to use the standard categories that appear in many Fishbone templates, or feel free to develop your own. In addition, you may start a ‘parking lot’ for improvement ideas that emerge as you go through this process.
Once you have completed your diagram, take a step back to objectively review it.
- Do the categories need adjusting?
- Did this activity help you understand how to use the Fishbone Diagram? What questions remain for you?
- Was the Fishbone Diagram a good tool for the problem you are analysing? Was it too simple, or too complex?
- Did improvement ideas emerge that you might add to a parking lot, to be considered for testing with PDSA?
-
The Process Mapping Tool (5 min)
The final tool that we will review in this session is Process Mapping. This tool is used when the team wants to understand the steps in a process. You might even find that conducting a Fishbone or a 5 Whys analysis leads the team to realize that studying several steps in a process may help them to understand the problem being targeted in the improvement project.
Listen to Roe giving some information about how to conduct Process Mapping.
-
Coaching Process Mapping (15 min)
This recording shows an example of mapping the process of managing patients who receive a high HIV viral load test result. In this webinar, participants were assigned to small groups to map out the steps in the process. The portion of the webinar that you will see here is Francie facilitating the large group debrief.
When the webinar contributions were all in, the Process Map shown here was the result.
This content scrolls across in smaller visible areas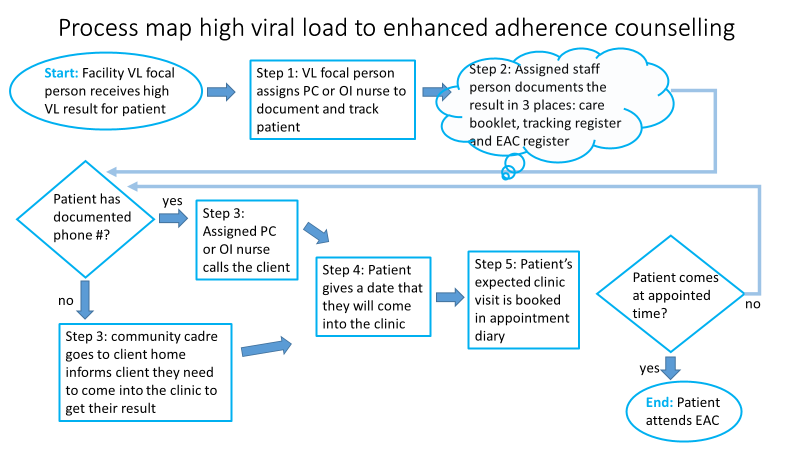
-
Process Mapping Table (2 min)
In the CLI project, the LARC consultants provided an additional tool for Process Mapping—the Process Mapping table. With this tool, each step in the Process Map is shown as a row of the table. As long as the process being mapped is linear, with one step following another, this tool can be useful. You can add detail about who is involved in the step, the amount of time consumed by the step, forms connected to the step, and any other details you may wish to consider.
This content scrolls across in smaller visible areas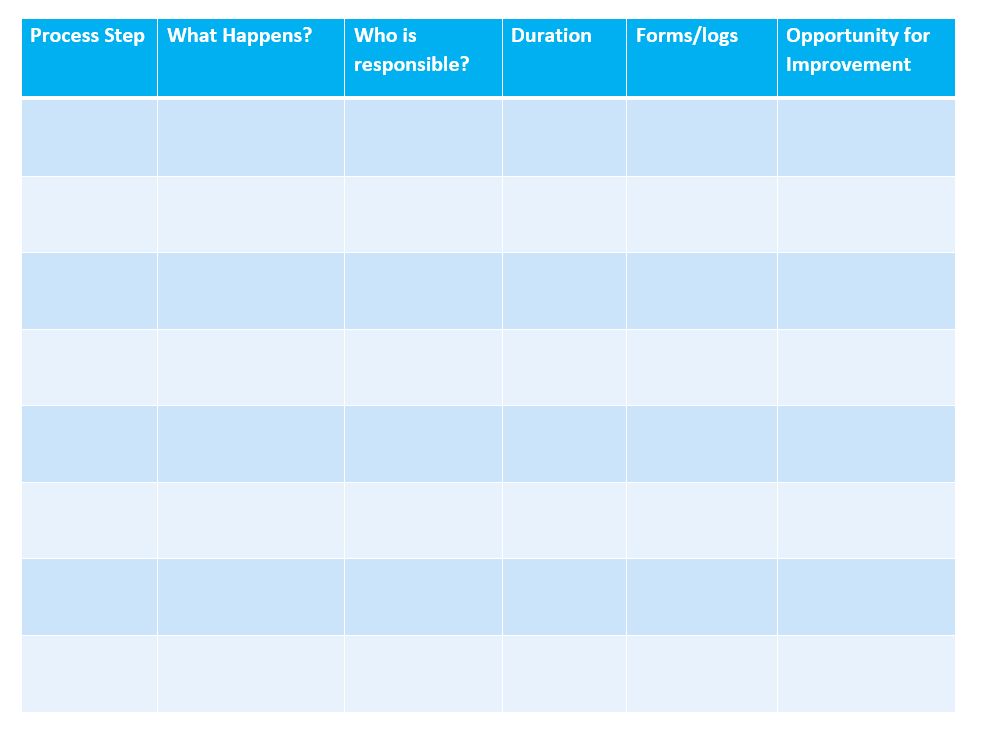
Whenever possible, it is helpful to observe the process after mapping it, to make sure you have taken into account all the steps and details of interest.
-
EICT Process Map at Omega Clinic (7 min)

We now return to our fictional example of the Omega Clinic.
In the last session, the team explored measures they would use to track improvement towards their aim to increase the proportion of clients newly diagnosed with HIV who were identified via index testing at the clinic.
The team met and had a general discussion of what they thought were causes of the problem. One of the main issues that came up in discussion was that team members felt that HCWs in clinic were not following standard guidelines for HIV index testing. They decided to do Process Mapping to understand where there might be areas for improvement in the process.
Tap on the first version of the Process Map that the Omega Clinic QI team developed. You may recognize this process map from the Index Testing Change Package or the Index Testing SOP, please note that this is just a part of the complete Process Map that we are using. It is fine to use just a portion of a larger Process Map to target in on areas for identifying change ideas.
When the Omega team reviewed their Process Map together, one point they noticed was an issue with clients accepting index testing, but then being reluctant to share contact information. They wondered why this was the case. To understand it better, they decided to implement a 5 Whys process.
-
Post-test (5 min)
Now that you have completed this session, let’s finish with a quick check of your knowledge and comfort around how to coach on problem analysis. Each question will have a score for you to track in your workbook. Please track your scores as you go through this assessment, compare them with your pre-test scores, and make note of any content areas where you answered incorrectly.
How did your post-test score compare to your pre-test score? If you found that you had some gaps in your knowledge or understanding, think about what you can do to fill in those gaps for yourself, and what resources you can access.
-
Summary (2 min)
In this session, we covered how to coach your team through the process of analysing the problem being addressed in the quality improvement project. We reviewed the three tools we use most widely in our programme—the 5 Whys tool, the Fishbone (Ishikawa) Diagram, and Process Mapping.
Each QI project will be unique, so the tools you choose for analysing the problem will depend on the context and situation in which your project exists. You may not need to use all the tools here—or you may use all of them, and use additional resources to analyse the problem further. Whatever you choose, these activities and tools will help your team to identify possible interventions to solve the problem. This will be covered in our next session.
Take a few minutes to fill in the next section on the Action Plan, list some of the activities that you will conduct as you are working with the QI team to conduct problem analysis.

-
Resources
Problem analysis templates
Title/Source File 5 Whys Click to open file. Fishbone Diagram Click to open file. Process Mapping Click to open file. Process Mapping table Click to open file. Action Plan Template Click to open file. Remember, there are many additional resources available in the Resources page.